
Suggesting Product Prices in Automotive E-Commerce: A Study
Assessing Regression Models and Explicability
Andr
´
e Gomes Regino
1 a
, Gilson Yuuji Shimizu
1 b
, Fernando Rezende Zagatti
1,4 c
,
Filipe Loyola Lopes
1 d
, Rodrigo Bonacin
1 e
, Julio Cesar Dos Reis
2 f
and
Cristina Dutra de Aguiar
3 g
1
DIMEC, Center for Technology Information Renato Archer, Campinas, Brazil
2
Institute of Computing, UNICAMP, Campinas, Brazil
3
Institute of Mathematical and Computer Sciences, USP, S
˜
ao Carlos, Brazil
4
Department of Computing, UFScar, S
˜
ao Carlos, Brazil
fl
Keywords:
Pricing, E-Commerce Analysis, Machine Learning.
Abstract:
E-commerce pricing may involve complex processes, including various factors such as cost, perceived value,
and market demand. Exploring machine learning (ML) for informing pricing in the automotive sector presents
significant open research challenges that require innovative solutions. This investigation examines a real-
world Brazilian e-commerce dataset to train, test, and compare several state-of-the-art regression models to
understand their applicability. Our study originally includes how SHapley Additive exPlanations (SHAP) help
to interpret the most influential features for price prediction. Results indicate that Light GBM and XGBoost
performed best, combining high predictive accuracy with computational efficiency, and reveal features such
as product weight, stock levels, and physical dimensions as the most influential on final pricing. This study
outcome paves the way for novel data-driven pricing strategies in Brazilian automotive e-commerce.
1 INTRODUCTION
The advancement of technology and the widespread
adoption of e-commerce have increased the volume
and variety of data generated in retail environments.
Unlike in-person shopping, online platforms enable
simultaneous interactions with numerous customers
while facilitating the systematic collection and stor-
age of consumer information. This transformation
has expanded data availability and reshaped sev-
eral business processes, from customer acquisition
(Patel, 2023) to fraud detection (Mutemi and Ba-
cao, 2024), demanding intelligent tools to support
decision-making and operational efficiency.
Pricing in e-commerce is a strategic decision that
directly affects a company’s profitability and compet-
a
https://orcid.org/0000-0001-9814-1482
b
https://orcid.org/0000-0003-3711-5592
c
https://orcid.org/0000-0002-7083-5789
d
https://orcid.org/0000-0002-4172-6532
e
https://orcid.org/0000-0003-3441-0887
f
https://orcid.org/0000-0002-9545-2098
g
https://orcid.org/0000-0002-7618-1405
itiveness (Kotler and Keller, 2022). Even small price
changes in high-volume retail can impact overall rev-
enue, especially in a low-margin market. Mispricing
can result in financial losses and, in extreme cases,
business failure (Xuming, 2024). Effective pricing
strategies aim to maximize revenue, increase market
share, and enhance customer satisfaction, balancing
production costs, consumer demand, and competition.
Traditional pricing methods like mark-up or
competition-based pricing are often inadequate in
digital commerce scenarios where pricing dynamics
are complex. Online markets demand real-time price
adjustments informed by large-scale and heteroge-
neous datasets. These may include historical pricing
trends, user behavior patterns, and competitor pro-
motions. Dynamic pricing, powered by algorithmic
models, addresses these needs (El Youbi et al., 2023)
but poses challenges like data integration, continuous
competitor tracking, and adapting to fast-changing
market conditions.
Research into data-driven pricing models is es-
sential for competitiveness and financial sustainabil-
ity in digital markets. In the same direction, Artificial
Regino, A. G., Shimizu, G. Y., Zagatti, F. R., Lopes, F. L., Bonacin, R., Reis, J. C. and Dutra de Aguiar, C.
Suggesting Product Prices in Automotive E-Commerce: A Study Assessing Regression Models and Explicability.
DOI: 10.5220/0013830400004000
Paper published under CC license (CC BY-NC-ND 4.0)
In Proceedings of the 17th International Joint Conference on Knowledge Discovery, Knowledge Engineering and Knowledge Management (IC3K 2025) - Volume 1: KDIR, pages 147-158
Proceedings Copyright © 2025 by SCITEPRESS – Science and Technology Publications, Lda.
147

Intelligence (AI) and Machine Learning (ML) help
businesses analyze large volumes of data, detect de-
mand patterns, adjust prices in real-time, and antici-
pate market trends (El Youbi et al., 2023). These tech-
nologies enable more dynamic and data-driven pric-
ing strategies (Aparicio and Misra, 2023).
Automatically determining the optimal price re-
mains complex and challenging due to factors like
seasonality, competition, and production costs. These
variables are often interdependent and can change
rapidly, introducing high levels of volatility and un-
certainty into pricing strategies. As a result, compa-
nies struggle to understand the rationale behind pric-
ing recommendations, which can hinder trust in au-
tomated systems and limit their adoption in dynamic
markets.
This article investigates regression models for the
pricing task. These models offer a practical balance
between simplicity, precision, and performance. They
may enable interpretation of how input variables –
such as product weight, dimensions, and stock levels–
affect pricing outcomes. In particular, our investiga-
tion considers the Brazilian automotive sector as the
context of our data-driven pricing models. This con-
text presents high production costs, fluctuating de-
mands, and a strong influence on perceived values.
Such context was poorly studied in the literature and
motivates novel analyses and contributions.
Our investigation introduces the following contri-
butions:
• Original analyses leveraging real-world dataset
from the Brazilian automotive e-commerce sector.
• Evaluation of nine well-studied ML models with
default and fine-tuned hyperparameters, includ-
ing linear, tree-based, and neural network models:
Linear Regression, Random Forest, Lasso, Ridge,
Support Vector Machine (SVM), XGBoost, Light
GBM, Long Short Term Memory (LSTM), and
Feed Forward.
• Interpretation of the model predictions using
SHapley Additive exPlanations (SHAP) (Lund-
berg and Lee, 2017), chosen for its ability to pro-
vide consistent local explanations. SHAP high-
lights the most influential features in pricing,
making it easier to understand how each variable
impacts predictions in the automotive sector.
Our study found that LightGBM and XGBoost
offered the best balance between accuracy and effi-
ciency for price prediction tasks. Hyperparameter op-
timisation further enhanced model performance, con-
sistently reducing prediction errors. SHAP analysis
revealed that key factors influencing product price in-
clude weight, stock quantity, sales volume, and phys-
ical dimensions.
The remaining of this article is organized as fol-
lows. Section 2 reviews related work. Section 3 de-
scribes the overall methodology, including data col-
lection, exploratory analysis, preprocessing, model
development, training, and assessment. Section 4
presents the results whereas Section 5 discusses them.
Section 6 concludes the article and highlights future
investigations.
2 RELATED WORK
The study presented by (Bhaskar et al., 2022) ad-
dresses the issue of consumer deception in the used
car market through price manipulation. To mitigate
this problem, three regression models are developed
to predict the selling price of used vehicles based on
features such as listed price and mileage. The mod-
els evaluated include Linear Regression, Lasso Re-
gression, and an ensemble approach combining both.
The dataset, obtained from Kaggle, underwent pre-
processing steps like removing missing values and
categorical encoding. Among the evaluated models,
the ensemble regression achieved the highest predic-
tive accuracy (94%), indicating its effectiveness in es-
timating used car prices. In contrast to this approach,
our study explores the pricing problem within a dif-
ferent context—namely, the Brazilian automotive e-
commerce sector—where pricing dynamics are influ-
enced by additional factors such as inventory levels,
product dimensions, and temporal variables like the
date of sale. We expand the methodological scope
by evaluating nine distinct regression models, encom-
passing linear, tree-based, and neural network mod-
els. While both studies share the goal of price pre-
diction in the automotive sector, our work addresses a
broader, more complex set of variable.
(Chowdhury et al., 2024) explored the use of su-
pervised ML models to optimize pricing strategies in
e-commerce, with a focus on predicting customer sat-
isfaction. Using a dataset with features such as histor-
ical prices, customer demographics, and transaction
data, the authors compare the performance of Linear
Regression, Decision Trees, Random Forest, SVM,
and Neural Networks models, to predict customer sat-
isfaction based on price prediction. The main con-
tribution of the study is in the comparative evalua-
tion of the models regarding their predictive capac-
ity, where Neural Networks presented the best overall
performance. However, the high computational cost
of the Neural Network may be a barrier to practical
use. Random Forest emerged as a viable alternative,
balancing accuracy (MAE 0.130, R
2
0.82) with inter-
KDIR 2025 - 17th International Conference on Knowledge Discovery and Information Retrieval
148

pretability and lower resource demands. In contrast to
this general-purpose approach, our study focuses on
pricing in the Brazilian automotive e-commerce sec-
tor.
The work described by (Akash et al., 2024) inves-
tigated the price of the “Toyota” cars based on the cus-
tomer’s requirement. The dataset, obtained from Kag-
gle, contained 1442 examples. ML training used 80%
of the data, while 20% was used for testing. Ridge
was used to predict the sales price, and the model
showed results with almost 93% accuracy. In contrast,
our study focuses on the automotive parts and materi-
als, instead of the whole car. Furthermore, we are not
limited to just one ML model and provide model ex-
plainability, highlighting the most impactful features.
(Das et al., 2024) investigated real-time dynamic
pricing strategies in the context of retail and e-
commerce, benchmarking Linear Regression, Ran-
dom Forest, and Gradient Boosting Machines (GBM)
algorithms to predict optimal prices. The dataset,
composed of records from different sectors (e.g., elec-
tronics and apparel), included variables such as price
history, competitor prices, promotional status, inven-
tory levels, and consumer demographics. The results
indicated that GBM achieved the best performance in
all evaluated metrics, reaching MAE of 1.73, RMSE
of 2.01, and R² of 0.94, demonstrating a greater abil-
ity to capture nonlinear patterns and complex interac-
tions between variables. In addition to predictive eval-
uation, the authors highlight the relevance of attribute
engineering, class balancing, and simulation of real
scenarios to validate the applicability of the proposed
strategies. In contrast, our work focuses specifically
on the automotive domain and also seeks to promote
the explainability of the best model used.
Table 1 compares the related studies regarding the
models employed. To the best of our knowledge, our
study is the first to investigate how these models be-
have experimentally and are relevant to apply to the
Brazilian automotive e-commerce context.
3 INVESTIGATING PRODUCT
PRICES THROUGH
REGRESSION METHODS
This section describes the methodology employed to
investigate the problem of product prices in Brazilian
automotive e-commerce. The methodology is struc-
tured into six main stages: data acquisition (Sec-
tion 3.1), exploratory analysis and cleaning (Section
3.2), model selection (Section 3.3), algorithm exe-
cution (Section 3.4), result evaluation (Section 3.5),
and model explainability (Section 3.6) as illustrated
in Figure 1.
3.1 Data Collection
We employed a dataset provided by GoBots
1
, a
Brazilian startup offering AI-based services for e-
commerce platforms. The dataset contains detailed
information about products, pricing, and sales history.
Data extraction was performed using MongoDB.
Filters: To ensure data quality and relevance, we
applied the following filters:
1. Sample Size: A maximum of 100, 000 products
were selected to ensure analytical feasibility while
maintaining representative diversity. This sample
was drawn from a larger pool of 4.5 million prod-
ucts.
2. Time Range: Data spanned from January to De-
cember 2023, covering seasonal events such as
Black Friday.
3. Automotive Sector: Chosen based on GoBots’ ex-
pertise and the strategic importance of automotive
parts within e-commerce, a segment associated
with heightened consumer urgency. Observations
indicate that consumers searching for automotive
products tend to exhibit stronger purchase intent
and greater immediacy than in other sectors. For
instance, a customer searching for a replacement
tire must substitute a worn-out tire to maintain the
vehicle’s operability promptly.
4. Status: Only products sold and active (i.e., not out
of stock) were considered.
Collected Fields: We collected the following at-
tributes (summarized in Table 2):
• orderCreated: A timestamp indicating when the
purchase was registered. This temporal field en-
ables derivation of features such as month, week
of the year, or even position within the month
(e.g., begin, end). These derived features allow
the models to capture temporal price variation pat-
terns, such as consumer behavior around salary
periods or promotional events like Black Friday
and Christmas.
• initialQuantity: Represents the initial inventory
available at the start of a product’s sales cycle.
This value serves as a proxy for the product’s sup-
ply conditions and potential market expectations.
A higher initial quantity may indicate widespread
availability or popularity, which can influence
pricing strategies;
1
Available at: https://gobots.ai/
Suggesting Product Prices in Automotive E-Commerce: A Study Assessing Regression Models and Explicability
149
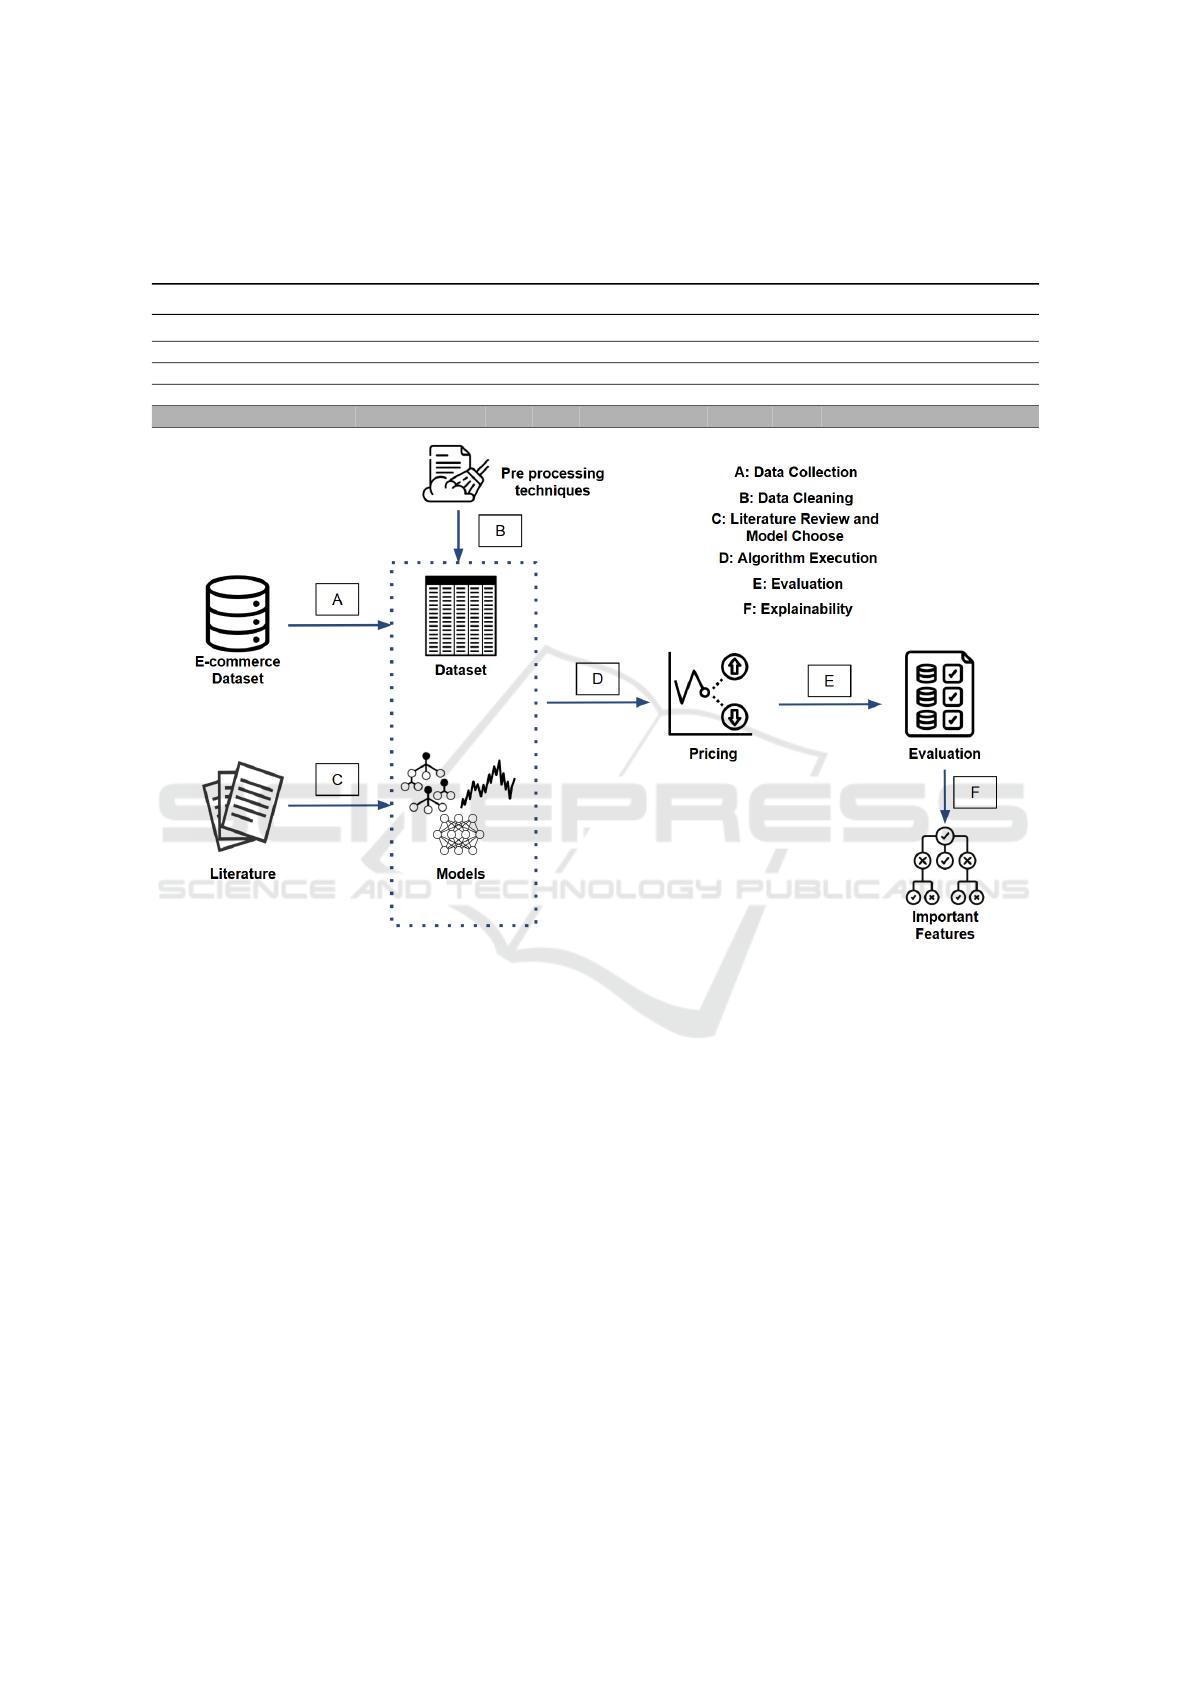
Table 1: Comparison of our work and related studies. The ML models considered are: Linear Regression (LR); Decision
Tree (DT); Lasso (La); Ridge (Ri); Random Forest (RF); Gradient Boosting Machines (GBM); XGBoost (XG); LightGBM
(Li); Support Vector Machine (SVM); Feedforward Neural Network (FF); and Long Short-Term Memory Neural Network
(LSTM). The ✓symbol indicates the ML models addressed by each study.
Study Domain LR DT La Ri RF GBM XG Li SVM FF LSTM
(Bhaskar et al., 2022) Automobilistic ✓ ✓
(Chowdhury et al., 2024) Not defined ✓ ✓ ✓ ✓ ✓ ✓
(Akash et al., 2024) Automobilistic ✓
(Das et al., 2024) Not defined ✓ ✓ ✓
This study Automobilistic ✓ ✓ ✓ ✓ ✓ ✓ ✓ ✓ ✓
Figure 1: Methodology: A) Data Collection; B) Data Analysis and Cleaning; C) Model Selection; D) Algorithm Execution;
E) Evaluation; F) Explainability.
• availableQuantity: Number of units in stock dur-
ing data collection. This dynamic attribute pro-
vides insights into stock pressure. A low value
suggests scarcity, justifying higher prices, while
a high value may indicate overstock, encouraging
discounts to boost demand.
• soldQuantity: Cumulative number of units sold.
This variable indicates product demand. High
sales volumes may be associated with stronger
pricing power, while low sales could trigger price
reductions or promotional activity.
• domain: Denotes the market vertical of the prod-
uct. In this study, the dataset is constrained to
the automotive domain, where consumers are of-
ten driven by necessity and urgency, which can
influence willingness to pay.
• category: Indicates the product subcategory (e.g.,
“brake light”, “air filter”). Different categories
may reflect different levels of urgency, elasticity,
and competition. Safety-critical parts may com-
mand premium prices and faster purchase deci-
sions, while others are more discretionary.
• condition: Describes the state of the product (e.g.,
new, used, refurbished). Product condition di-
rectly impacts consumer expectations and accept-
able pricing. New items generally have higher
perceived value, whereas used items may require
price adjustments to remain competitive.
• weight and dimensions: The logistical attributes
(width, height, length and weight) can indirectly
affect pricing, especially when shipping costs or
storage constraints are factored into the pricing
strategy.
• price: The target variable for the regression mod-
els. It reflects the final listed price at the time of
sale and encapsulates the combined effect of all
KDIR 2025 - 17th International Conference on Knowledge Discovery and Information Retrieval
150

Table 2: Summary of the Collected Fields.
Field Data Type Example
orderCreated datetime "2024-06-07T23:59:59.000Z"
initialQuantity number 1392
availableQuantity number 86
soldQuantity number 1306
domain string "MLB-AUTOMOTIVE TIRES"
category string "Luz de Freio"
condition string "new"
weight number 47.0
height number 2.0
width number 14.0
length number 19.0
price number 105
other features. The primary objective of the pre-
dictive model is to estimate this value based on the
available product and contextual attributes.
3.2 Exploratory Analysis and Data
Cleaning
Initial Exploratory Analysis: After data collection,
we performed an initial exploratory analysis by exam-
ining the numerical features using descriptive statis-
tics. Table 3 summarizes these statistics.
The variable price revealed great variability,
with prices ranging from R$5 to approximately
R$109,000. The variable initialQuantity, which rep-
resents the initial quantity of products in stock, pre-
sented an average of 2, 372.88 units and a high stan-
dard deviation (6, 503.62), indicating wide variation
in stock capacity among products and retailers. The
same dispersion pattern was observed in available-
Quantity and soldQuantity, which varied from 1 to
99, 999 available products (average of 873.56) and
from 0 to 45, 056 products sold (average of 1, 500.13),
respectively.
Next, we investigated missing values. About
27.1% of the rows had null values in the fields weight,
height, width, and length. These rows were removed
from the dataset. The analysis of unique values was
applied to the categorical variables. We observed
that the variable domain contained 329 unique val-
ues, category had 375 distinct categories, and con-
dition presented only three variations. Next, a cor-
relation analysis, based on Pearson’s correlation co-
efficient, was constructed among the numerical vari-
ables
2
. We identified a strong positive correlation
between the variables initialQuantity and available-
Quantity (coefficient of 0.91), indicating that these
variables tend to increase or decrease together. We
also observed a moderate correlation between ini-
tialQuantity and soldQuantity (0.51), suggesting that
products with larger initial stock tend to have higher
2
Available at: https://github.com/andreregino/pricing/
blob/main/matriz-correlacao.png
sales volumes. Further, the variables dimension and
weight exhibited moderate correlations both among
themselves and with the target variable price, support-
ing their inclusion as relevant features in the predic-
tive modeling process. The diversity of categories is
illustrated in Figure 2, which shows a word cloud fea-
turing the most frequent terms in the category vari-
able, including items such as “tires”, “filters” and
“speakers”.
Figure 2: Category word cloud.
Finally, we examined the behavior of the variable
price, which revealed a pronounced skewness. The
calculated skewness value was 2003.62, suggesting
the presence of a long right tail in the distribution.
This observation is supported by the descriptive statis-
tics presented in Table 3, which indicate a mean of
R$ 257.34 contrasted with a significantly higher max-
imum value of R$ 109,097.10. Such skewness high-
lights the need for standardization to prevent extreme
values from negatively impacting the performance of
certain machine learning algorithms.
Data Cleaning and Transformation: We exe-
cuted the data cleaning and transformation, focusing
on preparing data for predictive modeling.
• Timestamp transformation: The orderCreated
timestamp was split into components (month, day,
weekday, week, and hour), enabling finer-grained
temporal analysis;
• Categorical encoding: All categorical columns
were one-hot encoded. In particular, the category
and domain fields generated numerous new binary
columns due to their high cardinality. However,
given the dataset size (100, 000 rows), the added
dimensionality did not introduce sparsity-related
issues;
• Numeric standardization: All numerical features
were standardized using z-score normalization.
This standardization adjusts the data to have a
mean of zero and a standard deviation of one, con-
tributing to the performance and convergence of
various machine learning models employed dur-
ing the predictive modeling phase.
Suggesting Product Prices in Automotive E-Commerce: A Study Assessing Regression Models and Explicability
151

Table 3: Descriptive Statistics for the Numeric Features.
Variable Mean Std Min 25% 50% 75% Max
initialQuantity 2,372.88 6,503.62 1.00 81.00 301.00 1,536.00 101,401.00
availableQuantity 873.56 4,653.38 1.00 9.00 345.00 1,520.00 99,999.00
soldQuantity 1,500.13 4,347.25 1.00 26.00 125.00 713.00 45,056.00
weight 3,148.53 7,476.56 1.00 340.00 840.00 2,295.00 900,000.00
height 15.86 25.24 1.00 7.00 11.00 18.00 419.00
width 24.20 15.51 1.00 14.00 20.00 29.00 348.00
length 41.91 42.04 1.00 19.00 30.00 47.00 2,720.00
price 257.34 354.10 5.53 70.12 155.24 309.53 109,097.10
3.3 Techniques and Model Choice
The techniques were selected according to a previ-
ous literature review on dynamic pricing and the ap-
plication of machine learning in this context. The
following ML techniques were selected for evalua-
tion: Linear Regression, Lasso Regression, Ridge
Regression, Support Vector Machines (SVM), XG-
Boost, LightGBM, Feedforward Neural Networks,
and LSTM Neural Network. Cross-validation tech-
niques were used to ensure robust and generalizable
models.
3.4 Algorithm Execution
The next step involved developing the models using
popular ML frameworks (e.g. Scikit-learn
3
and Ten-
sorFlow
4
). Two executions were performed for each
ML technique: the baseline model training (using
the default hyperparameters provided by the libraries)
and the tuned model training (hyperparameters from
grid search).
The dataset was split into training, validation, and
test sets using a 70/15/15 ratio. All experiments were
carried out on Google Colab
5
, using a cloud server
with the following configuration: 100 GB storage, 12
GB system RAM, and 15 GB GPU RAM (T4 GPU).
Further details regarding model configurations, hy-
perparameters, and experimental setup are provided
in Section 4.
3.5 Evaluation
In this step, we evaluated the models’ results. Effi-
ciency metrics such as MSE, RMSE, MAE, and R
2
were employed. These metrics allow for assessing the
model’s accuracy in terms of the difference between
the predicted price and the actual price. We further
3
Available at: https://scikit-learn.org/
4
Available at: https://www.tensorflow.org/
5
Available at: https://colab.research.google.com/
measured the total training and prediction times —
i.e., the time required to run the models on the training
and test sets. These metrics are important for assess-
ing the practical feasibility of the models, particularly
in pricing systems that require fast responses for large
volumes of data.
3.6 Explainability
Once the best model and configuration were identi-
fied, the SHAP explainability algorithm was applied
to the test set to understand which product features
most significantly contribute to the final price.
4 RESULTS
This section presents our outcomes. Section 4.1 dis-
cusses the results of the baseline models, i.e., mod-
els trained using default hyperparameters. Section 4.2
presents the results of the refined models, where hy-
perparameters were tuned. Section 4.3 describes the
results related to the model’s performance, focusing
on the time required to execute them. Section 4.4 ad-
dresses aspects related to model explainability.
4.1 Baseline Models
Table 4 presents the obtained results sorted in ascend-
ing order based on the R
2
values for the test set. These
values provide an initial assessment of each model’s
predictive performance.
The Lasso regression model yielded the poorest
results, with a R
2
of 0% on the test set. This suggests
that when trained using default hyperparameters, the
model could not learn meaningful patterns from the
data and failed to generalize appropriately.
The LSTM and XGBoost models presented com-
petitive effectiveness. The LSTM model achieved an
MAE of 0.264 and an R
2
of 64.12% on the test set.
Similarly, the XGBoost model showed strong results,
KDIR 2025 - 17th International Conference on Knowledge Discovery and Information Retrieval
152

Table 4: Evaluation of Results for the Baseline Models. Training and testing times were measured in seconds. The best results
for each metric are shown in bold. SVM values are not reported in the table as the model did not complete execution within a
reasonable time (< 9,999 seconds). The values are displayed in ascending order by R
2
.
Model Validation Test Time (s)
MAE MSE RMSE R² MAE MSE RMSE R² Train Test
SVM - - - - - - - - - -
Lasso 0.570 0.845 0.919 0.00% 0.583 1.030 1.014 0.00% 2.040 0.089
Ridge 0.354 0.431 0.656 49.03% 0.363 0.557 0.747 45.88% 1.826 0.089
Linear Regression 0.351 0.428 0.654 48.90% 0.362 0.497 0.705 48.50% 9.400 0.159
Feed Forward 0.290 0.315 0.561 62.43% 0.299 0.378 0.615 60.78% 215.345 1.510
Light GBM 0.274 0.273 0.523 67.68% 0.278 0.399 0.632 61.24% 3.093 0.181
XGBoost 0.260 0.258 0.508 69.45% 0.264 0.370 0.608 64.12% 35.503 1.017
LSTM 0.279 0.280 0.529 66.58% 0.287 0.346 0.588 64.13% 176.017 1.466
Random Forest 0.207 0.222 0.471 73.78% 0.212 0.334 0.578 67.54% 734.724 0.851
followed closely by the LightGBM, which also per-
formed well under default settings. These models
stand out due to their ability to model complex, non-
linear relationships and temporal dependencies.
The Feedforward Neural Network, while outper-
forming the linear models in terms of MAE, still fell
short of the results exhibited by the tree-based mod-
els. This result reflects the model’s capacity to han-
dle non-linearities, with some limitations compared
to ensemble-based approaches.
Both Linear Regression and Ridge Regression
presented similar outcomes. As relatively inter-
pretable and straightforward models, they serve as
useful baselines, yet their inability to capture non-
linear patterns limits their effectiveness. It is worth
noting that the SVM model could not be evaluated
due to excessive training time. The model exceeded
9, 999 seconds without completing the training phase,
prompting the decision to abort its execution to ensure
computational feasibility. The Random Forest model
exhibited the longest training time among all models
whose execution duration did not exceed 9, 999 sec-
onds.
4.2 Tuned Models
Table 5 presents the obtained results from the re-
gression models after hyperparameter tuning. We
chose the best hyperparameter configurations
6
for
each model using a grid search strategy. The evalu-
ation was conducted on both the validation and test
sets using the same performance metrics employed in
the baseline evaluation, namely MAE, MSE, RMSE,
and R
2
.
The tuned models showed notable improvements,
significantly varying across different approaches.
Among them, the tuned LightGBM model stood out
as the most effective. It achieved the lowest abso-
6
Available at: https://github.com/andreregino/pricing
lute and squared errors on validation and test sets,
along with R
2
scores exceeding 72%. This consis-
tent performance highlights its strong ability to gen-
eralize to unseen data, making it a robust choice for
price prediction tasks. The tuned XGBoost model
was followed closely, delivering slightly lower met-
rics than LightGBM and maintaining solid overall
performance.
These results suggest that XGBoost remains a vi-
able and competitive alternative, particularly in sce-
narios where interpretability and efficiency are also
valued. The tuned Random Forest showed compet-
itive results, though marginally below the top two
models. Meanwhile, the Feedforward Neural Net-
work showed more modest performance, with a lower
ability to explain the variance in the data, indicating
some limitations in capturing complex relationships
under the tested configuration.
Despite hyperparameter tuning, linear models
such as Ridge and Lasso remained limited in accuracy
and explanatory power, with R
2
scores around 48%.
These findings underscore the importance of fine-
tuning in more complex models—especially those
based on decision trees and gradient boosting frame-
works — as a way to maximize predictive perfor-
mance in tasks involving multiple, potentially non-
linear features.
4.3 Computational Performance Results
Regarding computational performance, Figure 3a il-
lustrates the training time across all models
7
. The
models were trained on 75, 000 products and vali-
dated on an additional 15, 000 products.
The training time analysis (Figure 3a) distin-
guishes between base (green) and tuned (blue) mod-
els. The tuned Feed Forward network required the
7
Prediction inference time available at: https://github.
com/andreregino/pricing/blob/main/prediction-time.png
Suggesting Product Prices in Automotive E-Commerce: A Study Assessing Regression Models and Explicability
153

Table 5: Evaluation of the Results for the Tuned Models. Training and test times were measured in seconds. The best results
for each metric are shown in bold. The values are displayed in ascending order by R
2
.
Model Validation Test Time (s)
MAE MSE RMSE R² MAE MSE RMSE R² Train Test
SVM 0.427 0.548 0.740 34.57% 0.441 0.624 0.790 35.26% 999.99+ 139.215
Lasso 0.351 0.427 0.654 49.00% 0.363 0.500 0.708 48.07% 88.272 0.095
Linear Regression 0.351 0.428 0.654 48.90% 0.362 0.497 0.705 48.50% 9.400 0.159
Ridge 0.351 0.428 0.654 48.90% 0.362 0.497 0.705 48.50% 9.052 0.092
Feed Forward 0.286 0.317 0.563 62.21% 0.291 0.354 0.595 63.26% 999.99+ 1.467
LSTM 0.276 0.275 0.525 67.14% 0.282 0.325 0.702 66.26% 360.400 1.170
Random Forest 0.243 0.219 0.468 73.85% 0.249 0.282 0.531 70.73% 637.962 0.383
XGBoost 0.241 0.211 0.459 74.87% 0.247 0.273 0.523 71.67% 169.045 0.505
Light GBM 0.227 0.203 0.450 75.79% 0.235 0.268 0.517 72.23% 21.386 0.768
longest training time (1274.8 seconds, approximately
21 minutes), more than double of the tuned Random
Forest model (637.9 seconds). These results highlight
the computational cost associated with hyperparam-
eter tuning in neural networks, particularly with re-
spect to parameters such as the number of layers, reg-
ularization techniques, and optimization strategies.
Conversely, Ridge and Lasso regression models —
both in base and tuned versions — were the fastest to
train, taking less than 10 seconds, reflecting their al-
gorithmic simplicity. Most of the linear models (e.g.,
Ridge, Lasso, and Linear Regression) had low com-
putational overhead, while tuned neural networks and
tree-based models required substantially more train-
ing time, as expected.
Figure 3b reports the prediction time for 10, 000
data entries. The tuned Feed Forward model was
again the slowest (1.510 seconds), closely followed
by its base version (1.467 seconds). LSTM mod-
els, both base and tuned, also recorded relatively long
prediction times due to their complex internal struc-
ture. Although Random Forest demonstrated high
predictive accuracy, it lagged behind in inference ef-
ficiency. Notably, LightGBM (both base and tuned)
showed exceptional prediction speed, with execution
times under 0.2 seconds, confirming its suitability for
real-time pricing tasks.
4.4 Explainability
Figure 4 presents the results regarding explainabil-
ity. We identified which features contribute to the fi-
nal predicted price and how much they influence the
model’s output.
The LightGBM model was chosen for this analy-
sis, as it achieved the best performance. The test set
(unseen during training) assessed the model’s ability
to generalize to new data. The SHAP summary plot in
Figure 4 presents the explainability results. The fea-
ture weight stands out as the most influential variable
in the model (cf. the top of the figure). The impact of
weight on price is substantial, with higher values gen-
erally increasing the predicted price. Heavier prod-
ucts tend to be more expensive due to higher manu-
facturing, shipping, and material costs.
The soldQuantity feature, representing the num-
ber of units sold, also plays a key role. Products with
higher sales volume are associated with higher prices,
likely reflecting their popularity and market demand.
This relationship suggests that the model captures de-
mand as a key factor in pricing. Similarly, the ini-
tialQuantity, the initial stock level of a product, di-
rectly affects the predicted price.
The presence of specific categories, such as VE-
HICLE AMPLIFIERS, indicates that the model can
capture nuanced market segments and their corre-
sponding price ranges, suggesting a degree of granu-
larity in how the model incorporates categorical prod-
uct information.
5 DISCUSSION
Figure 5 presents a comparative analysis of the R
2
scores across the evaluated regression models, high-
lighting the impact of hyperparameter tuning. The
top-performing models in terms of R
2
(cf. top of
the Figure 5) were LightGBM, XGBoost, and Ran-
dom Forest. In contrast, neural network-based models
such as LSTM and Feed Forward exhibited R
2
values
below 0.7, although still comparable to the top-tier
models. Linear models—including Linear Regres-
sion, Ridge, Lasso, and SVM—yielded the lowest R
2
scores.
Tree-based models, particularly LightGBM and
XGBoost, benefited from hyperparameter optimiza-
tion, achieving improvements in R
2
and demonstrat-
ing enhanced explanatory power regarding the vari-
ance in the dataset. The tuned LightGBM model
achieved the best overall effectiveness, with an in-
crease of nearly 18% in R
2
compared to its base ver-
KDIR 2025 - 17th International Conference on Knowledge Discovery and Information Retrieval
154
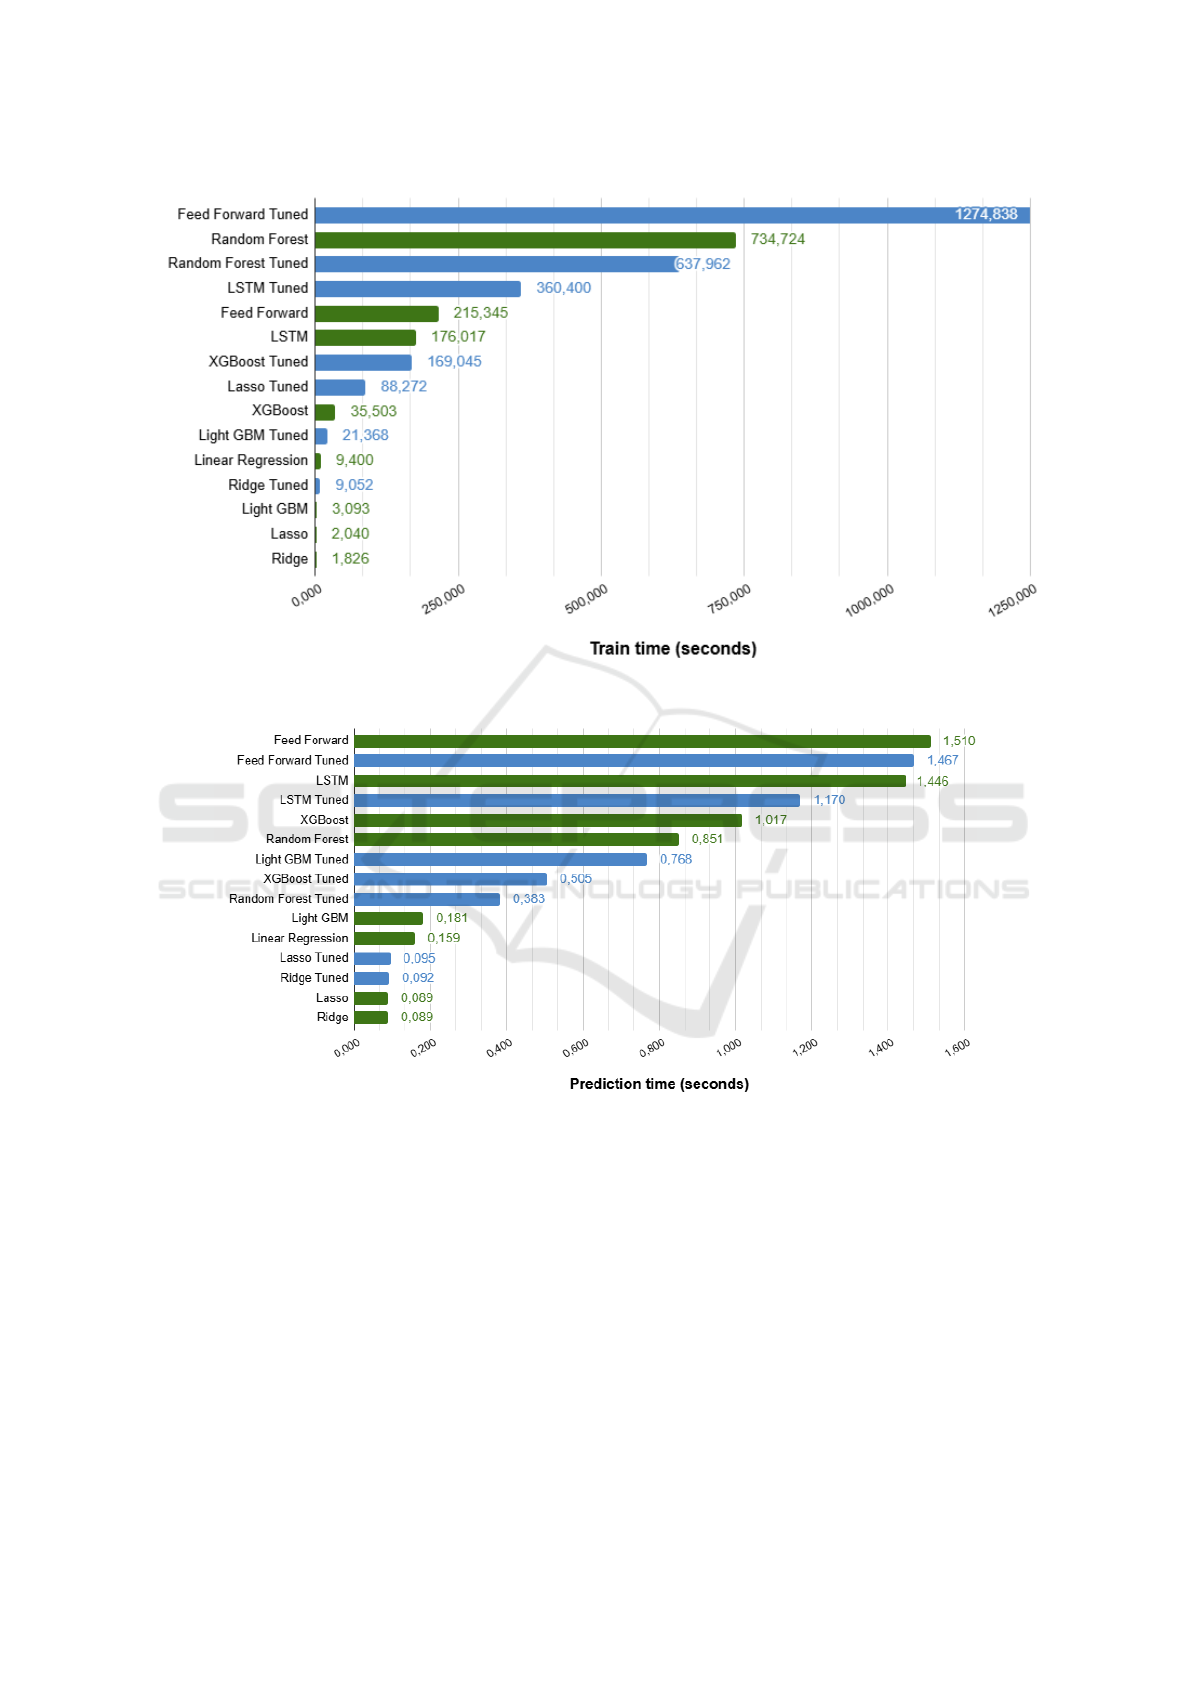
(a) Training times of base and tuned regression models for product pricing. Values are shown in seconds.
(b) Prediction times of base and tuned regression models for pricing 10,000 products. Values are shown in seconds.
Figure 3: Training and prediction times for regression models evaluated in the product pricing task.
sion. This result underscores its robustness in the
pricing task. Similarly, the tuned XGBoost model
presented a notable increase of approximately 12% in
R
2
, confirming its effectiveness when fine-tuned ap-
propriately.
We analyzed the trade-off between predictive ef-
fectiveness (measured by R
2
– Figure 5) and com-
putational efficiency (in terms of training and time –
Figure 3a). Linear models such as Linear Regression
and Ridge showed negligible or marginal improve-
ments in R
2
after hyperparameter tuning (+0.00% and
+5.70%, respectively). Nevertheless, these models
were the fastest in both training and prediction phases.
While this low computational cost could be advanta-
geous for applications requiring rapid responses, their
limited predictive accuracy renders them inadequate
for effective pricing tasks. Tree-based models, in
contrast, achieved higher R
2
scores at the cost of in-
creased computational time.
The tuned LightGBM model was the best-
performing option because it combined the highest R
2
score with fast prediction time (0.181 seconds) and
Suggesting Product Prices in Automotive E-Commerce: A Study Assessing Regression Models and Explicability
155
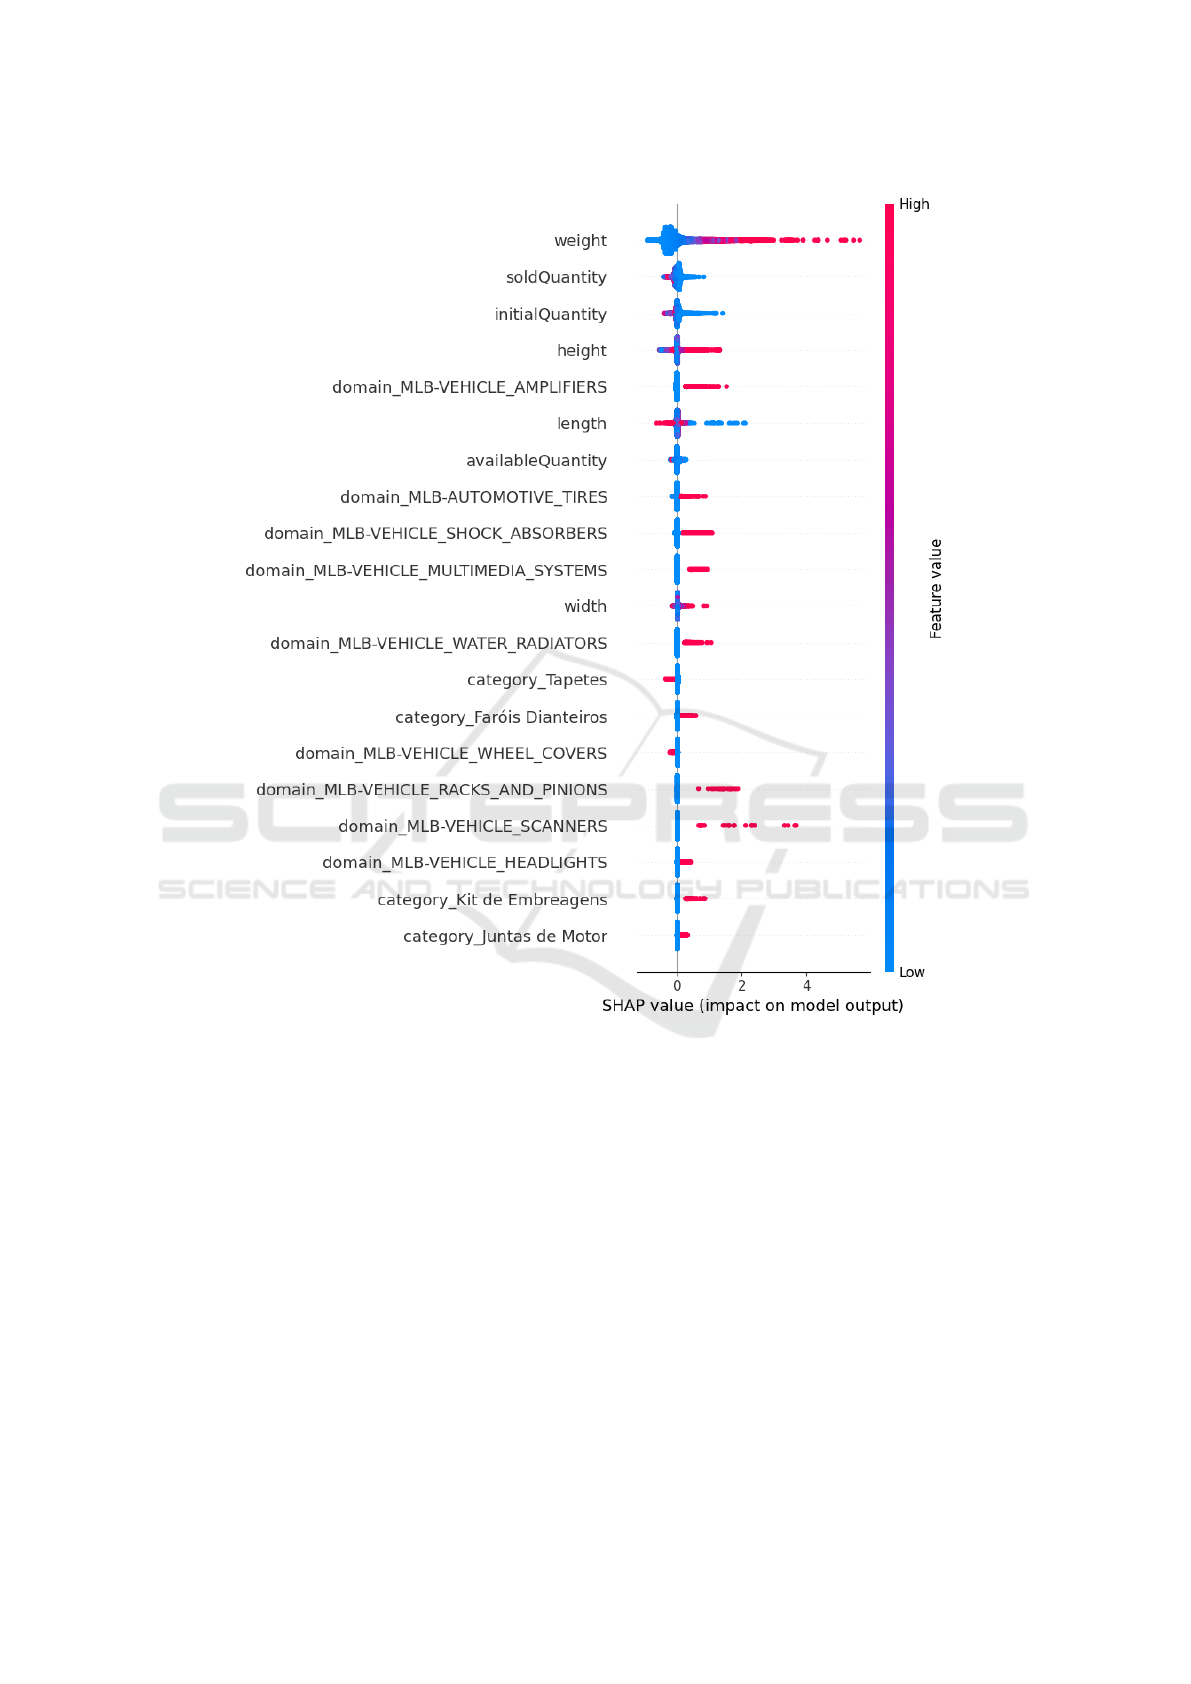
Figure 4: SHAP Summary Plot illustrating the explainability of the LightGBM regression model on the test set. Each row in
the plot corresponds to a model feature, ordered from the most influential (at the top) to the least influential (at the bottom).
The SHAP values (horizontal axis) indicate the impact of each feature on the model’s prediction: positive values increase the
prediction, while negative values decrease it. The spread of the points along the horizontal axis reflects the variation in the
impact of each feature across different predictions.
relatively low training time (21.4 seconds), making it
particularly well-suited for the pricing domain. Simi-
larly, the tuned XGBoost model showed strong effec-
tiveness improvements with acceptable training and
prediction times. Although Random Forest yielded
competitive accuracy, its excessively long training
time (637 seconds) makes it less practical for frequent
retraining scenarios.
Lasso and SVM improved slightly with hyper-
parameter tuning among the underperforming base
models. Their overall R
2
outcome remained uncom-
petitive. Furthermore, SVM incurred higher train-
ing and inference times, reducing its practical utility.
Neural network-based models (LSTM and Feed For-
ward) exhibited high computational costs for training
and prediction, despite achieving moderate R
2
values.
Although their effectiveness improved after tuning,
the associated resource requirements limit their ap-
plicability in pricing systems where rapid retraining
is necessary. In summary, the tuned LightGBM and
XGBoost models were revealed as the most viable
choices for this pricing task, offering an optimal bal-
ance between accuracy and computational efficiency.
In terms of explainability, the results indicate that
KDIR 2025 - 17th International Conference on Knowledge Discovery and Information Retrieval
156
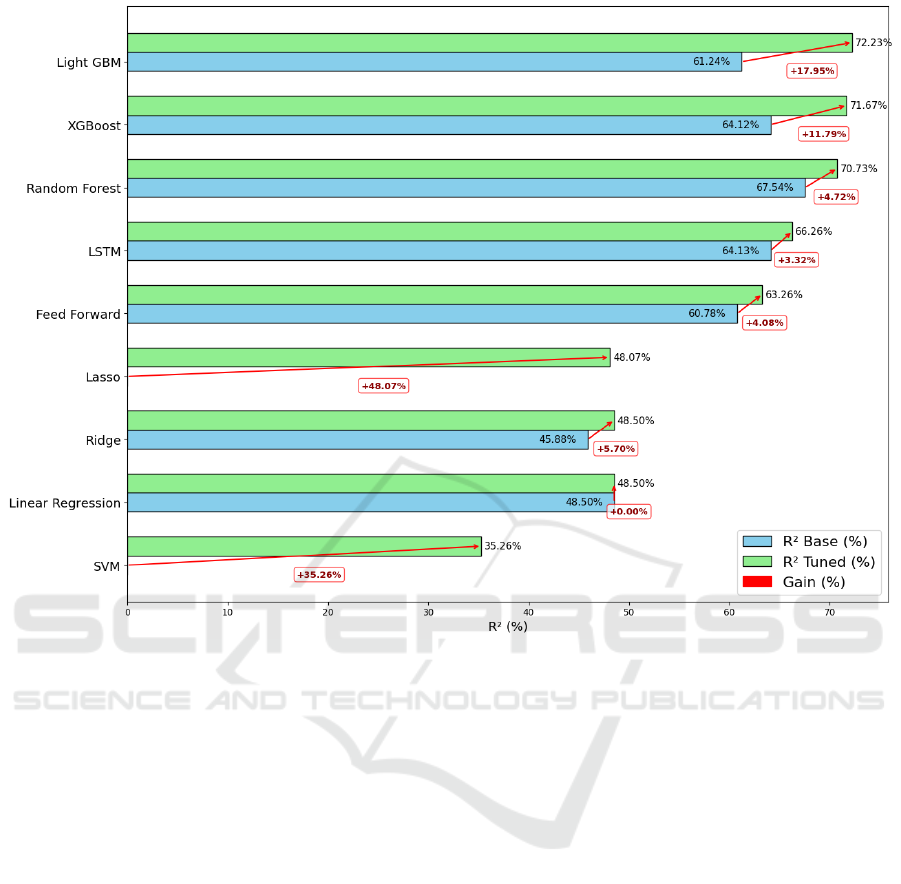
Figure 5: Comparison of R
2
scores for base and tuned regression models. The x-axis represents the R
2
, while the y-axis lists
the regression models. Red bars indicate the percentage increase in R
2
for the tuned models relative to their base versions.
higher initial availability is associated with higher
prices. This could reflect a pricing strategy based on
inventory management and the availability of automo-
tive products. Physical product characteristics such as
height and length significantly influence the model’s
predictions. In an e-commerce context, these vari-
ables may relate to the product’s size, which affects
production and transportation costs. Larger products
typically require more materials and resources, result-
ing in higher prices.
In summary, the results show that tree-based mod-
els, especially LightGBM and XGBoost, are suitable
for production use in our automobile e-commerce
pricing context, combining high predictive accuracy
with low latency. Their explainability highlights key
pricing drivers that automotive e-commerce sellers
should monitor to make informed, data-driven deci-
sions.
Future work may explore the following directions:
(a) System Integration: Embedding the model into
GoBots’ systems to support automated, explainable
price recommendations for e-commerce vendors; (b)
Advanced Categorical Encoding: Using embed-
ding techniques to replace one-hot encoding, cap-
turing semantic relationships between categories and
enhancing multilingual applications; (c) Temporal
Price Analysis: Incorporating time series models
(e.g., SARIMA, Prophet) to detect seasonal trends
and price fluctuations over time; (d) Scalable Data
Processing: Utilizing high-performance or cloud-
based infrastructure to process the complete dataset
and evaluate model scalability; (e) Cross-Domain
Application: Adapting the model to other pricing do-
mains, such as real estate, involving various data char-
acteristics and influencing factors.
6 CONCLUSION
The accurate pricing in online commerce plays a
strategic role for businesses. This study explored and
compared the effectiveness of several regression mod-
els applied to product pricing in the Brazilian au-
tomotive e-commerce sector. Our study evaluated
how various ML techniques contribute to this task,
balancing prediction accuracy with computational ef-
Suggesting Product Prices in Automotive E-Commerce: A Study Assessing Regression Models and Explicability
157

ficiency. Analysing a dataset comprising 100, 000
product records, we handled missing values, gener-
ated derived variables from temporal features, en-
coded categorical attributes, and standardized numer-
ical features. Our experimental results highlighted
the value of base and optimized models in the pric-
ing task. The comparative evaluation of nine re-
gression algorithms, including hyperparameter tun-
ing, revealed that tree-based ensemble methods such
as LightGBM and XGBoost offer a substantial trade-
off between predictive accuracy and training/predic-
tion time. The RMSE, MSE, and R
2
metrics were
used to quantify effectiveness, while runtime met-
rics supported the analysis of each model’s practical
feasibility in real-world scenarios. This study con-
tributed with methodological and original practical
assessment by systematically comparing regression
models in Brazilian automotive e-commerce. Our in-
vestigation contributed to the application of SHAP
to interpret model outputs. This analysis provided
insights into the most influential features for price
prediction, such as product weight, inventory levels,
and units sold. This investigation established a foun-
dation for future studies and is a reference for new
researchers and practitioners seeking to implement
data-driven pricing strategies.
ACKNOWLEDGMENTS
This work was supported by the S
˜
ao Paulo Re-
search Foundation (FAPESP) and the Coordenac¸
˜
ao de
Aperfeic¸oamento de Pessoal de N
´
ıvel Superior, Brazil
(CAPES). Prof. Dr. Julio Cesar Dos Reis thanks the
National Council of Technological and Scientific De-
velopment (CNPq), Brazil, grant #301337/2025-0.
REFERENCES
Akash, C. R., Vivekanandhan, P. K., Adam Khan, M.,
Ebenezer, G., Vinoth, K., Prithivirajan, J., and Kis-
han, V. J. P. (2024). Assessment of ridge regression-
based machine learning model for the prediction of
automotive sales based on the customer requirements.
Interactions, 245(1):289.
Aparicio, D. and Misra, K. (2023). Artificial intelligence
and pricing. Artificial intelligence in marketing, pages
103–124.
Bhaskar, T., Shiney, S. A., Rani, S. B., Maheswari, K., Ray,
S., and Mohanavel, V. (2022). Usage of ensemble re-
gression technique for product price prediction. In
2022 4th International Conference on Inventive Re-
search in Computing Applications (ICIRCA), pages
1439–1445. IEEE.
Chowdhury, M. S., Shak, M. S., Devi, S., Miah, M. R.,
Al Mamun, A., Ahmed, E., Hera, S. A. S., Mahmud,
F., and Mozumder, M. S. A. (2024). Optimizing e-
commerce pricing strategies: A comparative analysis
of machine learning models for predicting customer
satisfaction. The American Journal of Engineering
and Technology, 6(09):6–17.
Das, P., Pervin, T., Bhattacharjee, B., Karim, M. R., Sul-
tana, N., Khan, M. S., Hosien, M. A., and Kamruzza-
man, F. (2024). Optimizing real-time dynamic pric-
ing strategies in retail and e-commerce using machine
learning models. The American Journal of Engineer-
ing and Technology, 6(12):163–177.
El Youbi, R., Messaoudi, F., and Loukili, M. (2023). Ma-
chine learning-driven dynamic pricing strategies in e-
commerce. In 2023 14th International Conference
on Information and Communication Systems (ICICS),
pages 1–5. IEEE.
Kotler, P. and Keller, K. L. (2022). Marketing Management
16e. Pearson India.
Lundberg, S. M. and Lee, S.-I. (2017). A unified approach
to interpreting model predictions. Advances in neural
information processing systems, 30.
Mutemi, A. and Bacao, F. (2024). E-commerce fraud detec-
tion based on machine learning techniques: System-
atic literature review. Big Data Mining and Analytics,
7(2):419–444.
Patel, R. (2023). Customer acquisition and retention
in e-commerce using ai & machine learning tech-
niques. Journal of Harbin Engineering University,
44(8):879–886.
Xuming, Y. (2024). Research on the pricing wrong of elec-
tronic commerce contract. International Journal of
Frontiers in Sociology, 6(8).
KDIR 2025 - 17th International Conference on Knowledge Discovery and Information Retrieval
158
