
The Research on the Factors Influencing Housing Prices
Qianyu Shao
a
Ulink High School of Suzhou Industrial Park, Kunshan, 215300, China
Keywords: Housing Prices, Multiple Linear Regression, Random Forest.
Abstract: This article aims to identify the extent to which certain factors influence housing prices. The author compares
the accuracy and effectiveness of two methods Multiple Linear Regression and Random Forest in analyzing
the significant factors with 1500 samples of the USA in 2014. Based on the multiple linear regression model,
stepwise regression was used to remove the insignificant factor sqft-lot and analyze it to ensure the robustness
of the model. Cross-validation is used to modify the random forest model’s parameters to ultimately produce
the optimal model. The two models present different results. The 7 factors have different impacts on housing
prices in different models. Random Forest is finally shown to be more accurate, the total impact of these seven
factors on housing prices is relatively large. Bathrooms, sqft-lot and city have the biggest effects on home
cost in the more precise random forest method. This study shows that in the future, more timely data can be
selected and control variables can be used to further optimize. This study provides important reference and
guidance for people to predict housing prices.
1 INTRODUCTION
In recent years, real estate price fluctuations have
become one of the core issues in global development.
As time passes, the cost of housing rises annually.
For instance, the average price of a home in China
increased from 1,857 yuan/m2 to 10,375 yuan/m2
between 1999 and 2022, with an average annual
growth rate of 19.94% and a total growth rate of
458.70%. Housing prices have a huge effect on
people’s quality of life, which divides people into
locations with varying advantages. Lower-income
populations are being forced out of core
neighborhoods and into places with less access to
amenities as prices in the city center rise, according
to recent patterns that indicate poverty is becoming
even more sub-urbanized (Hochstenbach and
Musterd, 2018). However, people do not intuitively
understand the factors that affect housing prices, but
housing prices have a great impact on people's lives.
Although a thorough and multifaceted analysis of the
factors influencing home prices has been done in the
literature, more research is still needed. This article
aims to analyze in detail the specific proportion of
different factors affecting housing prices to help
people improve housing quality.
a
https://orcid.org/0009-0007-5090-7558
Housing prices are influenced by a multitude of
factors, and fluctuations in housing prices are a
significant concern. Zhang also used statistics on
house prices in Wuhan, and their analysis combined
Hypothesis Testing and the Stepwise regression
method. The impact of the Permanent population
urbanization rate, Gross Domestic Product, real estate
development investment, fiscal revenue, and tertiary
industry GDP has been examined. This study took
into account that the population density statistic was
too small and further conducted regression analysis to
improve the accuracy of the linear relationship
(Zhang, 2022). Hamzah et al. found that the primary
factors influencing property prices are supply and
demand by analyzing the total of eight factors that
influence the price of double-story terrace houses in
Bandar Baru Bangi (Hamzah et al., 2012). Zhang
identified the external elements influencing housing
prices with precise data accuracy by utilizing a panel
data model to study the factors affecting housing
prices in seven Chinese megacities (Zhang, 2022).
Aydinoglu and Sisman applied global regression
models including Ordinary Least Squares (OLS),
Spatial Lag Model (SLM), and Spatial Error Model
(SEM) to examine their regional variations
(Aydinoglu and Sisman, 2012). They emphasized that
552
Shao, Q.
The Research on the Factors Influencing Housing Prices.
DOI: 10.5220/0013829300004708
Paper published under CC license (CC BY-NC-ND 4.0)
In Proceedings of the 2nd International Conference on Innovations in Applied Mathematics, Physics, and Astronomy (IAMPA 2025), pages 552-556
ISBN: 978-989-758-774-0
Proceedings Copyright © 2025 by SCITEPRESS – Science and Technology Publications, Lda.

combining local geographic analysis with overall
analysis would make the results more accurate.
Regarding the primary macro factors, Pan indicated
that changes in housing prices in the world's main
nations share certain basic traits, from four aspects of
demand, supply, regulatory policy factors and micro-
consumer factors (Pan, 2021).
However, the current study's analytical
framework exhibits notable limitations in accounting
for geospatial variations, resulting in potentially
biased conclusions. In contrast, Adetunji et al.
systematically demonstrated that while the House
Price Index (HPI) serves as a robust indicator for
regional housing value volatility, it demonstrates
limited applicability in individual property valuation.
Their implementation of Random Forest machine
learning algorithms for price prediction revealed
superior predictive accuracy with reduced error
margins compared to conventional HPI-based
methodologies through rigorous comparative analysis
(Adetunji et al., 2022). Based on geographic data, Liu
et al. used statistics on housing prices in Changsha,
and improved methods of the traditional regression
model to create a geographically weighted model
(GWR) (Liu et al., 2021). The impact of four
parameters(endogenous factors, business location,
transit location and dwelling location). Domestic
scholars have also found that GDP per person and
Demographic shock all affect on housing price (Xu,
2022; Tang, 2016). This paper focuses on these
variables (Bedroom, Bathrooms, Sqft-lot, Floors,
City, Sqft-basement, and Condition) that were
analyzed to establish their impact on housing prices,
and then choose an appropriate model to study the
association between these factors and house prices.
In summary, this article will study the 10 factors
of house prices based on multiple linear regression
model and random forest. This can assist people in
choosing their preferred living area, predicting house
prices, and ensuring their quality of life. This study
will use this model to analyze the impact of these
eight factors and deal with outliers to reduce errors
and ensure the accuracy of the research.
2 METHODS
2.1 Data Source
The datasets were owned by Fırat Özcan and the
usability rate of the datasets is 9.41. The datasets
contain 4138 groups of data and 18 variables from
May to July 2014. The original dataset was in the
.CVS format.
2.2 Variable Selection
The original dataset is a small to medium-sized
dataset and contains many null variables such as
waterfront and view, and the variables of country a
constant (USA). Since the statezip variable has
nothing to do with changes in housing prices, it can
be removed as irrelevant data. At the same time, the
2 variables of year renovated, and street will make the
data form very complicated, so this literature close to
remove these data. Finally, random sampling was
performed to obtain 1500 observations. The data
contains 7 variables (Bedrooms, Bathrooms, Sqft lot,
Floors, City, Sqft-basement and Condition) and one
dependent variable (House price). All 7 variables are
represented in the Table 1:
Table 1: List of Variables.
Variable Meaning
Bedroom The bedroom’s number (0-8)
Bathroom The bathroom’s number (0-6.75)
Sqft-lot The size of lot in square feet (638-1.07m)
Floors The number of floors (1-3.5)
City Location of the house (Seattle: 34%
Renton: 6% Other: 60%)
Sqft-basement The square footage of the basement (0-
4820
)
Condition An indicator that rates the property’s
condition on a scale of 1 to 5 (1-5)
2.3 Method Introduction
In this paper, two classification models are chosen,
which are the multiple linear regression model
(MLR), and random forest model (RF) (Guo et al.,
2022). Comparing the relevance of the two models
and the precision of the findings will be the primary
goals of this section. Finally, it aims to determine the
most suitable model to analyze the relationship
between housing prices and these factors.
The multiple linear regression model is a
parametric model that fits the linear relationship
between multiple independent variables and
continuous dependent variables through the least
squares method. The Random forest integrates
multiple decision trees based on Bootstrap sampling
and feature random selection, outputs prediction
results by voting or averaging, and reduces the risk of
overfitting. The basic formula of the multiple linear
regression model is:
𝑦=𝛽
+𝛽
𝑥
+𝛽
𝑥
+⋯+𝛽
𝑥
+𝜀 (1)
The Research on the Factors Influencing Housing Prices
553
In the above formula: 𝛽
is a constant term, and 𝜀 is a
residual term.
3 RESULTS AND DISCUSSION
3.1 Multiple Linear Regression
Analysis shows that these 7 variables are all related
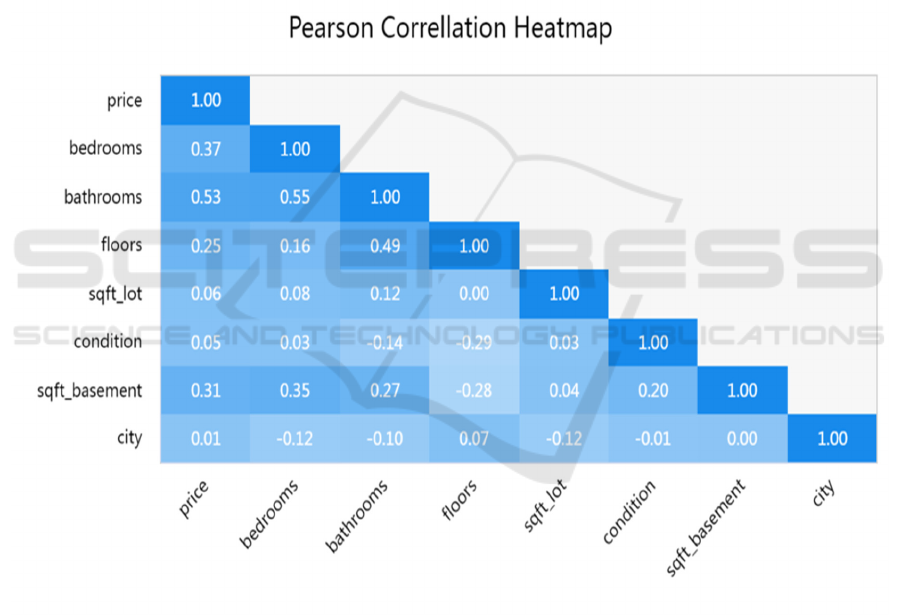
to housing prices. As the graph in Figure 1 shows.
From Figure 1, it shows the relationship between
these factors and housing prices. The data analysis
indicated that the price is significantly influenced by
the following factors: bedrooms, bathrooms, floor,
condition, Sqft-basement, and city. The research data
found that the biggest factor positively influencing
home prices is the quantity of bedrooms and
bathrooms. This indicated that individuals are
becoming more aware of the room types. The data in
the chart clearly shows that the sqft-lot impact on
housing prices is very small compared to other
variables. It is found that people have different
requirements for housing and their needs have
gradually changed from just being able to afford a
house to improving the quality of life.
Figure 1: Relevance Analysis of Dependent and Independent Variables (Picture credit: Original)
Table 2 shows the regression of the multiple linear
regression equation model. The p-values of the T-test
for the variable sqft-lot is greater than 0.05.
Therefore, it indicates that the sqft-lot is not
significant and will not affect housing prices. The
other six variables, on the other hand, all have p-
values below 0.05, suggesting that they significantly
affect house prices.
And about the Variance inflation factor (VIF) values
in this analysis, all of the values are low, ranging from
1.031 to 2.183, well below the accepted threshold of
10. These numbers show that the seven variables are
not collinear, meaning they do not affect one another.
Additionally, the Tolerance values range from 0.458
to 0.97, demonstrating that every predictor variable in
the model offers distinct information that is not
duplicated by other variables. As a result, regression
IAMPA 2025 - The International Conference on Innovations in Applied Mathematics, Physics, and Astronomy
554
models including these variables are expected to have
stable and trustworthy coefficients, enhancing the
accuracy of this research.
Table 2: Linear regression analysis results.
B S.E. Beta t p VIF Tolerance
Constants -304963.467 56873.717 - -5.362 0.000** - -
bedrooms 24607.386 10028.333 0.065 2.454 0.014* 1.562 0.64
bathrooms 176101.81 13668.024 0.401 12.884 0.000** 2.183 0.458
sqft_lot 0.045 0.175 0.005 0.254 0.799 1.031 0.97
floors 84174.332 18126.773 0.132 4.644 0.000** 1.816 0.551
condition 50227.899 11151.592 0.1 4.504 0.000** 1.121 0.892
sqft_basement 146.287 19.044 0.199 7.681 0.000** 1.517 0.659
city 1786.762 689.751 0.056 2.59 0.010** 1.061 0.943
Note: * p<0.05 ** p<0.01
3.2 Multiple Linear Regression with
Backward Elimination
From the above analysis, it can see that sqft-lot has
almost no impact on housing prices. For this variable,
this study uses the backward elimination method in
stepwise regression to remove this variable to make
data analysis more effective. It can be seen that all P
values are within the accepted range. This indicates
that all six variables are explicit.
Table 3: Results of Backward Elimination Regression
Note: * p<0.05 ** p<0.01
According to table 3, all variables have high
significance, although they haven't altered much from
their prior values. These data show the 6 variables
have a significant positive effect on house price.
Therefore, it will derive a model: price =
304678.104 + 24628.129 ∗ bedrooms + ⋯ +
1769.550 ∗ city.
3.3 Random Forest Results
This paper will also use the random forest model to
analyze the impact of these 7 factors on housing
prices, and then compare it with the multiple linear
regression model to find the most suitable model for
the impact of housing prices. The total amount of data
analyzed this time is 1500, and random forest selects
80% of them for analysis. The optimal parameters
obtained were 100 for “ntree” and 2 for “mtry” The
final fitting using the best parameters yields an
optimal random forest model. Eventually, Figure 2
displays the result of the random forest.
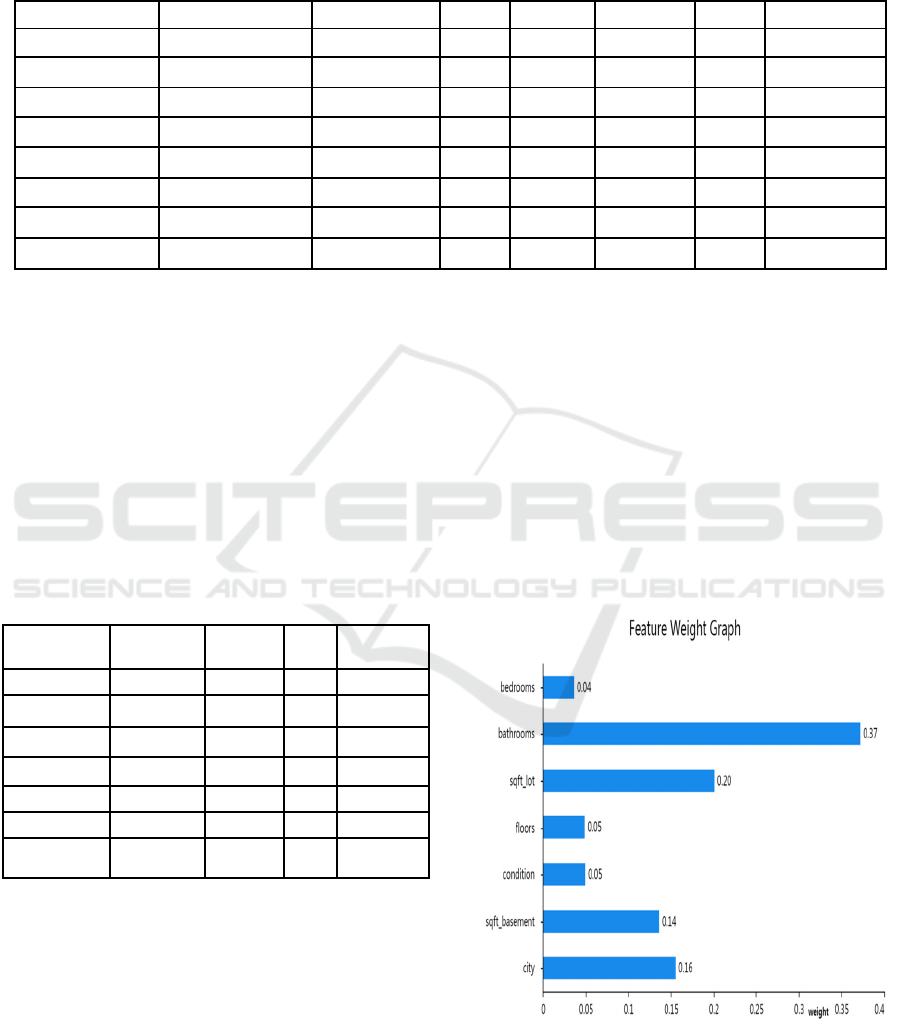
Figure 2: Feature Weight of RM Model (Picture credit:
Original)
Variables B S.E. T P
Constant -304678.104 56844.847 -5.360 0.000**
bedrooms 24628.129 10024.860 2.457 0.014*
bathrooms 176448.015 13595.883 12.978 0.000**
floors 83960.099 18101.539 4.638 0.000**
condition 50336.577 11139.920 4.519 0.000**
s
q
ft
_
basement 146.163 19.032 7.680 0.000**
city 1769.550 686.211 2.579 0.010*
The Research on the Factors Influencing Housing Prices
555

From Figure 2 it can be seen bathrooms, sqft-lot, and
city these 3 influencing factors account for 72.87% of
the total. Therefore, the other four factors have little
impact on housing prices. This reflects that these 3
factors have a great impact on housing prices, while
the other four variables (bedrooms, floors, condition,
sqft-basement) have almost no impact on house
prices.
Table 4 shows the accuracy of the model is
obtained as after prediction on the test set, and the R-
squared for fitting the random forest model is 0.497
when testing, 0.921 when training.
Table 4: Results of Random Forest.
4 CONCLUSION
Overall, this study selected 1500 samples from all of
4120 from the data set, which has 7 variables. By
comparing the performance of the two models,
Multiple Linear Regression and Random Forest, on
the impact of house prices. Based on the multiple
linear regression, it was concluded that sqft-lot was
an insignificant factor. Therefore, a stepwise
regression model was further used to remove
inaccurate variables, and finally, effective and
accurate results were obtained. Another model
random forest analysis and obtained the Feature
Weight Graph to intuitively understand the
proportion of each variable affecting housing prices.
Comparing the R-squared values of the two methods,
the random forest has a larger value. Therefore, the
total impact of the seven factors calculated by the
random forest on housing prices is greater. As a
result, a variety of factors influence how well various
models function. In various investigations, the author
should choose the most correct model to examine
after identifying the key characteristics of the data.
With this research, people can have more
references when choosing their ideal house and have
an approximate idea of how much houses will cost.
However, most of the data in this study are from 2014,
which has certain time limitations and a small sample
size. Using control variables and locating more recent
data might enhance this analysis.
REFERENCES
Adetunji, A. B., Akande, O. N., Ajala, F. A., 2022. House
price prediction using random forest machine learning
technique. Procedia Computer Science, 199, 806-813.
Aydinoglu, A. C., Sisman, S., 2012. A modelling approach
with geographically weighted regression methods for
determining geographic variation and influencing
factors in housing price: A case in Istanbul. Land use
policy, 119, 106183.
Guo, H. P., Qian, Y. H., Zhu, Y., 2022. Statistical inference
method of factors affecting housing prices. Statistics
and Management, 37(05), 58-63.
Hamzah, N., Khoiry, M. A., Tawil, N. M., 2012. Critical
factors affecting double storey terrace houses prices in
Bandar Baru Bangi. Procedia-Social and Behavioral
Sciences, 60, 562-566.
Hochstenbach, C., Musterd, S., 2018. Gentrification and the
suburbanization of poverty: changing urban
geographies through boom and bust periods. Urban
Geog, 39, 26-53.
Liu, Y. P., Tang H. T., Wu, Z. C., 2021. Spatial
heterogeneity analysis of factors affecting housing
prices based on POI data: A case study of Changsha.
Urban Issues, 2, 95-103.
Pan, T., 2021. A review of research on factors affecting
housing prices. Guangxi Quality Supervision Herald, 2,
5-7.
Tang, W. B., 2016. An empirical analysis of the factors
affecting real estate prices in my country. Price Theory
and Practice, 1, 119-121.
Xu, H., 2022. Analysis of factors affecting housing prices
in Jiangsu Province. Market Weekly, 35(04), 46-50.
Zhang, Y., 2022. Analysis of factors affecting housing
prices in my country's megacities. University of
International Business and Economics.
Training Accuracy Test Accurac
y
R2 0.921 0.497
IAMPA 2025 - The International Conference on Innovations in Applied Mathematics, Physics, and Astronomy
556
