
The Effect of Sunspot Activity on Earth's Extreme Climate
Shiyao Xu
a
Wuxi Furen Middle School, Wuxi, China
Keywords: Sunspots, ENSO, La Nina, Extreme Climate, ONI.
Abstract: The eastern equatorial Pacific Ocean experiences an oscillation of winds and sea surface temperatures known
as the El Nino-Southern Oscillation (ENSO), which is the most significant signal of inter-annual change in
the global climate system. This low-latitude air-sea interaction, manifested in the Southern Oscillation in the
atmosphere and the El Nino-La Nina transition in the ocean, has a profound impact on global weather patterns.
As an important indicator of solar activity, sunspot activity is closely related to the Earth's climate system and
may modulate ENSO events through various ways. The mechanism of sunspot activity affecting ENSO is
discussed in this paper. First, the effects of sunspots on the sun, Earth's climate and ENSO are analyzed. In
addition, the correlation between the number of sunspots and ONI was also analyzed, further revealing the
existence and correlation of this effect. The results are helpful to further understand the formation and
development mechanism of ENSO, and provide a new theoretical basis for improving the accuracy of ENSO
event prediction.
1 INTRODUCTION
At a distance of about 150 million kilometers, the Sun
is the closest star to Earth. The Sun continuously
emits 3.8× 10²⁶ joules/second of energy through
hydrogen fusion in its core, of which about 1.7×10¹
⁷ joules/second reaches the Earth, constituting
99.98% of the total energy received at the surface.
Solar activity can be divided into quiet periods and
active periods, which mainly include sunspots, flares,
solar prominences and coronal mass ejections. In the
eastern equatorial Pacific Ocean, there is a wind field
and sea surface temperature oscillation known as
ENSO (El Nino Southern Oscillation). The Southern
Oscillation in the sky and the ENSO transition in the
ocean serve as indicators of the low-latitude air-sea
interaction known as ENSO. Its formation and
development are the result of the interaction of many
factors, including the interaction between the ocean
and the atmosphere, the change of trade wind
direction, the change of sea surface temperature, the
difference of atmospheric pressure, Walker
circulation, Earth rotation and global climate change.
Many studies have shown that the Earth's extreme
climate is closely related to solar activity. In view of
this, this paper aims to explore the correlation
a
https://orcid.org/0009-0007-9989-6984
between sunspot activity and ENSO. The aim is to
deepen our understanding of the formation
mechanism of these extreme climates and provide
scientific basis for understanding and predicting
ENSO events.
1.1 Composition and Structure of the
Sun
The Sun is composed mainly of hydrogen and helium,
and these two elements make up the majority of the
Sun's total mass. Among other elements, it also
contains carbon, oxygen, neon, and iron. Although
there is no obvious barrier between the internal
material, which is primarily plasma, its density drops
exponentially with increasing altitude above the
photosphere. For ease, the solar radius is frequently
calculated using the distance between the sun's visible
surface and core (Den, 2023). Nuclear fusion occurs
all the time in the sun, and energy is diffused from the
inside to the outside. In this process, high-energy
particles such as gamma rays and neutrinos generated
by nuclear fusion will gradually decay into photons
of lower energy such as ultraviolet, visible light and
infrared light.
546
Xu, S.
The Effect of Sunspot Activity on Earth’s Extreme Climate.
DOI: 10.5220/0013829200004708
Paper published under CC license (CC BY-NC-ND 4.0)
In Proceedings of the 2nd International Conference on Innovations in Applied Mathematics, Physics, and Astronomy (IAMPA 2025), pages 546-551
ISBN: 978-989-758-774-0
Proceedings Copyright © 2025 by SCITEPRESS – Science and Technology Publications, Lda.

The current research believes that the solar
structure is mainly divided into five layers, namely
core, radiation zone, convection zone, photosphere
and corona. Common solar activities mainly include
sunspots, flares, solar prominences, coronal mass
ejections, etc. These activities will have a certain
impact on space communications, power systems,
satellite operations, climate and so on.
1.2 Sunspot
Sunspots are a feature on the surface of the Sun,
proposed by Rudolf Wolf, usually located in the
photosphere and are the result of the upward push of
the intense magnetic flux inside the sun. Along this
flux, heat is heated in the upper photosphere and
chromosphere regions, usually in the form of light
spots and blotches--often referred to as active regions
(NOAA, 2025). These active areas are typically
where solar eruptions like solar flares and coronal
mass ejections occur. To ascertain and forecast the
solar cycle's advancement and, eventually, solar
activity, several organizations, like NASA and
NOAA, monitor sunspots (NASA, 2025).
The solar cycle is about 11 years, and the total
number of sunspots varies throughout the cycle.
According to the different number of sunspots can be
divided into solar minimum and solar maximum. The
former is characterized by a low number of sunspots,
while the latter is characterized by a high number of
sunspots. Sunspots can be used as a solar activity
indicator and as a possible source of violent solar
activity, including coronal mass ejections and flares.
Furthermore, the temperature of Earth may be
impacted by solar activity in the long run.
1.3 ENSO Phenomenon
ENSO is a wind field and sea surface temperature
oscillation that occurs in the eastern equatorial Pacific
Ocean. ENSO is a low-latitude sea-air interaction
phenomena that is indicated by the Southern
Oscillation in the atmosphere and the El Nino-La
Nina transition in the ocean (
Kessler, 2002). In the
Pacific Ocean close to the equator, the east has a low
temperature and the west a high one. The air in the
western Pacific Ocean is warm and humid, prevailing
updraft, becoming an area with extremely vigorous
convective activity, and also the most abundant
precipitation in the Pacific Ocean, while the eastern
Pacific Ocean is cold water, cold water makes the air
above it cool and dense, prevailing downdraft on the
ocean surface, more sunny and less cloudy weather.
This zonal circulation that flows east-west over the
low-latitude Pacific Ocean is called the Walker
circulation.
El Nino and La Nina are the two opposite phases
of ENSO, which exhibit different characteristics in
terms of the ocean and atmosphere. During El Nino,
the eastward expansion of warm surface water causes
the convection zone in the western tropical Pacific to
drift eastward. This resulted in increased rainfall,
decreased surface pressure and weakened trade winds
in the eastern Tropical Pacific, while west of the date
line, decreased rainfall and increased surface
pressure. At the same time, this phenomenon will also
cause and increase the global temperature abnormally
(
Philander, 1989). However, La Nina happens when
the equatorial Pacific's exceptionally powerful trade
winds push more warm water westward. It led to
exceptionally low SST in the equatorial Middle
Eastern Pacific Ocean, lower SST in the east, and
higher SST in the west. El Nino has the opposite
impact. This phenomenon will have a serious impact,
which may lead to a significant reduction in
agricultural production, and dry conditions also face
increased fire, which affects agricultural forest
planting and water supply reduction (
ESCAP and
Warning,2016
).
ENSO is a significant natural climate event that,
when combined, form a complex climate system that
alternately manifests and exhibits periodic
oscillations with a duration of roughly three to seven
years. The primary driving force behind the
complicated processes of ENSO creation is the
interplay between the ocean and atmosphere.
Southeast trade winds are often blown from east to
west from the equatorial Middle Eastern Pacific. The
western Pacific experiences warmer seas as a result
of these winds pushing warm water toward it, while
the eastern Pacific has cooler waters. When an El
Nino occurs, the winds weaken or even reverse,
which causes warm water to migrate from the western
to the eastern Pacific. Second, shifts in the ocean's
circulation are also significant determinants. Walker
circulation keeps the western Pacific Ocean's warm,
humid air ascending and the eastern Pacific Ocean's
cool water upwelling. Walker circulation deteriorates
during an El Nino, which reduces cold water
upwelling in the Eastern Pacific Ocean and
exacerbates the rise in SST.
The Effect of Sunspot Activity on Earth’s Extreme Climate
547

2 ANALYSIS OF THE
RELATIONSHIP BETWEEN
SUNSPOT ACTIVITY AND
ENSO
2.1 Influence of Sunspot Activity on the
Sun
One of the most significant indicators of solar activity
are sunspots, which are frequently associated with
violent phenomena like solar flares and coronal mass
ejections, which release massive amounts of
electromagnetic radiation and high-energy particles
into space, creating the solar wind. If sunspot activity
is high, solar radiation is increased, and if it is low,
solar radiation is diminished.
The formation of sunspots has a lot to do with the
sun's magnetic field. The Sun's magnetic field is not
evenly distributed, but can become extremely strong
in certain regions. These strong magnetic fields
inhibit the movement of the gas, which causes the
temperature in these places to cool down and form
sunspots.
2.2 Effects of Sunspot Activity on
Earth's Climate
Solar flares and coronal mass ejections (CMES),
which are common during sunspot activity, unleash
massive volumes of plasma and high-energy particles
towards Earth, creating the solar wind. Geomagnetic
storms are the result of interactions between the solar
wind and Earth's magnetic field. Changes in the
Earth's magnetic field during geomagnetic storms can
change air circulation patterns, which can have an
impact on the climate system (
Hathaway,2015).
There is a long-term relationship between sunspot
activity and Earth's climate. During periods of low
sunspot activity, Earth experienced a relatively cold
period known as the "Little Ice Age." During this
period, the earth's temperature dropped significantly,
rivers froze, and crop yields decreased.
The effect of sunspots on Earth's climate is
multifaceted, but this effect is relatively small and
complex. Sunspot activity indirectly affects the
Earth's climate system by changing the intensity of
solar radiation, ultraviolet radiation, solar wind and
geomagnetic activity.
2.3 Effects of Sunspot Activity on
ENSO
The core driving mechanism of ENSO is the variation
of the southeast trade winds in the equatorial Middle
East Pacific. Peak sunspot activity's enhanced
radiation alters the atmospheric pressure gradient and
heats the equatorial atmosphere, weakening trade
winds and encouraging the flow of warm water
eastward, which leads to El Nino. Conversely,
periods of low sunspot activity can lead to stronger
trade winds, pushing more warm water to pile up in
the western Pacific and intensifying cold water
upturning in the eastern Pacific, creating a La Nina.
There is a periodic relationship between sunspot
activity and ENSO. Sunspot activity has a cycle of
about 11 years, while ENSO phenomena typically
have a cycle of 2-7 years. It has been found that the
peak and trough years of sunspot activity have
significant effects on the intensity and frequency of
ENSO. During peak sunspot years, El Nino may
strengthen, while La Nina may weaken; Conversely,
in sunspot valley years, El Nino events may weaken
and La Nina events may strengthen.
3 SUNSPOT ACTIVITY AND
ENSO DATA ANALYSIS
3.1 Source of Data on Sunspot
Numbers
Sunspot Index and Long-term Solar Observations
(SILSO) is an important project of the Royal
Observatory of Belgium (ROB), Its history can be
traced back to the sunspot observation network
established by Rudolf Wolf at the Zurich Observatory
in 1849(
Clette,Svalgaard,Vaquero and Cliver,2014).
Early data collection relied primarily on visual
observations by observatories and amateur observers
worldwide, and calculated daily indices based on the
Wolff number formula:
()()
10 10Wk gsWk gs=+=+ (1)
In the early 20th century, due to data discontinuity
caused by insufficient coverage of observation
network, the predecessor institution of SILSO used
interpolation method and analogy method of activity
intensity of adjacent periods to fill the gap in data
(
Cliver and Ling, 2016).
Modern data acquisition system integrates multi-
source observation technology. Since 1995, the
IAMPA 2025 - The International Conference on Innovations in Applied Mathematics, Physics, and Astronomy
548

Michelson Doppler Imager (MDI) of the SOHO
satellite and the Helioseismic and Magnetic Imager
(HMI) of the SDO satellite have provided surface and
white light images 24 hours a day. To help correct the
weather disturbance error of ground-based
observation. SILSO also uses a dynamic cross-
calibration process to re-evaluate historical data using
modern high-resolution data.
Therefore, SILSO has built a relatively complete
database for recording sunspots. This paper takes it as
a reliable data source, and visualizes and analyzes the
public data in it. The data source is (
Royal Observatory
of Belgium, 2025).
3.2 Source of Data for Oceanic Nino
Index (ONI)
Sea Surface Temperature (SST) refers to the
temperature of the ocean surface, usually the water
temperature of the ocean surface (usually within 0.5
m depth). SST data is a very important basic data in
oceanography and climatology, widely used in
weather forecast, climate research, Marine ecosystem
research, fishery management and other fields. The
source of SST data is mainly obtained through
satellite remote sensing technology. The sensor on the
satellite measures the radiation temperature of the
ocean surface, and then inverts the SST.
The Nino 3.4 index is calculated based on the SST
anomalies for the region of Nino 3.4 (5°N-5°S,
120° W-170 ° W), subtracted from each month's
SST anomalies, which are usually based on 30-year
climate averages. The calculation formula is as
follows:
-
nn
SST Exception SST SST= (2)
Where SST is SST value of this month;
SST is Revised monthly long term average SST;
n
n
:
The Oceanic Nino Index (ONI) is calculated using
the three-month sliding average of the SST anomalies
in the Nino 3.4 zone. The calculation formula is as
follows:
21
3
nnn
SST SST SST
Current Month ONI
−−
++
=
(3)
n-1
n-2
SST Exception Previous 2 Months;
SST is SST Exception Previous 1 Months;
SST is SST Exception Current Month;
Where: SST is
n
One of the major organizations involved in global
climate monitoring and forecasting, the National
Oceanic and Atmospheric Administration (NOAA),
uses the widely accepted and used criterion of ±0.5 °
C to assess El Nino and La Nina events.
An El Nino episode occurs when the ONI value is
at or above +0.5 °C for a minimum of five months.
A La Nina event occurs when the ONI value is at or
below -0.5 °C and lasts for at least five months,
according to the source (NOAA, 2025).
3.3 Data Preprocessing
The simple arithmetic average of the total number of
sunspots per day for every day of a given calendar
month is the monthly average number of sunspots.
The number of sunspots in the source data is
processed using moving average MA based on the
"March combination" in accordance with the standard
meteorological data processing procedure. The year,
month combination, and number of sunspots are
among the processed data components.
ONI downloads source data and has completed
the "March portfolio" moving average MA
processing. Data items include: Year, March
combination, ONI.
The above two groups of data were associated
with the same association condition as "year" and
"March combination". Delete irrelevant data items
from the results and get results that retain data from
1950 to 2024, which is called preprocessed data. Data
items include: year, March combination, number of
sunspots and ONI. Both sets of data have the same
time dimension, allowing for charting and data
correlation analysis.
3.4 Sunspot Count and ONI Charting
Using Python's matplotlib library, two sets of data are
presented on the same chart. The two groups of data
are visually displayed by graphical means (Figure 1)
in order to find the relationship between the two
groups of data. The horizontal coordinate represents
the time dimension of the "March combination", the
vertical axis of the principal coordinate represents the
number of sunspots, and the vertical axis of the
secondary coordinate represents ONI data. The red
graph illustrates the variations in ONI over time,
while the blue curve depicts the changes in sunspots.
Two horizontal red dashed lines are shown; the El
Nino threshold is at the top, while the La Nina
threshold is at the bottom.
From the figure 1, we can roughly observe that
when the number of sunspots is high and low, the
occurrence probability of ENSO phenomenon is
relatively high.
The Effect of Sunspot Activity on Earth’s Extreme Climate
549
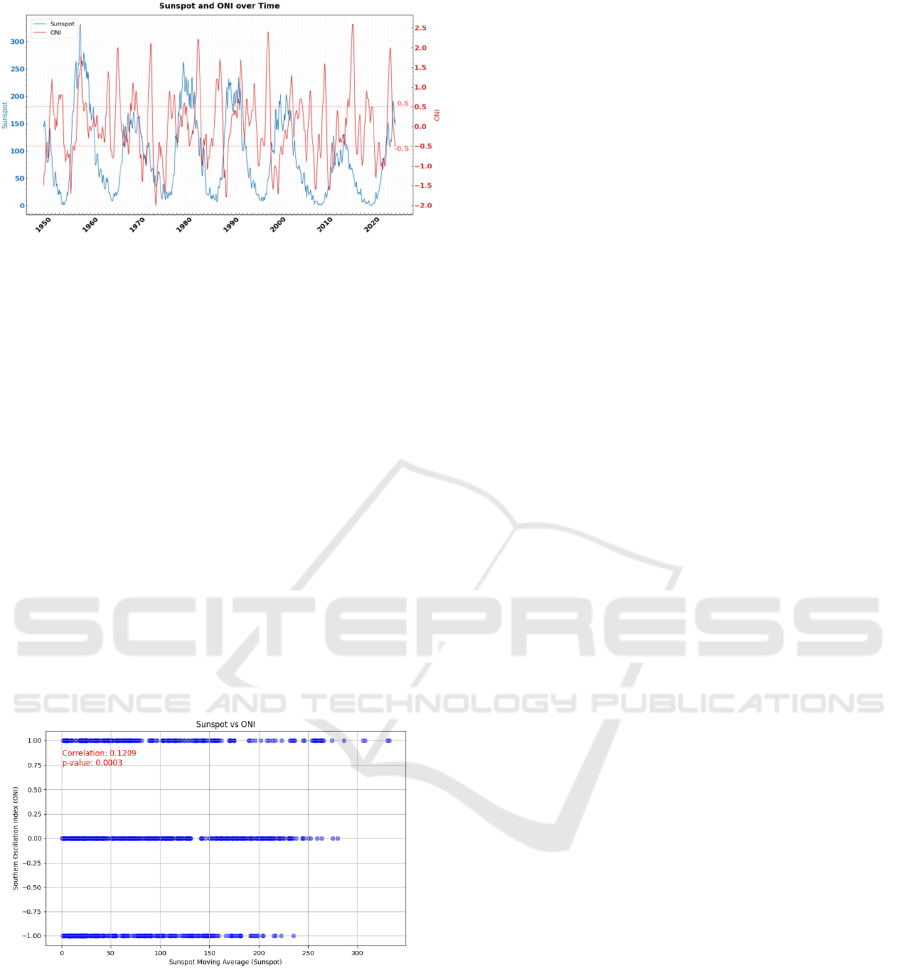
Figure 1 Number of sunspots and ONI time chart
3.5 Sunspot Number and ONI
Correlation Analysis
Using Python's scipy library, the correlation between
the two sets of data is quantified. The purpose is to
find the strength of the correlation between the two
groups of data through statistical methods. Firstly,
ONI values in preprocessed data are discretized: ONI
values greater than 0.5 are adjusted to 1, ONI values
less than -0.5 are adjusted to -1, and ONI values
between -0.5 and 0.5 are adjusted to 0. Then, the
correlation strength of the two groups of data was
analyzed by statistical means, as in figure 2. In the
figure, the horizontal coordinate represents the
number of sunspots, and the vertical coordinate
represents the ONI discrete data. The correlation
coefficient value of the two groups of data is 0.1209,
and the p-value is 0.0003.
Figure 2 Analysis of the correlation between the number
of black suns and ONI
Statistics show that when the P-value is very small
(usually less than 0.05), it means that the null
hypothesis is rejected and the correlation between the
two variables is considered statistically significant.
The two sets of data have a p-value of 0.0003, which
is well below the cutoff point of 0.05. Consequently,
it may be said that there is a correlation between the
two sets of data.
A measure of the correlation between data is the
correlation coefficient (r). The range of values is [−
1,1]. There is no linear correlation when r=0, a totally
negative correlation when r=− 1, and a completely
positive correlation when r=1. Although the
correlation between the two data sets is small, it is
positive, as seen by the two groups' r=0.1209.
4 CONCLUSION
In this paper, the association between sunspot number
and ENSO data is merged, and the impacts of sunspot
activity on the sun, Earth climate, and ENSO are
examined and explained. The conclusion is that
although sunspot activity is not the determining factor
of ENSO, the two have a positive link, and the
sunspot number change may be utilized as an ENSO
reference factor to assist predict ENSO episodes more
accurately.
ENSO is often monitored with the help of easily
accessible indirect data. In addition to ONI, there are
examples such as Sea Surface Temperature (SST),
Ocean Heat Content (OHC), Southern Oscillation
Index (SOI), and Multivariate ENSO Index (MEI)
and other indicators. Due to the limited space and data
acquisition methods, this paper only conducted
comparative analysis of ONI data, and ONI's
emphasis on the characterization of surface sea
temperature in the East Pacific Ocean may weaken
the driving role of OHC (Ocean Heat Content) on
ENSO events. The conclusion of the data relationship
has certain limitations, which cannot accurately
explain the association between sunspot activity and
ENSO.
At the same time, due to the limitations of
research conditions, the open data of SILSO and
NOAA platforms were used for analysis. Although
the authority of the data was guaranteed, there were
limitations. For example, differences in observation
criteria between platforms (e.g., SILSO's historical
sunspot count is calibrated and revised multiple times,
while NOAA's ONI calculations rely on ERSSTv5
reanalysis data) can lead to systematic error
accumulation across databases.
As a key disturbance source of the global climate
system, ENSO affects human life, and the
improvement of its prediction accuracy is of great
significance to disaster prevention and reduction.
Although this study is limited by the lack of data
dimension and mechanism interpretation, the
combination of multidisciplinary collaboration, high-
precision observation and numerical simulation is
expected to reveal the deep link between solar activity
IAMPA 2025 - The International Conference on Innovations in Applied Mathematics, Physics, and Astronomy
550

and ENSO, and ultimately serve a more reliable
climate prediction system. If cross-platform real-time
data analysis can be established in the future, it is
expected to contribute to the construction of more
accurate prediction models, and serve the adaptation
management of human beings to extreme climates.
REFERENCES
Den, K. W., 2023. Correlation study between coronal flow
activity and solar cycle (Master's thesis, Shandong
University).
https://link.cnki.net/doi/10.27272/d.cnki.gshdu.2023.0
06362.
NOAA, n.d. Current space weather conditions. Retrieved
March 22, 2025, from
https://www.swpc.noaa.gov/phenomena/sunspotssolar-
cycle.
NASA, n.d. Sunspots. Retrieved March 22, 2025, from
https://science.nasa.gov/sun/sunspots/.
Kessler, W. S., 2002. Is ENSO a cycle or a series of events?
Geophysical Research Letters 29(23), 40-1.
Philander, G., 1989. El Niño and La Niña. American
Scientist 77(5), 451–459.
ESCAP, U., Warning, R. I. M. H. E., 2016. Assessment of
El Nino associated risks: the step-wise process.
Hathaway, D. H., 2015. The solar cycle. Living Reviews in
Solar Physics 12(1), 4.
Clette, F., Svalgaard, L., Vaquero, J. M., Cliver, E. W.,
2014. Revisiting the sunspot number: A 400-year
perspective on the solar cycle. Space Science Reviews
186, 35-103.
Cliver, E. W., Ling, A. G., 2016. The discontinuity circa
1885 in the group sunspot number. Solar Physics
291(9), 2763-2784.
Royal Observatory of Belgium, n.d. Sunspot number.
Retrieved March 22, 2025, from
https://www.sidc.be/SILSO/datafiles.
NOAA, n.d. Cold & warm episodes by season. Retrieved
March 22, 2025, from
https://origin.cpc.ncep.noaa.gov/products/analysis_mo
nitoring/ensostuff/ONI_v5.php.
The Effect of Sunspot Activity on Earth’s Extreme Climate
551
