
Predicted Used Car Price in the UK Using Linear Regression and
Machine Learning Models
Dexin Huang
a
Department of Mathematics, University of Manchester, Grove House, Oxford Road, Manchester, M12 9WJ, U.K.
Keywords: Used Car Prices, Price Prediction, Linear Regression, Random Forest, K-Nearest Neighbours.
Abstract: The global used car market has witnessed substantial growth, particularly in Europe, driven by extensive
cross-border trading and improved vehicle quality. Accurate price prediction in this market is critical for
reducing information asymmetry, enhancing transparency, and supporting informed consumer decisions. This
study compares three regression models-Multiple Linear Regression (MLR), Random Forest (RF), and K-
Nearest Neighbours (KNN)-to predict used car prices in the UK, utilizing a comprehensive dataset of 3,685
vehicles sourced from Kaggle. Extensive feature engineering was applied, including log transformation of
vehicle prices, imputation of missing values, and encoding of categorical variables, to enhance model
performance. Results indicate that the Random Forest model achieved the highest predictive accuracy,
yielding a Coefficient of Determination (R²) value of 0.8714 and the lowest Mean Absolute Error (MAE) of
£821.76. While MLR provided valuable interpretability, it suffered from multicollinearity issues, and the
KNN model underperformed in high-dimensional settings. These findings highlight critical methodological
insights and practical implications, contributing to more accurate, data-driven pricing strategies in the UK’s
automotive resale market.
1 INTRODUCTION
The global used car market has grown significantly in
recent decades. In Europe in particular, the used car
market represents a significant amount of economic
activity, characterized by extensive cross-border
trade, reflecting the large differences in vehicle
characteristics (e.g. age, fuel type and engine
displacement) between countries (Duvan and Aykaç,
2009). The used car industry is generally more
profitable than the new car industry, highlighting its
importance in maintaining dealer income and market
vitality. This growth has been driven in large part by
improvements in the quality and reliability of used
cars (Mehlhart et al., 2011). Therefore, improving
transparency and accurately predicting used car
prices is crucial to reducing information asymmetry
and supporting sustainable market development. This
study therefore aims to develop a reliable used car
price prediction model for the UK market.
A growing body of literature has compared
various machine learning models for used car price
prediction, focusing primarily on Linear Regression
a
https://orcid.org/0009-0004-4539-6907
(LR), Random Forest (RF), and K-Nearest Neighbors
(KNN). These models differ not only in structure but
also in their capacity to manage complex interactions,
scalability, and sensitivity to feature processing.
Linear Regression remains a widely applied
baseline due to its interpretability and computational
efficiency. Alhakamy et al. demonstrated that LR can
produce solid predictive results when applied to
structured datasets, achieving an R² of 0.872 and
RMSE of 2091 using features such as brand, mileage,
fuel type, and transmission type (Alhakamy et al.,
2023). Similarly, Pudaruth emphasized the benefit of
applying logarithmic transformation to the price
variable, along with encoding categorical variables
like model and color, which enhanced the model’s fit
(Pudaruth, 2014). However, the limitations of LR are
well documented. The model assumes linearity and is
sensitive to multicollinearity among features. Studies
showed that including irrelevant or weakly correlated
variables significantly reduces predictive accuracy
(Asghar et al., 2021). However, this drawback is less
severe in more flexible models like RF.
534
Huang, D.
Predicted Used Car Price in the UK Using Linear Regression and Machine Learning Models.
DOI: 10.5220/0013829000004708
Paper published under CC license (CC BY-NC-ND 4.0)
In Proceedings of the 2nd International Conference on Innovations in Applied Mathematics, Physics, and Astronomy (IAMPA 2025), pages 534-540
ISBN: 978-989-758-774-0
Proceedings Copyright © 2025 by SCITEPRESS – Science and Technology Publications, Lda.

Random Forest has gained increasing popularity
in recent literature for its robustness and ability to
model non-linear relationships. Valarmathi et al.
achieved an R² of 0.9621, MSE of 0.044, and RMSE
of 0.2096 using RF on a multi-brand car dataset
containing 19 features (Valarmathi et al., 2023). The
model’s internal structure enables it to capture
complex variable interactions and automatically
assess feature importance, making it less sensitive to
irrelevant inputs. Chen et al. reported that in a
universal model with over 100000 samples and 19
features, Random Forest achieved a Normalized
Mean Squared Error of 0.052, compared to 0.26 for
Linear Regression-representing an approximately
80% reduction in prediction error (Chen et al., 2017).
However, RF comes at the cost of interpretability and
higher computational demand, which may limit its
application in real-time or user-facing environments.
K-Nearest Neighbors, though less common, has
been explored as a non-parametric alternative that
performs well in small, well-prepared datasets. Das
Adhikary et al. applied KNN with careful feature
normalization and reported an RMSE of 6.72, noting
that the model achieved reasonable accuracy despite
its simplicity (Adhikary et al., 2022). Other studies
compared KNN and LR found that KNN performed
better for certain vehicle segments with more
localized feature patterns but degraded in high-
dimensional spaces due to its reliance on distance
metrics (Samruddhi and Kumar, 2020). KNN also
lacks internal mechanisms for feature selection,
making it highly sensitive to unscaled or noisy inputs.
Across these studies, feature engineering
consistently emerged as a critical factor influencing
model success. Pudaruth and others emphasized that
preprocessing steps-such as log transformation of the
target variable, imputation of missing values, and
encoding of categorical data-significantly improved
model accuracy, especially for LR and KNN
(Pudaruth, 2014; Adhikary et al., 2022). In contrast,
RF demonstrated greater robustness to imperfect
features due to its ensemble structure, which reduces
the impact of noise and redundancy (Valarmathi et
al., 2023; Chen et al., 2017).
Additionally, dataset scale and complexity were
found to influence model choice. RF maintained high
performance as dataset size and feature interactions
increased, while LR and KNN were more effective in
smaller, cleaner datasets with linear relationships
(Asghar et al., 2021; Samruddhi and Kumar, 2020).
These findings underscore the importance of aligning
model selection with data characteristics and
analytical goals.
In summary, while each model presents distinct
strengths and limitations, Random Forest generally
excels in handling complex, high-dimensional data,
Linear Regression offers interpretability under clean
linear conditions, and KNN provides a simple yet
effective solution in small, structured contexts.
Although the existing literature provides valuable
insights into used car price forecasting, research has
focused primarily on broader or non-UK markets,
leaving significant knowledge gaps regarding the
unique dynamics of the UK used car market.
Furthermore, interpretability remains a practical
challenge despite the prevalence of complex
algorithms. Therefore, this study specifically adopts
linear regression and machine learning methods to
strike a balance between prediction accuracy and
interpretability to investigate key influencing factors
and improve the reliability of price predictions within
the UK. Ultimately, this study aims to support the
Sustainable Development Goals by improving market
transparency and facilitating informed consumer
decision-making.
2 METHODOLOGY
2.1 Data Source
The dataset utilized in this research was sourced from
Kaggle, made publicly available under the CC0
Public Domain License, which had been downloaded
2,631 times. It contains detailed records of 3,685 used
cars listed in the UK, encompassing diverse attributes
covering technical specifications, vehicle features,
and market indicators, 14 variables and their
descriptions are summarized in Table 1.
Table 1: Summary of Original Variables in the Used Car Dataset.
Variable Name Description Type
Unnamed: 0 Index column (not used) Numerical
title Full title of the car listing (e.g., SKODA Fabia, Vauxhall Corsa...) Categorical
Price Selling price of the vehicle in GBP Numerical
Mileage(miles) Total distance the vehicle has traveled Numerical
Predicted Used Car Price in the UK Using Linear Regression and Machine Learning Models
535

Registration_Year Year the vehicle was first registered Numerical
Previous Owners Number of previous owners Categorical
Fuel type Type of fuel the vehicle uses (e.g., Diesel, Petrol...) Categorical
Body type Style of the car body (e.g., Hatchback...) Categorical
Engine Engine displacement in litres (e.g., 1.4L...) Categorical
Gearbox Transmission type, Manual, or Automatic Categorical
Doors Number of doors Categorical
Seats Number of seats Categorical
Emission Class Emission compliance category (e.g., Euro 6...) Categorical
Service history Service record status (e.g., Full) Categorical
2.2 Data Preprocessing
To enhance model performance and data quality,
several preprocessing and feature engineering steps
were conducted. Three new variables were derived:
Car Age (calculated as 2024 minus registration year),
Engine Size (extracted from text), and Brand (parsed
from car titles). Irrelevant or redundant fields such as
title, Unnamed: 0, Engine, and Service history were
removed.
Missing values were handled based on variable
types. Previous Owners and Engine Size were filled
using the median, while Doors and Seats, as discrete
numeric variables, were filled using the mode.
Missing values in Emission Class were labeled as
“Unknown.”
Categorical variables (e.g., fuel type, body type,
gearbox, brand) were encoded using One-Hot
Encoding, with the first category dropping to avoid
multicollinearity. To reduce skewness in the target
variable, a log transformation was applied: 𝑦 =
𝑙𝑜𝑔(1 + 𝑃𝑟𝑖𝑐𝑒). Finally, the dataset was split into
80% training and 20% testing sets to support model
development and performance evaluation.
2.3 Modelling Methods
Three models were implemented: Multiple Linear
Regression (MLR), Random Forest (RF), and K-
Nearest Neighbors (KNN).
The LR model utilized Ordinary Least Squares
(OLS) estimation. Outlier removal was conducted
based on standardized residuals exceeding an
absolute z-score threshold of 3, ensuring robustness
of the final evaluation. A large language model
(LLM) supported code generation. The RF model was
trained with the log-transformed price, with
hyperparameter tuning via 5-fold GridSearchCV and
feature importance analysis. This process followed
prior ensemble modeling literature (Pal et al., 2019).
And the KNN model applied Min-Max scaling and
used k=2, chosen based on the lowest test RMSE. The
codebase was adapted from an external source
(Vidhya, 2018).
All models were evaluated on a consistent test set
using Coefficient of Determination (R²), Mean
Absolute Error (MAE), and Root Mean Squared Error
(RMSE), with additional residual plots and diagnostic
visualizations to assess predictive reliability. This
comprehensive approach ensured robust assessment
of each model's predictive accuracy and reliability in
the context of the UK used car market.
3 RESULTS AND DISCUSSION
3.1 Exploratory Data Analysis
Exploratory analysis was conducted to examine key
patterns in the dataset. Used car prices were right-
skewed, with most listings below 10,000, supporting
the use of log transformation. Among the top 10 most
frequent brands, premium manufacturers such as
BMW and Audi had significantly higher average
prices than budget brands like Ford and Vauxhall.
Fuel type comparisons showed that hybrid and
electric vehicles generally had higher prices, while
petrol and diesel cars displayed broader price
variability. A negative relationship between car age
and price was evident, reflecting the depreciation
effects. Correlation analysis using the Pearson
correlation coefficient confirmed strong negative
associations between price and both car age (r = –
0.72) and mileage (r = –0.50), while other numeric
features had weak or negligible correlations.
These patterns provide a data-driven basis for
model selection and feature engineering in the
subsequent analysis.
IAMPA 2025 - The International Conference on Innovations in Applied Mathematics, Physics, and Astronomy
536
3.2 Linear Regression Model
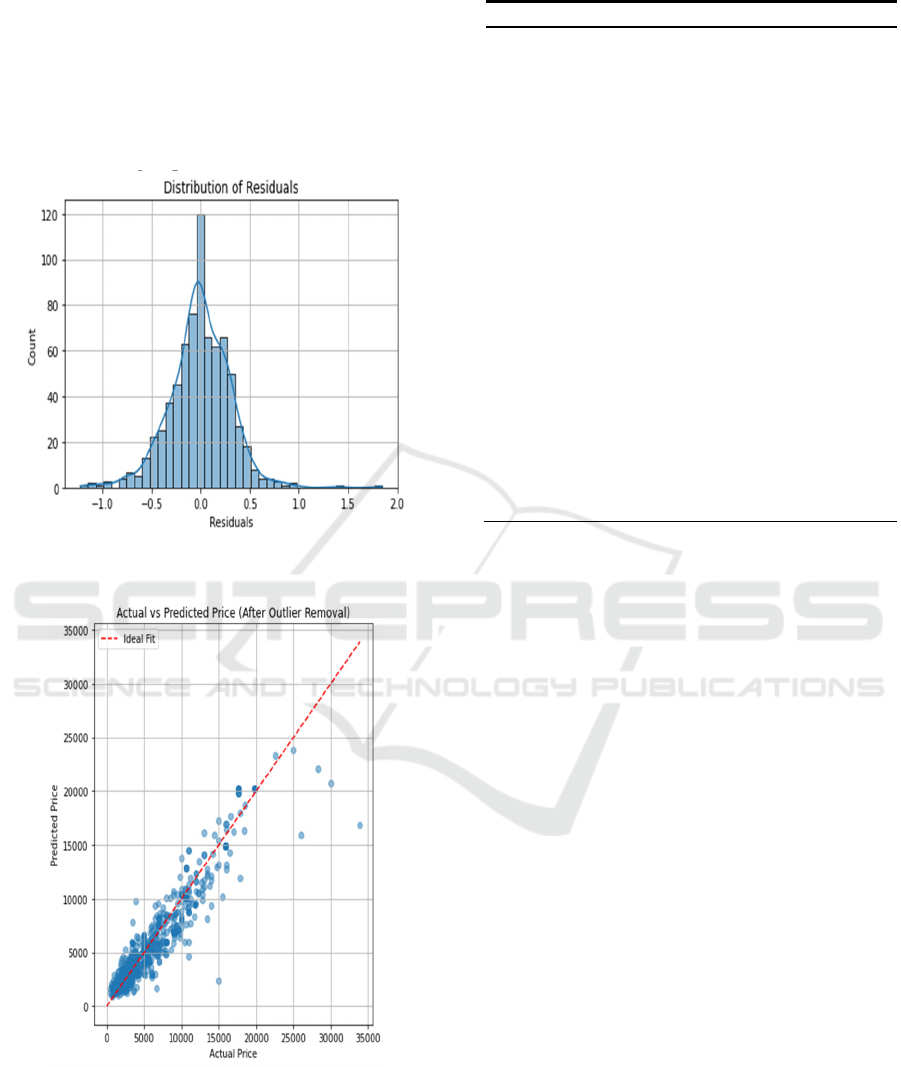
Both of Figure 1 and Figure 2 demonstrated the LR
model supporting the assumption of homoscedasticity
and normality and a strong overall fit. The overall
model was statistically significant (F-statistic = 199.7,
p < 0.001), suggesting that the regression equation
provides meaningful predictions.
Figure 1: Distribution of residuals of LR (Picture credit:
Original).
Figure 2: Actual vs. predicted scatter plot of LR (Picture
credit: Original).
Table 2: Significance of variables.
As shown in Table 2, analysis of the regression
coefficients revealed several statistically significant
positive predictors, notably Engine Size, Fuel type:
Petrol, Fuel type: Petrol Plug-in Hybrid, as well as
high-end brands such as Lagonda and Marcos.
Conversely, variables such as Car Age, Mileage, and
Emission Class Euro 3-5 exhibited significant
negative effects on vehicle price. A subset of
variables, including Brand_Toyota,
Brand_Mercedes-Benz, Seats, and Doors, were found
to be statistically non-significant (p>0.05), indicating
marginal explanatory power and suggesting potential
for model simplification through variable elimination.
Moreover, the condition number of the design
matrix was found to exceed 10¹⁶, signalling the
presence of severe multicollinearity—most likely
induced by the extensive one-hot encoding of
categorical variables. This condition can lead to
instability in coefficient estimates and reduced model
interpretability. To address this issue, future research
could incorporate dimensionality reduction
techniques such as Principal Component Analysis
(PCA) or apply regularized regression frameworks
like Lasso to enhance model robustness and mitigate
collinearity effects.
3.3 Random Forest Model
As shown in Figure 3 and Figure 4, the RF model
exhibits strong predictive performance, with
Feature Direction p-value
Engine Size Positive < 0.001
Fuel type_Petrol Positive < 0.001
Fuel type_Petrol
Plug-in Hybri
d
Positive 0.011
Brand_Lagonda Positive < 0.001
Brand_Marcos Positive < 0.001
Car Age Negative < 0.001
Mileage(miles) Negative < 0.001
Emission Class_Euro
3
Negative < 0.001
Emission Class_Euro
4
Negative < 0.001
Emission Class_Euro
5
Negative 0.003
Body
t
yp
e
_
Hatchbac
k
Negative 0.018
Body type_MPV Negative 0.023
Body type_Minibus Negative 0.001
Brand_Toyota Uncertain 0.97
Brand_Mercedes-
Benz
Uncertain 0.913
Seats Uncertain 0.335
Doors Uncertain 0.388
Predicted Used Car Price in the UK Using Linear Regression and Machine Learning Models
537
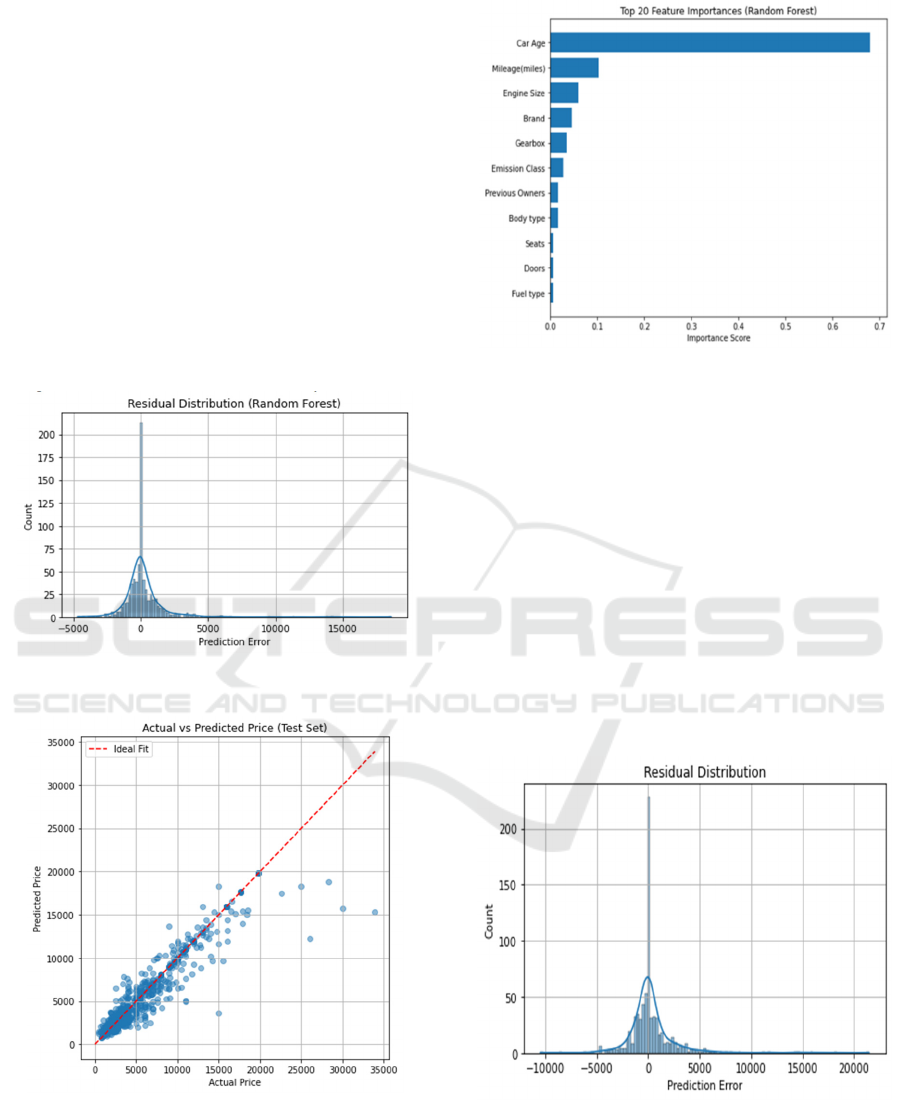
predicted prices closely aligning with actual values
along the ideal fit line. The residuals are
symmetrically distributed around zero, indicating
minimal bias and stable error patterns. Compared to
the LR model, RF shows improved fit in high-price
ranges.
Figure 5 shows a concentrated distribution, in
which Car Age is the most important feature, with an
importance of about 0.68, followed by Mileage and
Engine Size. This heavily skewed importance pattern
indicates that the RF model successfully separated the
most influential predictors, rather than assigning
equal importance to the relevant variables-a common
symptom of multicollinearity. The LR model has a
condition number of over 10
16
, while the random
forest model identifies similar core predictors and
mitigates the effects of multicollinearity.
Figure 3: Residual Distribution of RF (Picture credit:
Original).
Figure 4: Actual vs. predicted scatter plot of RF (Picture
credit: Original).
Figure 5: Feature importance plot (Picture credit:
Original).
3.4 KNN Model
Figure 6 shows wider dispersion and the presence of
large errors, indicating limited robustness,
particularly in high-price segments. Figure 7 further
reveals substantial deviation from the ideal fit line,
reflecting reduced accuracy and generalization
capability. This underperformance is partly attributed
to KNN’s reliance on distance metrics, which
becomes less effective in high-dimensional feature
spaces due to the curse of dimensionality.
Nevertheless, the KNN model retained some
predictive value in lower price ranges, suggesting
potential utility in smaller, more structured datasets.
Figure 6: Residual Distribution of KNN (Picture credit:
Original).
IAMPA 2025 - The International Conference on Innovations in Applied Mathematics, Physics, and Astronomy
538
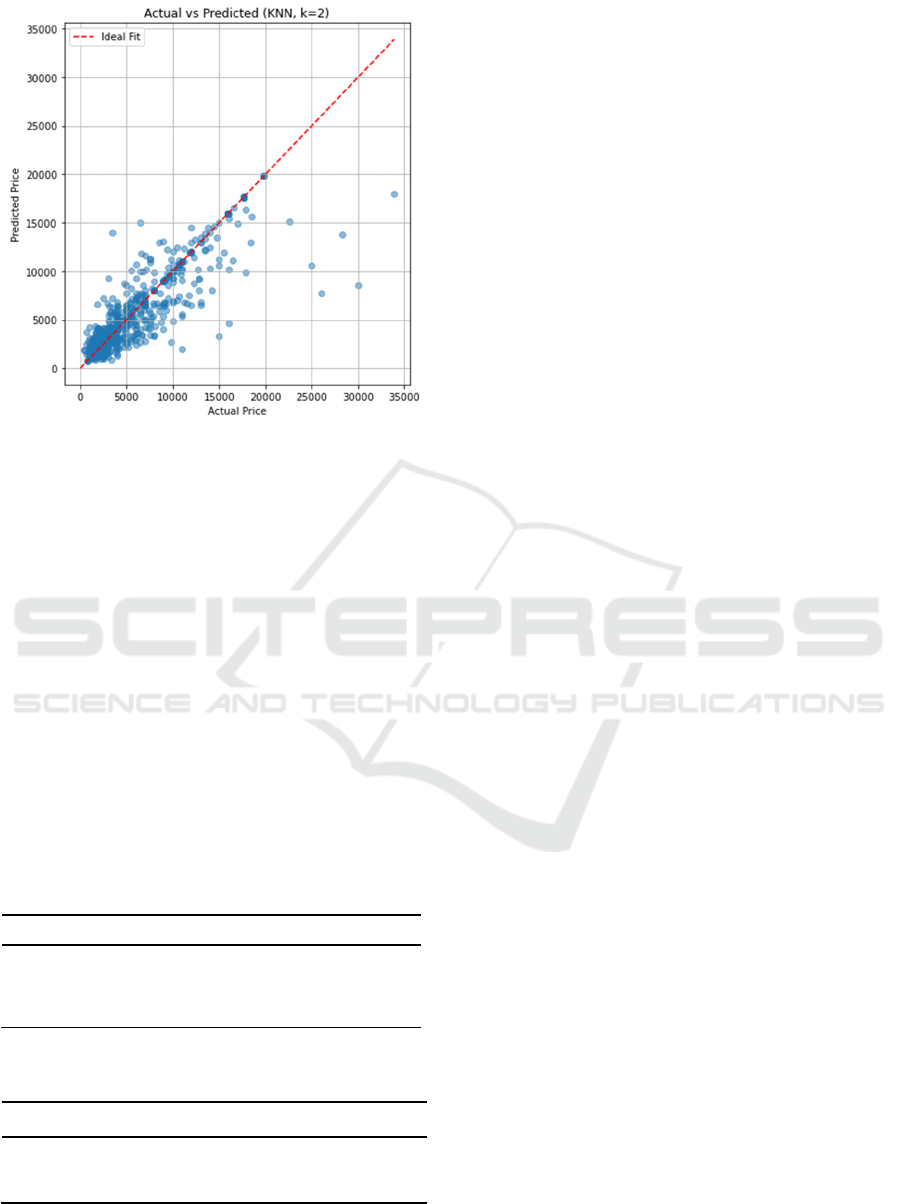
Figure 7: Actual vs. predicted scatter plot of KNN (Picture
credit: Original).
3.5 Overall Performance
Initially, the performances of three predictive models-
Log-Transformed Multiple Linear Regression (LR),
Random Forest (RF), and K-Nearest Neighbors
(KNN)-were evaluated on an original test dataset in
Table 3. Both LR and RF exhibited strong predictive
performance, with very similar R² values of 0.8726
and 0.8714, respectively, indicating excellent
explanatory power and accuracy. In contrast, KNN
demonstrated notably poorer performance, reflected
by a significantly lower R² of 0.7474 and higher
prediction errors (RMSE = 2341.62), indicating its
limited effectiveness for this dataset.
Table 3: Comparison of Models.
Table 4: Comparison of Models with Unified Dataset.
Furthermore, given the comparable performance of
RF and MLR in Table 4, both models were
subsequently retrained and reassessed using a unified
dataset split to eliminate the potential variability
caused by random partitioning. Under this rigorous
unified evaluation, RF significantly outperformed
MLR, achieving an improved R² of 0.8734 compared
to 0.7807 for MLR, accompanied by notably lower
MAE and RMSE values. These results confirm that
the RF model demonstrates superior robustness and
accuracy, particularly in capturing complex,
nonlinear interactions within the data. This rigorous
evaluation provides a solid foundation for subsequent
residual diagnostics and feature importance analysis.
4 CONCLUSION
This study provides an empirical comparison of three
predictive models-Multiple Linear Regression
(MLR), Random Forest (RF), and K-Nearest
Neighbors (KNN)-for estimating used car prices in
the UK market. Among them, RF achieved the highest
predictive accuracy, while MLR offered the strongest
interpretability. Although KNN performed
moderately, its sensitivity to feature scaling and high
dimensionality limited its effectiveness. Through
rigorous feature engineering , the overall model
performance improved considerably. Statistical
diagnostics revealed that while MLR was prone to
multicollinearity, RF demonstrated greater robustness
and consistency in identifying key price determinants
such as car age, mileage, and engine size.
However, several limitations should be
acknowledged. The dataset was limited to a single
platform and may not reflect the full heterogeneity of
the UK market. Multicollinearity remained an issue in
the linear model, and KNN underperformed in high-
dimensional spaces. Although RF delivered strong
results, its limited interpretability and computational
demands may constrain real-time applications. Future
research could address these issues by integrating
more diverse data sources (e.g., seller descriptions,
regional indicators), applying regularization
techniques, and exploring ensemble or hybrid models
for more robust and generalizable performance.
REFERENCES
Adhikary, D. R. D., Ullah, M. A., Hassan, S. M. R.,
Rahman, S. M. 2022. Predicting used car prices using
machine learning techniques. Proceedings of the
Model R² MAE RMSE
LR 0.8726 1054.92 1662.93
RF 0.8714 821.76 1670.85
KNN
0.7474 1200.06 2341.62
Model R² MAE RMSE
LR 0.7807 1377.04 2181.87
RF 0.8734 804.24 1657.65
Predicted Used Car Price in the UK Using Linear Regression and Machine Learning Models
539

International Conference on Computer and Information
Technology (ICCIT).
Alhakamy, A., Alhowaity, A., Alatawi, A. A., Alsaadi, H.
2023. Are used cars more sustainable? Price prediction
based on linear regression. Sustainability, 15(9), 911.
Asghar, M., Mehmood, K., Yasin, S., Khan, Z. M. 2021.
Used cars price prediction using machine learning with
optimal features. Pakistan Journal of Engineering and
Technology (PakJET), 4(2), 113-119.
Chen, C., Hao, L., Xu, C. 2017. Comparative analysis of
used car price evaluation models. AIP Conference
Proceedings, 1839, 020165.
Duvan, B. S., Aykaç, D. S. Ö. 2009. Used car remarketing.
Renault & Ozyegin University.
Mehlhart, G., Merz, C., Akkermans, L., Jordal-Jørgensen,
J. 2011. European second-hand car market analysis:
Final report. European Commission – DG Climate
Action.
Pal, N., Arora, P., Kohli, P., Sundararaman, D., Palakurthy,
S. S. 2019. How much is my car worth? A methodology
for predicting used cars’ prices using random forest.
Proceedings of the Future of Information and
Communication Conference, 886, 413-422.
Pudaruth, S. 2014. Predicting the price of used cars using
machine learning techniques. International Journal of
Information and Computation Technology, 4(7), 753-
764.
Samruddhi, K., Kumar, R. A. 2020. Used car price
prediction using K-nearest neighbor based model.
International Journal of Innovative Research in Applied
Sciences and Engineering (IJIRASE), 4(2), 629-632.
Valarmathi, B., Gupta, N. S., Santhi, K., Chellatamilan, T.,
Kavitha, A., Raahil, A., Padmavathy, N. 2023. Price
estimation of used cars using machine learning
algorithms. In Proceedings of the International
Conference on Computing, Communication and
Computational Sciences (IC4S), 472, 26-41.
Vidhya, A. 2018. K-nearest neighbor-Introduction to
regression in Python. Analytics Vidhya.
IAMPA 2025 - The International Conference on Innovations in Applied Mathematics, Physics, and Astronomy
540
