
Diabetes Risk Assessment: A Logistic Regression Modelling Study
Based on Large-Scale Data
Haotian Sun
1a
, Haoning Tian
2b
and Fan Zhang
3,* c
1
Wuhan Britain-China School, Wuhan, Hubei, 430030, China
2
School of Mathematics, Tianjin University of Finance and Economics, Tianjin, 300222, China
3
Faculty of Science, University of Alberta, Edmonton, Alberta, T6G2G5, Canada
*
Keywords: Diabetes, Risk Assessment, Logistic Regression, Random Forest.
Abstract: As a major global public health problem, early diagnosis and accurate risk assessment of diabetes are of great
significance for disease prevention and control. Based on machine learning methods, this study systematically
explored the application efficiency and clinical value of logistic regression (LR) and random forest (RF)
algorithms in diabetes prediction. The study used a clinical data set of 768 observations to construct a
prediction model by analyzing key health indicators such as blood glucose level, BMI index, age, number of
pregnancies, and diabetes pedigree function. The results showed that the LR model showed good prediction
performance with an accuracy of 78.26%, among which blood glucose level, BMI index, number of
pregnancies, and diabetes pedigree function were identified as the most statistically significant predictors.
The RF model (500 decision trees) showed a stronger ability to capture nonlinear relationships, with an
accuracy of 74.03% and an AUC value of 0.831. Feature importance analysis showed that blood glucose,
BMI, and age contributed the most to prediction. LR provides clear clinical interpretability, which helps
doctors understand the impact of each risk factor; RF can effectively identify complex interactions between
variables.
1 INTRODUCTION
Diabetes mellitus has long been a major global health
challenge due to its chronic and progressive nature. It
is mainly characterized by chronically elevated blood
glucose levels, caused by insufficient insulin
secretion or insulin dysfunction, and common types
include type 1 diabetes, type 2 diabetes, and
gestational diabetes. According to the World Health
Organization, in 2012, diabetes directly caused 1.5
million deaths and an additional 2.2 million deaths
due to cardiovascular disease caused by
hyperglycemia, and the global prevalence of diabetes
has increased from 180 million cases in 1980 to 422
million cases in 2014 (Roglic, 2016). It is meaningful
to analyze the factors of diabetes, such as gender,
since the challenge caused by diabetes is more serious.
As the Gale study shows that men are more likely
to develop type 2 diabetes at a younger age, while
a
https://orcid.org/0009-0000-7575-4737
b
https://orcid.org/0009-0004-8221-8560
c
https://orcid.org/0009-0007-4588-5999
women's risk rises significantly after menopause, the
impact of gender on diabetes has been widely
publicized. In addition, female patients have a higher
risk of cardiovascular disease than men (Gale &
Gillespie, 2001).
Other researchers’ studies show that biochemical
indicators are strongly associated with diabetic
complications. Lewis et al. (2005) found that high
homocysteine levels were associated with a
prevalence of diabetic nephropathy as high as 93.3%,
with a 7.15-fold increase in risk. Dehghan's study
demonstrated that C-reactive protein (CRP) levels
were independently associated with the risk of
diabetes, and that genetic variants may increase
susceptibility (Dehghan et al., 2007).
Lifestyle factors are also important influences.
Carlsson’s meta-analysis found that moderate alcohol
consumption reduced the risk of type 2 diabetes by
30%, but this effect has been less well studied in
464
Sun, H., Tian, H. and Zhang, F.
Diabetes Risk Assessment: A Logistic Regression Modelling Study Based on Large-Scale Data.
DOI: 10.5220/0013827600004708
Paper published under CC license (CC BY-NC-ND 4.0)
In Proceedings of the 2nd International Conference on Innovations in Applied Mathematics, Physics, and Astronomy (IAMPA 2025), pages 464-469
ISBN: 978-989-758-774-0
Proceedings Copyright © 2025 by SCITEPRESS – Science and Technology Publications, Lda.
female populations (Carlsson, Hammar, & Gril,
2005). In addition, studies have shown that high
triglyceride levels are an independent risk factor for
diabetes mellitus, especially significant in young men
(Tirosh et al., 2008).
Dietary composition has a profound effect on
diabetes. Studies in India have shown that high sugar
intake is strongly associated with increasing trends in
obesity and type 2 diabetes, affecting metabolism
mainly through insulin resistance and fat
accumulation (Gulati & Misra, 2014). Despite
medical advances that have reduced some of the risks
of diabetic complications, the prevalence of diabetes
is still rising globally, and the burden of disease is
expected to increase further with an ageing
population and increasing obesity rates (Deshpande,
Harris-Hayes & Schootman, 2008).
According to over studies, in order to provide a
more comprehensive diabetes prevention and control
strategy, this study aims to analyze a dataset to
investigate the various factors influencing diabetes
and the internal relations between these factors with
the logistic regression (LR) model and the random
forest (RF) model.
2 METHODOLOGY
2.1 Data Source and Description
The dataset used in this study is the Pima Indians
Diabetes Database, a widely used dataset for diabetes
prediction and related research. The data was
originally collected by the National Institute of
Diabetes and Digestive and Kidney Diseases
(NIDDK) and contains diagnostic information on
Pima Indian women aged 21 years and older (Kaggle,
n.d.). This dataset consists of 768 observations with 9
variables, including Pregnancies (PREG), Glucose
(GLUC), Blood Pressure (BLDP), Skin Thickness
(SKIN), Insulin (INSU), Body Mass Index (BMI),
Diabetes Pedigree Function (DPF), Age, and
Outcome. Among these variables, the Outcome
stands for whether the patient is diagnosed with
diabetes, and it stays with binary form where 1
indicates a diagnosis of diabetes and 0 indicates no
diagnosis.
The dataset has been preprocessed to remove
missing values and ensure consistency across all
observations. Each variable represents different
health-related indicators that are commonly used in
diabetes research. The dataset is publicly available
and widely used in medical and machine learning
studies to explore diabetes risk factors.
2.2 Selection and Explanation of
Variables
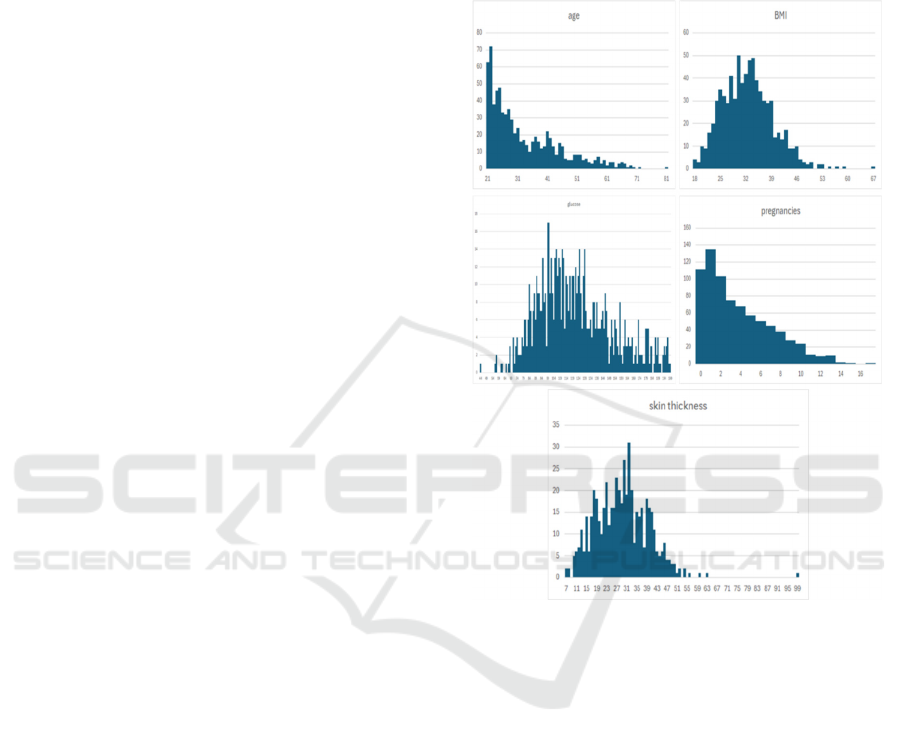
As shown in Figure 1, this study focuses on these key
variables, including age, BMI, BLDP, DPF, GLUC,
INSU, PREG, SKIN:
Figure 1: Distribution of Variables
(Photo/Picture credit:
Original).
2.3 Model Choice
The dataset will be used to fit in a LR model because
it is interpretable, has probabilistic outputs, and is
consistent with the research goal of understanding
diabetes risk factors. Unlike complex machine
learning models, LR provides clear and interpretable
coefficients that allow researchers and healthcare
professionals to understand how each predictor (e.g.,
blood glucose level, BMI, age, and family history)
affects the likelihood of developing diabetes.
Moreover, LR can naturally handle binary
classification problems, such as diabetes prediction,
where the outcome is either diabetes (1) or non-
diabetes (0). LR model is also suitable for fields that
need analysis of the importance of features, such as
medication. The model estimates the probability of
diabetes occurring, making it suitable for risk
assessment and threshold-based medical decision-
Diabetes Risk Assessment: A Logistic Regression Modelling Study Based on Large-Scale Data
465
making. The resulting advantage ratios help quantify
the impact of individual predictors, which is useful
for both clinical guidelines and public health policy.
RF model will also be employed to complement
the findings of the LR model. While LR is well-suited
to understanding the linear relationship between risk
factors and diabetes, RFs help to address non-linear
interactions and complex dependencies between
variables, providing a broader perspective on the
factors that influence diabetes.
3 DATA ANALYSIS OUTCOME
3.1 LR Model
Table 1 is the LR model output
Table 1: Output of LR Model
Estimate
Std.Erro
r
z value
Pr(>|z|
)
(Intercept
)
-8.405 0.717
-
11.728
0.000
p
re
g
0.123 0.032 3.840 0.000
gluc
0.03
5
0.004 9.481 0.000
b
ld
p
-0.013 0.005 -2.540 0.011
skin 0.001 0.007 0.090 0.928
insu -0.001 0.001 -1.322 0.186
b
mi 0.090 0.015 5.945 0.000
dia_p 0.945 0.299 3.160 0.001
a
g
e 0.015 0.009 1.593 0.111
The analysis of the dataset through a LR model
demonstrates how various variables produce
statistically relevant effects on diabetes prediction.
The data reveals that both pregnancies and glucose
and BMI measurements, together with diabetes
prediction, perform as the highest significant positive
influential factors in the model. Among them, glucose
shows the strongest statistical significance, followed
by BMI, while pregnancies and diabetes prediction
play supporting roles. The results proved compatible
with existing medical knowledge regarding the risk
factors of diabetes, which include elevated glucose
levels, together with higher BMI and an inherited
history of diabetes. This model indicates that blood
pressure shows slight statistical significance, yet
insulin levels and age, together with skin condition,
exhibit no substantial evidence of contributing to
diabetes prediction.
The model’s overall performance was evaluated
using the Akaike Information Criterion (AIC), which
yielded a value of 741.45, indicating a reasonable
model fit. Meanwhile, the model’s predictive
accuracy has reached 78.26%, which also indicates
the great quality of the model.
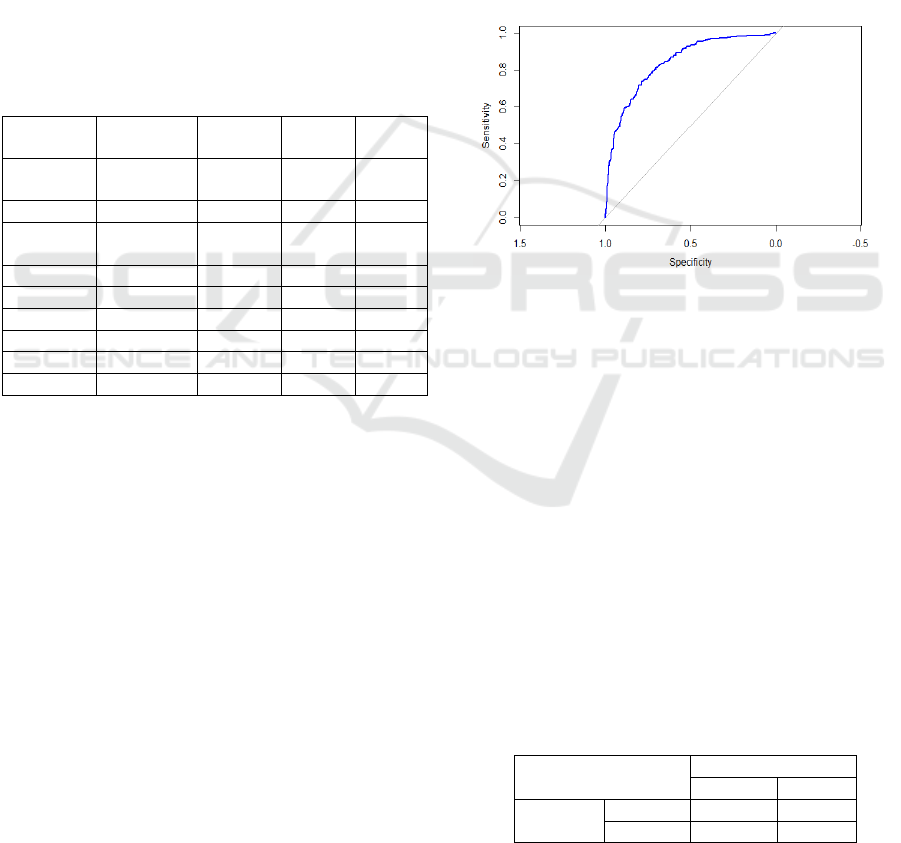
In addition, the Receiver Operating Characteristic
(ROC) curve is also generated with its Area Under
Curve (AUC) value to evaluate such a model, and
generally, a model with strong discriminatory power
will have a curve that rises sharply towards the upper-
left corner, indicating high sensitivity and specificity.
In this case, as seen in Figure 2, the ROC curve is
well above the diagonal reference line, which
represents a model making random guesses indicating
that the LR model performs significantly better than
random classification. Meanwhile, the value of AUC
reaches 0.8394. Both results demonstrate that the LR
model is effective in predicting diabetes status.
Figure 2: ROC Curve of LR Model (Photo/Picture credit:
Original).
3.2 RF Model
The RF model is used on the diabetes dataset for
comparison with the previously analyzed LR model.
This model implementation utilizes 500 different
decision trees that randomly choose 3 variables from
the tree variables for each splitting operation. The
entire data collection underwent partitioning into
testing with 30% and training with 70%. The out-of-
bag error rate reached 25.14%, which represents a
good classification outcome. The accuracy level in
testing reached 74.03%, which proved that the model
performed well yet required improvements.
The confusion matrix of the RF is shown in Table
2.
Table 2: Confusion Matrix of RF
Actual
Negative Positive
Predicte
d
Negative 126 36
Positive 24 45
RF feature importance as Table 3.
IAMPA 2025 - The International Conference on Innovations in Applied Mathematics, Physics, and Astronomy
466
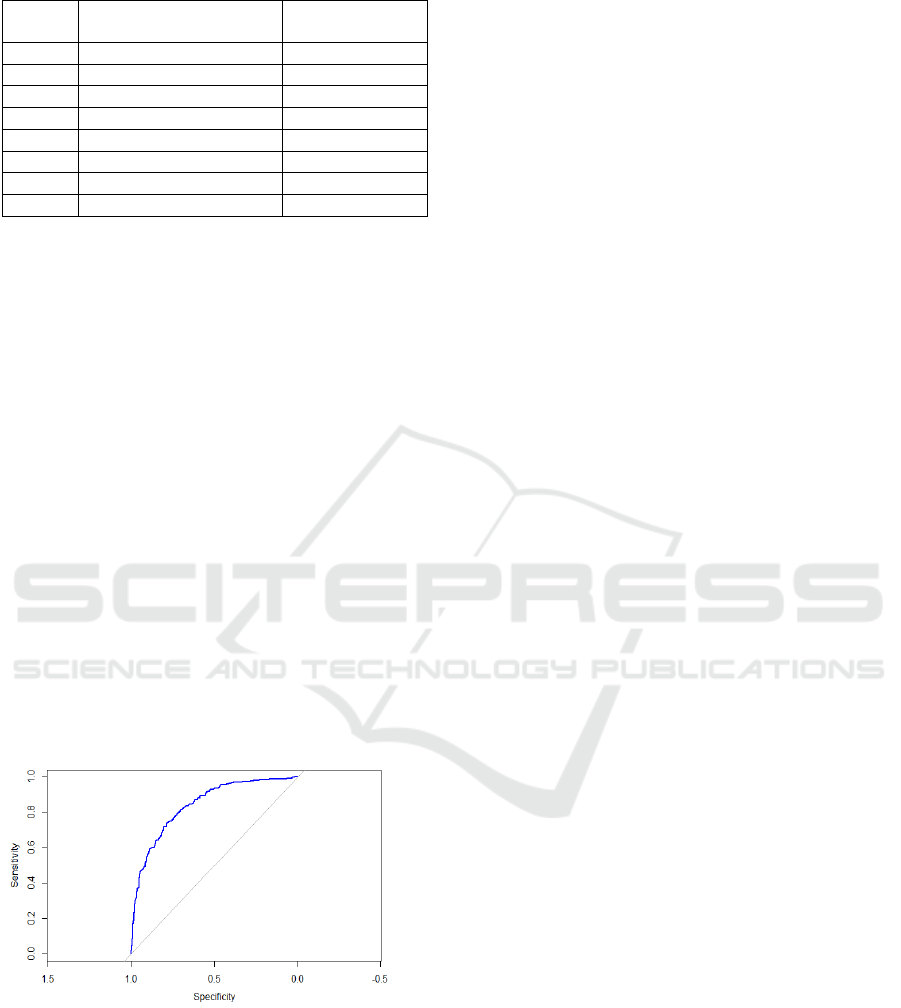
Table 3: RF Feature Importance
Feature
Mean Decrease
Accurac
y
Mean Decrease
Gini
gluc 42.54 69.6
b
mi 22.95 43.46
a
g
e 12.57 29.03
dia
_p
9.52 29.52
p
re
g
8.21 17.99
b
ldp 1.77 21.52
skin 3.78 16.1
insu 3.76 15.75
The RF model demonstrates that glucose and BMI,
along with age act as the prime predictors of disease
status because these variables match medical
consensus. The established models underline the
value of glucose measurements and Body Mass Index
tests for predicting diabetes outcomes, although they
exhibit various approaches in managing age detection
and pregnancy status.
Both models include skin and insulin as
predictors, which do not substantially influence the
prediction of diabetes status. The confusion matrix
showed the model successfully identified most non-
diabetic cases, but demonstrated poor accuracy in
detecting diabetes patients by mistakenly identifying
some diabetic patients as non-diabetic.
To further evaluate model performance, the ROC
curve was plotted, and the AUC reached 0.831
(Figure 3). This suggests that the RF model had
strong discriminatory power, indicating considered
indicative of good classification performance. The
curve demonstrates that the model performs
significantly better than random guessing, which
means that the model performs effectively.
Figure 3: ROC Curve of RF (Photo/Picture credit:
Original).
LR is particularly advantageous in binary
classification tasks like diabetes prediction due to its
probabilistic interpretation and inherent
interpretability. By modeling the log-odds of diabetes
occurrence, it provides clinicians with a
straightforward metric—for instance, a 1.5-fold
increase in odds per 10 mg/dL rise in glucose levels
(OR=1.5, p<0.01)—to quantify risk thresholds for
intervention. This aligns with clinical workflows
where actionable thresholds (e.g., HbA1c ≥6.5%)
guide diagnoses. Furthermore, its coefficients
directly inform evidence-based guidelines; for
example, public health campaigns could prioritize
BMI reduction if the model identifies it as a high-
impact variable (OR=1.3). However, its reliance on
linearity assumptions may oversimplify interactions,
such as age-dependent glucose metabolism variations,
necessitating complementary non-linear models.
The RF model complements LR by capturing non-
linear relationships and higher-order interactions
obscured in parametric frameworks. For example, it
might reveal that the combined effect of elevated
BMI and age over 50 amplifies diabetes risk
disproportionately—a pattern LR could miss. Its
ensemble structure, leveraging bootstrap aggregation
and feature randomness, also mitigates overfitting,
enhancing robustness in noisy clinical data. By
ranking variables via mean decrease in Gini impurity,
it identifies context-dependent predictors, such as
pregnancy-triggered insulin resistance in specific
BMI subgroups. While less interpretable than LR, its
ability to model complex dependencies (e.g., time-
varying glucose-insulin dynamics) offers nuanced
insights for personalized prevention strategies,
bridging gaps in traditional statistical approaches.
4 DISCUSSION
The results of this study provide valuable insights into
the predictive factors associated with diabetes and the
comparative performance of LR and RF models in
clinical risk assessment. Both models demonstrated
strong predictive capabilities, with LR achieving an
accuracy of 78.25%, slightly outperforming the RF
model (74.03%). This marginal difference may stem
from their distinct methodological frameworks: LR,
as a parametric model, excels in capturing linear
relationships between variables, while RF, a non-
parametric ensemble method, prioritizes complex
interactions and non-linear patterns. Despite this
divergence, both models consistently identified
glucose level and BMI as the most critical predictors
of diabetes.
This aligns with established clinical knowledge,
as elevated glucose levels directly reflect impaired
insulin function, while higher BMI values correlate
with visceral adiposity and metabolic dysfunction,
both hallmarks of diabetes pathophysiology.
Divergent interpretations emerged for age and
Diabetes Risk Assessment: A Logistic Regression Modelling Study Based on Large-Scale Data
467

pregnancy history. LR assigned these variables
moderate importance (e.g., age odds ratio: 1.15,
p=0.02), suggesting cumulative metabolic wear or
hormonal shifts over time. In contrast, RF
downplayed their significance, possibly because
interactions between age and other variables (e.g.,
age-specific glucose thresholds) were overshadowed
by stronger predictors like BMI. This discrepancy
underscores the importance of model selection: LR’s
interpretability aids hypothesis testing (e.g., age as an
independent risk factor), while RF’s flexibility may
better reflect multifactorial risk profiles in
heterogeneous populations. Both models agreed on
the limited predictive value of skinfold thickness and
insulin levels. Skinfold thickness, a proxy for
subcutaneous fat, may lack specificity compared to
BMI, which encompasses visceral fat, a more direct
contributor to insulin resistance. Similarly, insulin
levels alone might fail to capture dynamic feedback
mechanisms (e.g., pancreatic β-cell compensation)
critical in early diabetes stages. These findings
suggest that simplified biomarkers (glucose, BMI)
hold greater utility in screening protocols compared
to niche measurements. The complementary strengths
of LR and RF advocate for their combined use in
clinical practice. For instance, LR could prioritize
high-risk patients based on glucose/BMI thresholds,
while RF might refine predictions by incorporating
subtle interaction effects (e.g., age-adjusted BMI
thresholds). Such integration could enhance
personalized prevention strategies, enabling early
interventions like lifestyle modifications or targeted
glucose monitoring. Future studies should validate
these models across diverse populations and explore
hybrid algorithms to balance interpretability and
predictive power (Zimmet et al., 2014).
5 CONCLUSION
The findings of this study, while insightful, are
inherently constrained by the demographic
homogeneity of the dataset. All observations were
derived exclusively from female Pima Indians aged
21 and older, a population with a well-documented
genetic predisposition to metabolic disorders. While
this homogeneity reduces confounding variables, it
severely limits the generalizability of the models. For
instance, biological differences across gender and
racial/ethnic variations in diabetes risk factors may
render the current models inapplicable to broader
populations. Future research must prioritize
ethnically diverse cohorts—including Asian, African,
and European ancestries—and balanced gender
representation to validate and refine these predictive
frameworks. Methodologically, advancements could
be achieved through feature engineering, ensemble
techniques, or deep learning architectures.
Additionally, addressing the dataset’s class
imbalance—a common issue in medical datasets
where non-diabetic cases dominate—using
techniques like SMOTE or cost-sensitive learning
could reduce prediction bias. Integrating real-world
clinical variables, such as dietary habits, physical
activity metrics, and polygenic risk scores, would
further bridge the gap between algorithmic
predictions and clinical utility. For example, wearable
device data could dynamically update risk
assessments based on lifestyle changes. Finally,
ethical considerations around data privacy and model
transparency must accompany technical
improvements. By adopting these strategies, future
studies can develop robust, equitable tools for
diabetes prevention, ultimately supporting
personalized healthcare interventions across diverse
global populations.
ACKNOWLEDGEMENTS
All the authors contributed equally and their names
were listed in alphabetical order.
REFERENCES
Carlsson, S., Hammar, N., & Grill, V., 2005. Alcohol
consumption and type 2 diabetes: Meta-analysis of
epidemiological studies indicates a U-shaped
relationship. Diabetologia, 48, 1051–1054.
De Luis, D. A., Fernandez, N., Arranz, M. L., Aller, R.,
Izaola, O., & Romero, E., 2005. Total homocysteine
levels relation with chronic complications of diabetes,
body composition, and other cardiovascular risk factors
in a population of patients with diabetes mellitus type 2.
Journal of Diabetes and its Complications, 19(1), 42–
46.
Dehghan, A., Kardys, I., de Maat, M. P., Uitterlinden, A.
G., Sijbrands, E. J., Bootsma, A. H., ... & Witteman, J.
C., 2007. Genetic variation, C-reactive protein levels,
and incidence of diabetes. Diabetes, 56(3), 872–878.
Deshpande, A. D., Harris-Hayes, M., & Schootman, M.,
2008. Epidemiology of diabetes and diabetes-related
complications. Physical Therapy, 88(11), 1254–1264.
Gale, E. A., & Gillespie, K. M., 2001. Diabetes and gender.
Diabetologia, 44, 3–15.
Gulati, S., & Misra, A., 2014. Sugar intake, obesity, and
diabetes in India. Nutrients, 6(12), 5955–5974.
Kaggle Datasets, n.d. Pima Indians Diabetes Database.
Available at:
IAMPA 2025 - The International Conference on Innovations in Applied Mathematics, Physics, and Astronomy
468

https://www.kaggle.com/datasets/uciml/pima-indians-
diabetes-database
Roglic, G., 2016. WHO Global report on diabetes: A
summary. International Journal of Noncommunicable
Diseases, 1(1), 3–8.
Tirosh, A., Shai, I., Bitzur, R., Kochba, I., Tekes-Manova,
D., Israeli, E., ... & Rudich, A., 2008. Changes in
triglyceride levels over time and risk of type 2 diabetes
in young men. Diabetes Care, 31(10), 2032–2037.
Zimmet, P. Z., Magliano, D. J., Herman, W. H., & Shaw, J.
E., 2014. Diabetes: A 21st century challenge. The
Lancet Diabetes & Endocrinology, 2(1), 56–64.
Diabetes Risk Assessment: A Logistic Regression Modelling Study Based on Large-Scale Data
469
