
Research on Sales Forecasting of New Energy Vehicles Based on
Interbrand and SARIMA-BP Neural Network
Ruiqi Luo
a
School of Science, Minzu University of China, Beijing, China
Keywords: New Energy Vehicle Sales, Interbrand Model, SARIMA-BP Neural Network, Brand Influence, Sales
Forecasting Model.
Abstract: With the rapid development of the new energy vehicle market, accurate sales forecasting is crucial for industry
decision-making. This study proposes a forecasting method that combines the Interbrand model with the
Seasonal Autoregressive Integrated Moving Average - Back Propagation Neural Network (SARIMA-BP
neural network) to quantify brand influence and improve forecasting accuracy. Firstly, based on the improved
Interbrand model, the brand value of new energy vehicles is quantified from financial dimensions (new energy
business revenue, average vehicle price) and brand strength (segment market share, R&D investment, search
index) to solve the problem of data separation difficulties in traditional models. Secondly, a SARIMA-BP
neural network fusion model is constructed. SARIMA is used to process the linear and seasonal characteristics
of the sales time series, and the BP neural network is used to fit the nonlinear part, and brand influence is
introduced as the key independent variable. The empirical analysis uses 48 sets of monthly data from BYD,
Tesla, Li Auto, and NIO from 2021 to 2024 as samples. The results show that the fusion model is significantly
better than the single SARIMA model and the combined model that does not incorporate brand value in terms
of Root Mean Squared Error (RMSE) and Mean Absolute Percentage Error (MAPE), verifying the key role
of brand influence in sales forecasting. This research provides a new method for forecasting new energy
vehicle sales that takes into account both brand effects and data characteristics, and has reference value for
corporate market strategy formulation.
1 INTRODUCTION
As an important pillar of the national economy, the
automobile industry not only directly drives the
development of upstream and downstream industrial
chains but also profoundly affects the decision-
making of consumers, enterprises, and governments.
In recent years, with the development and progress of
new energy vehicle technology, the sales of new
energy vehicles have steadily increased year by year.
How to accurately predict the sales of new energy
vehicles based on market demand has become a
research hotspot (Chen 2011; Fan, 2017). At present,
the prediction methods applied to automobile sales
are mainly divided into two categories. The first
category is single model prediction, such as Back
Propagation Neural Network (BP neural network),
Seasonal Autoregressive Integrated Moving Average
a
https://orcid.org/0009-0009-9825-3252
(SARIMA) method, grey model, etc. For example, Xu
et al. (2021) used the Convolutional Neural Network
(CNN) to construct a stock trend prediction model and
obtained relatively accurate results. Xu et al. (2021)
completed the prediction of surface water quality
based on a BP neural network. Zhang et al. (2011)
used the SARIMA model to extract the monthly
frequency fluctuation characteristics in inflation,
effectively reducing the prediction error. The second
category is prediction based on fusion models, such
as the fusion of neural network and particle swarm
algorithm, the fusion of principal component analysis
and neural network, etc. For example, Zhao et al.
(2016) proposed a Seasonal Autoregressive
Integrated Moving Average - Group Method of Data
Handling (SARIMA-GMDH) combined
forecasting method to forecast the Consumer Price
Index (CPI) monthly series, effectively combining
Luo, R.
Research on Sales Forecasting of New Energy Vehicles Based on Interbrand and SARIMA-BP Neural Network.
DOI: 10.5220/0013826600004708
Paper published under CC license (CC BY-NC-ND 4.0)
In Proceedings of the 2nd International Conference on Innovations in Applied Mathematics, Physics, and Astronomy (IAMPA 2025), pages 397-401
ISBN: 978-989-758-774-0
Proceedings Copyright © 2025 by SCITEPRESS – Science and Technology Publications, Lda.
397
two single models with complementary advantages to
improve the forecasting accuracy. In general, a single
method has certain limitations in its adaptability to
data, while the fusion model has significant
advantages in matching degree and prediction
accuracy. Taking Seasonal Autoregressive Integrated
Moving Average - Back Propagation Neural Network
(SARIMA-BP) as an example, a single SARIMA
only processes the linear part of the time series data.
For its residual part, the BP neural network can be
used for learning and fitting to achieve the fitting of
the nonlinear part, ultimately improving the
prediction accuracy.
In addition, the quantification of automobile brand
influence is also a focus of this study. In 1974, John
Murphy developed an evaluation method, the
Interbrand Model. The brand excess return method
proposed by Li et al. (2016) optimizes the Interbrand
model. Based on this optimization method, this study
applies the Interbrand model to the quantitative study
of the brand influence of new energy vehicles and
regards brand influence as an important factor in
predicting the sales of new energy vehicles (Pi, Zhao
& Pen, 2016).
The forecast of new energy vehicle sales includes
both cyclical and seasonal related data and non-linear
related data. Therefore, this study adopts the
prediction method of the SARIMA-BP neural
network and takes into account the brand influence
obtained by using the Interbrand model. Based on
existing literature and research, this study will explore
in depth the factors that influence car prices and focus
on analyzing how to quantify the key factor of brand
influence, aiming to provide new ideas for new
energy vehicle sales forecasts and speculate on its
possible market trends.
2 METHODS
2.1 Data Source
This study takes the four major new energy vehicle
brands BYD, Tesla, Li Auto, and NIO as the research
objects, and collects data on the number of
automobile sales, average sales price, and market
share of each brand in each month from 2021 to 2024
from automobile data websites such as Autohome and
Autohome (Li et al., 2021). At the same time, this
study collects the revenue data of new energy
business and Research and Development Investment
(R&D investment) data of each automaker in its
annual financial reports and news reports, and collects
its search index for each month. In addition, this study
collects the consumer price index (CPI) for each
month from 2021 to 2024 and takes it into account.
The missing data are interpolated using the
interpolation method to obtain a complete data set of
48 months from 2021 to 2024.
2.2 Indicator Selection and Description
According to the Interbrand brand influence
quantification method and the SARIMA-BP neural
network prediction model used in this study, the
modeling indicators are selected as shown in Tables 1
and 2.
Table 1: Interbrand brand influence data
Data t
yp
es Indicator name
Financial
dimensions
New ener
gy
business revenue
Average price of vehicle models
Brand dimension
Market share by segment
R&D Investment
Search Index
Table 2: SARIMA-BP neural network sales forecast data
Data t
y
pes Core indicators
Dependent variable Brand sales
Independent
variable
Brand influence
(quantitative)
Avera
g
e sales price
CPI Index
Polic
y
subsid
y
2.3 Brand Influence Quantification
Method (Interbrand Model)
The traditional Interbrand model first predicts the
brand's future excess returns and discounts the excess
returns using the brand return index. It then quantifies
the brand strength score through brand strength factor
analysis and uses the S-curve function to derive the
brand multiplier.
𝐵𝑟𝑎𝑛𝑑 𝑣𝑎𝑙𝑢𝑒 = 𝑏𝑟𝑎𝑛𝑑 𝑟𝑒𝑣𝑒𝑛𝑢𝑒 ×
𝑏𝑟𝑎𝑛𝑑 𝑚𝑢𝑙𝑡𝑖𝑝𝑙𝑖𝑒𝑟;
𝐵𝑟𝑎𝑛𝑑 𝑏𝑒𝑛𝑒𝑓𝑖𝑡𝑠 = 𝑐𝑜𝑟𝑝𝑜𝑟𝑎𝑡𝑒 𝑏𝑒𝑛𝑒𝑓𝑖𝑡𝑠,×
𝑏𝑟𝑎𝑛𝑑 𝑏𝑒𝑛𝑒𝑓𝑖𝑡𝑠 𝑖𝑛𝑑𝑒𝑥. (1)
The improved Interbrand model takes company
brands as the evaluation object and follows the
principle of a small amount of data and easy access in
data selection, which solves the problem of difficulty
in separating product brand benefits. The excess
pricing method is used to calculate the brand's excess
return. The difference between the after-tax profit and
the industry average in the past three years is
multiplied by the sales revenue, and an adjustment
IAMPA 2025 - The International Conference on Innovations in Applied Mathematics, Physics, and Astronomy
398

coefficient 𝛿 (composed of the brand management
factor M and the system risk factor R) is introduced
to reduce the uncertainty of future return forecasts. In
constructing the brand multiplier, this study
comprehensively evaluate brand strength from the
perspective of the enterprise (factors such as brand
history, status, and trends, with differentiated weights
set according to brand type) and the consumer
(indicators such as brand awareness, loyalty, and
quality perception, using fuzzy evaluation methods),
and calculate the brand multiplier using Interbrand's
S-curve function relationship. The improved
Interbrand model has the advantages of scientific and
reasonable data selection, strong targeted evaluation
objects, comprehensive multi-perspective factors, and
high credibility of evaluation results, which can more
effectively reflect the true value of the brand.
According to Interbrand's brand value evaluation
formula, combined with new energy vehicle
enterprise data, brand benefits and excess benefits are
calculated. The brand contribution index is calculated
through the search index (a brand search
index/industry's highest search index), and multiplied
by the quarterly revenue to get the brand's direct
benefits:
𝐵𝑟𝑎𝑛𝑑 𝑟𝑒𝑣𝑒𝑛𝑢𝑒 = 𝑟𝑒𝑣𝑒𝑛𝑢𝑒×
(2)
Excess profit is calculated based on the difference
between brand profit margin and industry average
profit margin, and corrected by adjustment coefficient
δ (combining R&D investment stability and market
share fluctuations):
𝐸𝑥𝑐𝑒𝑠𝑠 𝑟𝑒𝑡𝑢𝑟𝑛 = (𝑏𝑟𝑎𝑛𝑑 𝑝𝑟𝑜𝑓𝑖𝑡 𝑚𝑎𝑟𝑔𝑖𝑛 −
12%) × 𝑞𝑢𝑎𝑟𝑡𝑒𝑟𝑙𝑦 𝑟𝑒𝑣𝑒𝑛𝑢𝑒 × 𝛿 (3)
Where,
𝛿=0.6 × 𝑅&𝐷 𝑖𝑛𝑣𝑒𝑠𝑡𝑚𝑒𝑛𝑡 𝑠𝑡𝑎𝑏𝑖𝑙𝑖𝑡𝑦 +
0.4 × 𝑚𝑎𝑟𝑘𝑒𝑡 𝑠ℎ𝑎𝑟𝑒 𝑠𝑡𝑎𝑏𝑖𝑙𝑖𝑡𝑦. (4)
The brand strength score (0-100 points) is
converted into a brand multiplier (reflecting future
earnings risk) through Interbrand's classic S-curve
function:
𝐵𝑟𝑎𝑛𝑑 𝑀𝑢𝑙𝑡𝑖𝑝𝑙𝑖𝑒𝑟=
√
2𝐼
(𝐼≤50)
10 +
√
2𝐼− 100
(
𝐼>50
)
(5)
Final brand value = excess return × brand
multiplier.
A quantitative analysis of new energy vehicle
brands from 2021Q1 to 2024Q4 based on the
Interbrand model shows that Tesla and BYD have
long been leading in brand value (US$28.178 billion
and US$10.488 billion in 2024Q4, respectively)
thanks to their high search index, significant market
share (BYD's average is 34.6%) and R&D investment
(BYD's average annual investment is 11.56 billion
yuan and Tesla's is 7.51 billion yuan). Among them,
Tesla's technology premium and BYD's scale
advantage are the core driving factors; Li Auto
achieved growth through precise positioning (brand
value of US$6.782 billion in 2023Q4), while NIO
performed relatively weakly due to insufficient
market share and limited R&D, and its profit margins
in some quarters were lower than the industry average
(Gui et al., 2021).
2.4 SARIMA-BP Neural Network
Prediction Model
Model principle: Decompose the automobile sales
time series into the linear part 𝐿
and the nonlinear
part 𝑆
, respectively adopt the SARIMA model and
BP neural network to model, and the final prediction
value is the sum of the prediction results of the two
parts 𝑋
=𝐿
+𝑆
.
The SARIMA model is used to deal with the linear
characteristics and seasonal fluctuations of time
series. The non-stationary series is converted into a
stationary series through seasonal differences, and the
model order is determined using the AIC or SBC
method. After completing parameter estimation and
significance testing, the linear part 𝐿
is fitted and
predicted.
The BP neural network model takes the
influencing factors (CPI index, average price, brand
value, new energy policy subsidies) as the input layer
for the nonlinear characteristics of the time series, and
realizes the modeling and prediction of the nonlinear
part 𝑆
through the nonlinear transformation of the
hidden layer and the gradient descent weight
adjustment of the output layer. The method evaluates
the performance through the Root Mean Squared
Error (RMSE) and Mean Absolute Percentage Error
(MAPE).
First, use the Augmented Dickey-Fuller (ADF)
test to test the stationarity of the original time series.
If the original series is non-stationary, perform first-
order differences on the series until the series reaches
a stationary state. During the difference process,
record the order d of the non-seasonal difference, but
to avoid excessive difference, limit the maximum
value of d to 2. For the series after non-seasonal
difference, check whether its seasonal part (with a
period of 12 months) is stationary. If not, perform
seasonal difference, record the order D of the seasonal
difference, and limit the maximum value of D to 1.
The non-random fluctuation series of new energy
vehicle sales volume is converted into a stationary
series using differential operation to obtain trend
Research on Sales Forecasting of New Energy Vehicles Based on Interbrand and SARIMA-BP Neural Network
399
information and related cycle information. The end
range of the SARIMA model is determined, and the
optimal model order is determined by the Akaike
Information Criterion (AIC). The optimal modeling
parameters of each car company are shown in Table 3.
Table 3: SARIMA model parameters for different car
companies
Car companies SARIMA parameters (p,d,q)
(P,D,Q)
s
BYD (0,1,2)(0,0,2)
12
Tesla
(
0,1,0
)(
0,1,2
)
12
Li Auto
(
0,1,2
)(
0,0,2
)
12
NIO (0,1,2)(0,0,2)
12
In order to build a new energy vehicle sales
forecasting model, this study combines SARIMA
residuals to build a BP neural network model. The
residuals between the fitted values and the true values
of the SARIMA model are calculated. These residuals
contain nonlinear information in the time series that
cannot be captured by the SARIMA model and can be
used as input data for the BP neural network.
The network structure is set to have 4 input layer
nodes, corresponding to 4 features; the hidden layer
contains two layers, 32 nodes (activation function is
Rectified Linear Unit (ReLU)) and 16 nodes
(activation function is ReLU), and a Dropout layer
(deactivation rate 0.2) is added after the first hidden
layer to prevent overfitting; the output layer has 1
node, matching the sales prediction target.
When compiling the model, the Adam optimizer
is selected, and the loss function is the mean square
error function. During the training process, the early
stopping callback (EarlyStopping) is set to monitor
the validation loss, and the patience value is 10; the
training rounds (epochs) are 200, the batch size
(batch_size) is 8, and the validation set ratio is 0.2.
Finally, the residual of the SARIMA model is learned
by training the BP neural network to achieve residual
prediction, thereby optimizing the overall sales
forecast results (Wang et al., 2021).
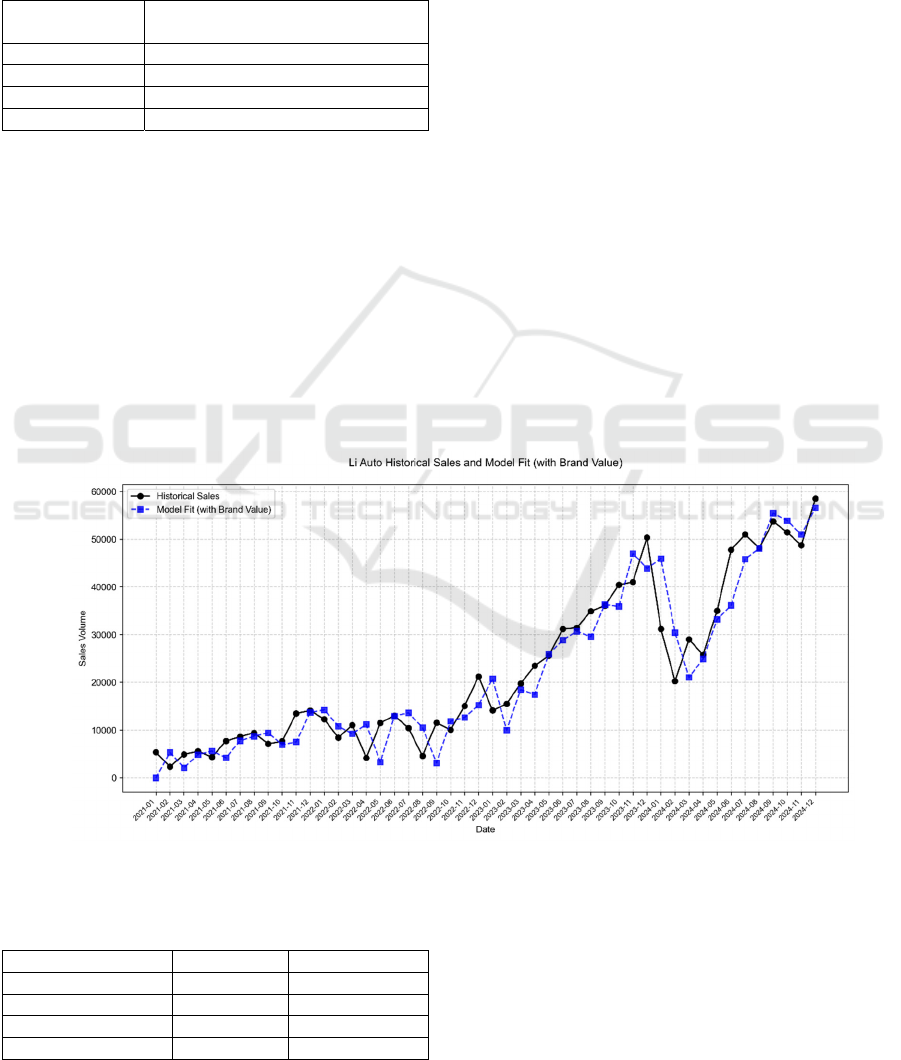
3 EXPERIMENTAL RESULTS
3.1 Model Comparison and Result
Analysis
The monthly sales volume of new energy vehicles
from 2021 to 2024 constitutes a time series, with a
total of 48 groups of experimental samples. Based on
Interbrand's quantitative brand influence and the
SARIMA-BP neural network model, simulation
prediction is performed. The prediction results of
each brand are shown in Figure 1 and Table 4.
Figure 1: Li Auto car sales fitting forecast (Photo/Picture credit: Original).
Table 4: Prediction performance of each automaker based
on SARIMA-BP neural network model.
Car companies RMSE MAPE
BYD 3458.19 0.08
Tesla 3462.32 0.09
Li Auto 1108.19 0.07
NIO 1837.49 0.11
In order to further verify the superiority of using
the SARIMA-BP neural network model based on
Interbrand to quantify brand influence, the study
compared the accuracy indicators of the SARIMA
model and the combined model, as well as the
accuracy indicators of the combined model using
brand value and the combined model not using brand
IAMPA 2025 - The International Conference on Innovations in Applied Mathematics, Physics, and Astronomy
400

value, as shown in Table 5. Taking BYD as an
example, the RMSE and MAPE values of the
SARIMA-BP model based on brand value data are
3458.19 and 0.08 respectively, while the RMSE and
MAPE values of the SARIMA-BP model without
brand value data are 7932.81 and 0.17 respectively.
This shows that the brand quantitative influence
model based on Interbrand has a significant effect on
improving prediction accuracy. At the same time, the
MSE and MAPE values of the SARIMA model are
6527.61 and 0.14 respectively, indicating that the
SARIMA-BP model has improved the model fitting
effect and prediction effect by fitting the nonlinear
part of the residual of the SRAIMA model. The
superiority of the SARIMA-BP neural network model
based on Interbrand's quantitative brand influence in
this study is demonstrated (Yang, 2021).
Table 5: Comparison of model errors (taking BYD as an
example).
Model RMSE MAPE
SARIMA-BP (using brand value
data
)
3458.19 0.08
SARIMA-BP (brand value data not
used)
7932.81 0.17
SARIMA 6527.61 0.14
3.2 Improvement Plan
The shortcomings of this study are mainly reflected in
data collection and model tuning (Marco et al., 2012).
In terms of data collection, the acquisition of
automobile company financial report data is not
direct, and the problem of inaccurate data is common,
which makes it difficult for the improved Interbrand
brand value model to simulate real data and there are
errors in the calculation of brand value data; the
shortcomings of model tuning are mainly reflected in
the degree of adaptation of the BP neural network
model to the data. In addition, further research can be
supplemented in terms of factors such as new energy
policy subsidies mentioned by Liu (2021), and the
model explanatory variables can be added to improve
the model fitting accuracy (Hülsmann et al., 2012).
4 CONCLUSION
In the prediction of automobile sales, automobile
brand influence plays a vital role in sales. This paper
quantifies the brand influence of new energy vehicles
through the improved Interbrand method, and
integrates it into the SARIMA-BP neural network
model. This method is used to model and predict the
sales time series data of new energy vehicles, which
improves the accuracy of new energy vehicle sales
prediction. Compared with the standard SARIMA and
sales prediction models that do not consider brand
influence data, the model proposed in this study based
on Interbrand quantification of brand influence and
the use of SARIMA-BP neural network model
performs well in RMSE and MAPE indicators. It
provides new ideas for the quantification of
automobile brand influence and sales prediction.
REFERENCES
Chen, D., 2011. Chinese automobile demand prediction
based on ARIMA model. In International Conference
on Biomedical Engineering & Informatics. IEEE.
Fan, Q., 2017. Research on automobile sales forecast based
on SARIMA-BP neural network method. China
Business Review, (22), 3.
Gui, S., Sun, W., & Xu, X., 2021. Automobile sales forecast
analysis based on ARIMA and linear regression
combined model. Computer and Digital Engineering.
Hülsmann, M., Borscheid, D., Friedrich, C. M., 2012.
General sales forecast models for automobile markets
and their analysis. Ibai Publishing, 5(5), 65–86.
Li, J., & Wang, F., 2016. Research on the quantitative
evaluation model of brand value in China based on
Interbrand. Science and Management, 18(1), 5.
Li, N., Zhou, X., Zhang, H., & Deng, S., 2021. Research on
the quantitative evaluation of brand value of
geographical indication agricultural products based on
Interbrand: Taking Zhashui wood ear as an example.
Hubei Agricultural Sciences, 60(10), 156–161.
Liu, Y., Wang, M., & Wang, J., 2021. Research on China's
new energy vehicle market forecast. China Automotive
Industry Review, (2016-4), 86–91.
Marco, H., Borscheid, D., Friedrich, C. M., 2012. General
sales forecast models for automobile markets and their
analysis. Ibai Publishing, 5(5), 65–86.
Pi, J., Zhao, Q., & Peng, J., 2016. CPI combined prediction
model based on SARIMA-GMDH. Statistics and
Decision, (17), 4.、
Wang, J., Chen, L., Gong, Y., Zheng, Y., Xu, J., & Du, Y., et
al., 2021. A method and device for predicting surface
water quality indicators based on graph neural network.
Journal of Zhejiang University: Engineering Edition,
55(4), 7.
Xu, Y., Wang, Z., & Wu, Z., 2021. A stock trend prediction
model based on CNN-BiLSTM multi-feature fusion.
Modern Library and Information Technology, (007),
005.
Yang, D., 2021. New energy vehicle sales forecast based on
improved BP neural network. Automation and
Instrumentation, (011), 000.
Zhang, J., 2011. Application of SARIMA model in
predicting China's CPI. Statistics and Decision, (5), 3.
Research on Sales Forecasting of New Energy Vehicles Based on Interbrand and SARIMA-BP Neural Network
401
