
Forecasting the Electric Vehicle Market Based on Multiple Linear
Regression, Time Series Analysis, and DID Models
Yuchen Wu
a
School of Mathematics, Tianjin University, Tianjin, Tianjin, 300354, China
Keywords: Electric Vehicle Market, Multiple Linear Regression Model, Time Series Analysis, Difference-In-Differences
(DID) Model.
Abstract: In recent years, the electric vehicle market has seen significant growth, making the prediction of its market
prospects essential. This study analyzes the market outlook for electric vehicles, focusing on the relationship
between car prices and battery demand. A multiple linear regression model was employed to assess the impact
of these factors on car sales volume. The results show that car prices and sales are negatively correlated, while
battery demand is positively correlated with sales, highlighting key market dynamics. Additionally, time
series analysis was used to forecast Tesla's stock development, indicating a strong association between stock
price fluctuations and market trends. Using the difference-in-differences (DID) model, this paper evaluated
the effects of relevant policies on the electric car market, finding that policy incentives significantly boost
sales growth. Overall, this research offers a quantitative forecast for the electric vehicle market, validating the
influence of price and demand on sales and illustrating the interaction between market conditions and policy
factors. These insights are valuable for decision-makers and investors, suggesting a promising growth
potential for the electric car market in the future.
1 INTRODUCTION
The research on electric vehicle market outlook
forecasts has far-reaching implications for industry
participants, economic development, and
technological advancements. Electric vehicles (EVs)
significantly reduce greenhouse gas emissions and air
pollution, promoting sustainable development
(Pelegov & Chanaron, 2022). With accurate market
outlook forecasts, policymakers and businesses can
better understand the environmental impact of the
widespread adoption of EVs and effectively
formulate relevant policies and measures. Market
growth also brings new business opportunities, such
as battery manufacturing and the construction of
charging infrastructure. Forecasting market trends
can help companies and investors identify trends and
investment opportunities, optimizing resource
allocation and enhancing economic benefits.
Furthermore, the promotion of EVs is a crucial factor
in driving the energy transition, aiding the shift from
traditional energy sources to renewable energy.
a
https://orcid.org/0009-0008-6356-4504
Muhammad has revealed through the comparison
of air quality before and after the pandemic lockdown
that reducing car exhaust emissions can significantly
improve air quality (Muhammad, Long & Salman,
2020). Weng Xiaofeng also pointed out in his article
that severe smog is harming people's health, with car
exhaust emissions being a major cause of this
consequence (Weng, 2014). This emphasizes the
significant importance of developing EVs; however,
there are still many issues in the current electric
vehicle market. According to Weng Xiaofeng's
research, several key factors restricting the
development of EVs include poor battery efficiency,
high prices, lack of unified standards, and inadequate
infrastructure (Weng, 2014). It should be noted that
there is still considerable room for improvement in the
penetration rate of EVs in the global automotive
market. According to a relevant report by Caitong
Securities, in 2023, the penetration rate rose further
by 2.57% to 14.88%, indicating continued significant
growth (Automotive and Components, 2025).
Focusing on China, since 2021, the new energy
vehicle market has developed rapidly, driven by
384
Wu, Y.
Forecasting the Electric Vehicle Market Based on Multiple Linear Regression, Time Series Analysis, and DID Models.
DOI: 10.5220/0013826400004708
Paper published under CC license (CC BY-NC-ND 4.0)
In Proceedings of the 2nd International Conference on Innovations in Applied Mathematics, Physics, and Astronomy (IAMPA 2025), pages 384-390
ISBN: 978-989-758-774-0
Proceedings Copyright © 2025 by SCITEPRESS – Science and Technology Publications, Lda.

policies. In 2023, the penetration rate of new energy
passenger car sales in China rose to 33% (Automotive
and Components, 2024). However, as Ma pointed out,
the government's subsidy withdrawal mechanism also
has negative impacts. The ineffectiveness of electric
vehicle credit management, coupled with insufficient
market regulation, has led to a significant decline in
electric vehicle sales (Ma, 2022). The reasons behind
this deserve reflection. Yu Jiaxin systematically
sorted the subsidy policies for new energy vehicles in
China, and empirical analysis results showed that
after the subsidy withdrawal, the positive impact on
the promotion of the new energy passenger car market
significantly decreased. It was also found that
charging security policies can mitigate the impact of
subsidy withdrawal on the new energy vehicle market
(Yu, 2022). The development of the consumer market
cannot be separated from the main behaviors of
consumers, and advertising and brand awareness have
a significant influence on consumer decision-making.
Tesla, as an internationally renowned electric vehicle
brand, leads the entire society in the development of
EVs. Xuan Shao believes that researching brand
development has representative significance (Shao,
Wang & Yang, 2021). Coincidentally, Mangram
believes that Tesla's marketing strategy differs from
traditional methods in the automotive industry,
revealing more possibilities for interpreting the
electric vehicle market through the study of its
development history and marketing policies
(Mangram, 2012). Standage points out that urban
transportation is expected to be integrated into a
diversified system through smartphone technology,
further highlighting the promising prospects of the
electric vehicle market (Standage, 2021).
This article selects multiple linear regression
(MLR) models, time series models, and double
difference models to study the electric vehicle market,
aiming to draw relevant conclusions based on the
specific numerical results obtained from each model.
2 METHOD
2.1 Data Source
The automotive price data mentioned in this article is
sourced from the China Passenger Car Market
Information Joint Conference, covering the time span
from 2019 to 2022 on a monthly basis. It includes 8
well-known brands such as BMW and Mercedes-
Benz to showcase the potential advantages of EVs.
The data is also selected from the International
Energy Agency (IEA) and the China Automotive
Power Battery Industry Innovation Alliance to
illustrate the comparison and correlation of battery
demand between China, the United States, the
European Union, and other countries. By using
battery demand as a starting point, the prospects of the
Chinese electric vehicle market are further analyzed.
This study obtained over 2,500 stock data points
for Tesla from 2014 to 2024 from Kaggle, intending
to glimpse the electric vehicle development market by
predicting the stock market outlook (Tanmay Shukla,
2025).
Exploratory data was obtained from the National
Energy Administration and Yu Jiaxin's research to
understand the development of electric vehicle
policies in China from 2021 to 2023, thus analyzing
future market share in the Chinese automotive
market.
2.2 Indicator Selection
In this analysis, three key indicators have been
selected: car price, battery demand, and policy, as
shown in Table 1.
Table1: Indicator Description
Reasons Statistics
Car Price a crucial metric for comparing traditional
and EVs
Eight famous car brands from
2019 to 2022
Battery Demand be essential in assessing the growth
p
otential of EVs
Battery demand worldwide from
2019 to 2023
Policy plays a significant role in shaping the
electric vehicle landsca
p
e
electric vehicle policies in China
from 2021 to 2023
Price impacts the affordability and
competitiveness of traditional and EVs, affecting
consumer choices. Analyzing battery demand trends
from 2019 to 2022 reveals electric mobility's growth
potential. Additionally, examining policies in key
regions helps us understand their effects on electric
vehicle market share and future growth.
Forecasting the Electric Vehicle Market Based on Multiple Linear Regression, Time Series Analysis, and DID Models
385

2.3 Methods Introduction
2.3.1 MLR Model
This paper utilizes an MLR model to predict
fluctuations in market share between traditional and
EVs. By analyzing historical data, the model focuses
on key factors like battery demand, car prices, and
sales figures. Increased battery demand correlates
with rising electric vehicle sales, highlighting
industry trends. The framework quantifies how these
independent variables influence consumer behavior
and market dynamics, providing insights into the
electric vehicle market's sustainability and scalability,
which are essential for informing policymakers and
stakeholders of future trends.
2.3.2 Time Series Model for Tesla Stock
Prices
The stock market is vital for financial development,
with stock data acting as a time series that reveals
operational patterns. Analyzing these patterns enables
trend predictions, aiding investors in decision-making
and contributing to regional economic growth. The
ARIMA model is well-established for time series
analysis, offering accurate predictions for both
stationary and non-stationary data. This study applies
the ARIMA model to over 3,600 Tesla stock data
points from the past decade to analyze trends in the
electric vehicle market.
2.3.3 Difference-in-Differences (DID)
The DID method is used to evaluate the effects of
policy implementation by examining changes in
economic indicators before and after the policy is
enacted. This study focuses on the gradual increase of
subsidies for new energy vehicles, a national policy
affecting all cities. Using automobile sales as the
economic indicator, cities with license plate
restrictions serve as the control group, while cities
without restrictions act as the experimental group,
making the standard DID method suitable for
analysis.
This article will select the coverage rate of electric
vehicle charging stations in various cities
(coverage_rate), regional gross domestic product
(gdp), residents' savings balances (savings), and total
urban population (population) as control variables to
analyze the impact of gradually reducing subsidy
policies on the sales of new energy vehicles. The
specific model is as follows:
𝑌
=𝛼+𝛽
𝑇𝑖𝑚𝑒
+𝛽
𝑇𝑟𝑒𝑎𝑡𝑒𝑑
+𝛽
𝑑𝑖𝑑
+
𝛽
𝑍
+𝜀
(1)
In the above equation, 𝑌
represents the sales of
new energy passenger vehicles, 𝑇𝑖𝑚𝑒
is the
dummy variable for the subsidy reduction policy,
Treated is the urban dummy variable, 𝑑𝑖𝑑
is the
interaction term 𝑡𝑖𝑚𝑒 × 𝑡𝑟𝑒𝑎𝑡𝑒𝑑 , and 𝑍
represents a series of control variables. The
coefficient 𝛽
is the primary focus; when it is less
than 0, it indicates that the subsidy reduction policy
has decreased the positive impact on the market
promotion of new energy vehicles. Conversely, when
it is greater than 0, it demonstrates that the gradual
increase of subsidies has a stimulating effect on the
promotion of the new energy vehicle market.
3 RESULTS AND DISCUSSION
3.1 MLR Results
Figure 1 illustrates a price comparison between
electric vehicle brands and gasoline vehicles. From a
purchase price perspective, EVs generally cost more
than their gasoline counterparts within the same class.
This price discrepancy is largely due to the higher
costs associated with essential components such as
batteries, motors, and electronic controls in EVs.
However, government subsidies for new energy
vehicles and ongoing advancements in battery
technology are gradually reducing the prices of EVs.
Additionally, it is crucial to consider operating costs.
While EVs have a higher initial purchase cost, their
operating expenses tend to be significantly lower
compared to gasoline vehicles. This is primarily
because electricity costs are much lower than fuel
costs, and the maintenance expenses for EVs are
relatively minimal. Thus, from a cost-effectiveness
standpoint, EVs may offer advantages in the long run.
IAMPA 2025 - The International Conference on Innovations in Applied Mathematics, Physics, and Astronomy
386
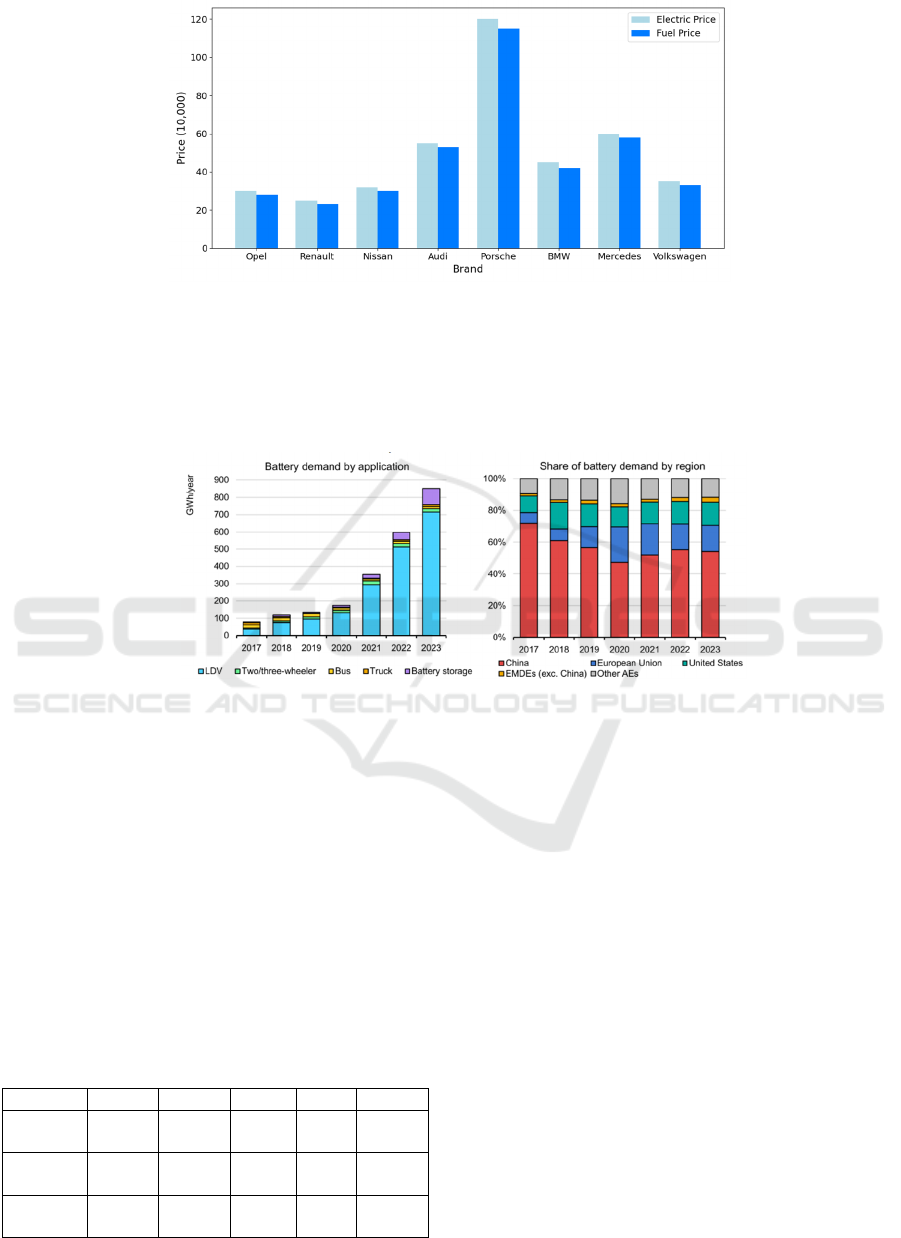
Figure 1: Comparison of Electric and Fuel Car Price (Photo/Picture credit: Original).
To predict the sustainability and scalability of
future development in the electric vehicle industry
based on trends in battery demand, this article
compiles battery demand data from multiple
countries. Three key terms are defined to clarify the
analysis. LDV means light-duty vehicle, including
cars and vans. EMDEs (esc. China) means emerging
markets and developing economies excluding China.
AEs means advanced economies.
(
a
)
Batter
y
Demand b
y
A
pp
lication
(
b
)
Share of Batter
y
Demand b
y
Re
g
ion
Figure 2: Battery Demand by Application and Region (IEA, 2024)
According to Figure 2, battery demand has surged
from 2021 to 2023, primarily fueled by the rapid
increase in electric vehicle sales. By 2023, pure EVs
accounted for approximately 90% of total battery
demand, indirectly reflecting the significant rise in
electric vehicle sales. Notably, China remains the
largest battery market, representing about 55% of
global demand in 2023, with the European Union and
the United States each comprising roughly 15%.
Given China’s substantial market share, analyzing its
electric vehicle market prospects is particularly
representative.
Table 2: MLR Results
Coef Std er
r
t P>
|
t
|
VIF
const 17190
0
18400
0
0.936 0.36
1
482.31
6
Car
Price
-1.103 1.244 -
0.887
0.38
6
1.619
Battery
Deman
d
22450 1388.5
58
16.16
9
0.00
1
1.619
Based on the analysis, this paper obtained the
results shown in Table 2. The VIF values for the
independent variables price and battery demand are
both less than 5, which indicates that there is no
significant multicollinearity issue between the two
independent variables. The coefficient for car price is
-1.1034, indicating a negative correlation between car
price and car sales. With a p-value of 0.386, the
statistical significance of this coefficient is low,
suggesting that the database chosen for this study can
be further optimized. The coefficient for battery
demand is approximately 22450, indicating a
significant positive impact of battery demand on sales
volume. The p-value for this coefficient is 0.001,
indicating very high significance. The R-squared
value of the model is 0.96, indicating that the model
performs well in explaining.
The results of this model clearly indicate that there
is a negative correlation between car prices and
automobile sales, while demand for car batteries
shows a significant positive correlation with sales.
Forecasting the Electric Vehicle Market Based on Multiple Linear Regression, Time Series Analysis, and DID Models
387

This suggests that increasing battery demand will
promote growth in automobile sales, whereas
excessively high car prices may suppress sales. To
boost car sales, manufacturers should consider
lowering car prices and enhancing battery demand
when formulating market strategies, optimizing
product mix, and pricing strategies to achieve
improved sales performance.
3.2 ARIMA Results
Table 3: ADF Test on the Original Sequence Results
Statistics Significance
Level
(
%
)
t P
ADF - -1.334 0.061
1 -3.433 -
Critical
Value
5
10
-2.863
-2.567
-
-
Next, this research will further explore this issue from
the perspective of car prices. This study takes Tesla, a
representative brand in the electric vehicle market, as
an example and derives conclusions by examining its
stock performance (Table 3).
The results obtained from the ADF test indicate
that Tesla's stock data is not stationary. Therefore, the
research considers applying differencing to the data in
an attempt to make it a stationary series. The results
after first-order differencing are shown in Table 4.
Table 4: ADF Test on the Original Sequence Results
Statistics
Significance
Level (%)
t P
ADF
- -10.248 0.000
1 -3.433 -
Critical
Value
5
10
-2.863
-2.567
-
-
After this, the researcher conducts order selection
for the ARIMA model by plotting the ACF and PACF
graphs to make judgments. It is determined that the
values of p and q are 5 or 6. After conducting the AIC,
BIC, and HQ values as well as white noise tests, this
research chooses ARIMA (6, 1, 5) as the testing
model, and the results are shown in Table 6.
Table 5: ARIMA model AIC, SC, and HQ test values
Model AIC BIC HQ lb_pvalue MSE RMSE
ARIMA
(
6,1,5
)
15913.265 15983.225 15938.656 0.331 54.059 7.353
ARIMA
(
5,1,6
)
15926.170 15996.130 15951.561 0.000 - -
From the last two columns of Table 5, it can be
seen that the MSE of ARIMA(6, 1, 5) is 54.059, and
the RMSE is 7.353, indicating that the average
prediction error for forecasting 180 data points is
approximately 7.35 units. Considering that the dataset
in this paper is based on over 2,500 stock data points
from the past decade, the variation range of actual
values is quite large, and an RMSE of 7.35 is
relatively acceptable. This also indicates that over the
past decade, Tesla's stock price has steadily risen, the
electric vehicle market has become increasingly
popular among the public, and more and more people
are choosing to buy Tesla as their means of
transportation.
3.3 DID Results
Table 6: DID Results
Variables Model 1 Model 2 Model 3 Model 4
did
2.145
∗∗
-0.172
4.243
∗∗∗
2.573
∗∗
treated
8.476
∗∗∗
-2.745
∗∗
8.856
∗∗∗
-4.015
∗∗∗
time 2.145
∗∗
-0.172 4.243
∗∗∗
2.573
∗∗
coverage_rate - 3.512
∗∗∗
-4.748
∗∗∗
g
dp - 0.725 - 0.339
savin
g
s - 0.763 - 0.952
population - 1.302 -
4.037
∗∗∗
R2 0.173 0.759 0.180 0.703
Note: * indicates significance at the 10% level, ** indicates significance at the 5% level, and *** indicates
significance at the 1% level.
Based on theoretical analysis and data processing
of the new energy vehicle market, this paper selects
the sales data of urban new energy passenger vehicles
from January 2021 to December 2023 and conducts a
DID regression, with results shown in Table 6.
According to Table 6, Model 2 (experiment group
IAMPA 2025 - The International Conference on Innovations in Applied Mathematics, Physics, and Astronomy
388

with dependent variable) and Model 4 (control group
with dependent variable) have significantly better
fitting than Model 1 (experiment group without
dependent variable) and Model 3 (control group with
dependent variable), as the R-squared values of the
latter two are higher, indicating that adding more
independent variables enhances the model's
explanatory power. The negative coefficient for the
Treated group shows that the overall sales in the
control group are lower than in the experimental
group, suggesting that license restriction policies can
promote electric vehicle sales. In terms of
significance levels, coverage_rate shows a significant
impact in both the control and experimental groups,
indicating that as the coverage rate of charging piles
increases, vehicle sales also rise. It can be said that
increased subsidies for EVs can stimulate the
development of the electric vehicle market.
3.4 Discussion
Many areas need improvement and optimization in
this study.
Firstly, in the MLR model, the regression results
for car prices are not significant due to limitations in
the database selection. Future work could enhance the
selection of relevant data by increasing the dataset
with more car brands, expanding the database's
capacity, and simultaneously increasing the
complexity of the model to achieve more significant
metrics. This approach will help capture various
factors affecting car prices more comprehensively.
Secondly, regarding the time series model,
although the period of the selected data is relatively
long, the period for the prediction results is quite
brief. Therefore, using more advanced models (such
as decision trees) would help improve the accuracy of
long-term forecasts, providing more forward-looking
market insights.
Lastly, in the DID model, it is crucial to consider
more variable factors. For example, taking into
account the differences in economic development
levels across regions, understanding the differences in
consumer awareness levels in various regions through
surveys, and examining the proportion of households
owning gasoline and EVs can make the research
findings more meaningful on a practical level. Such
multidimensional analysis helps us gain a deeper
understanding of market dynamics, ensuring the
research's practicality and reference value.
By addressing these aspects, the overall study will
better reflect the true state of the electric vehicle
market, supporting subsequent policy
recommendations and business decisions.
4 CONCLUSION
This study concludes that car prices and battery
demand significantly influence electric vehicle sales,
with car prices exhibiting a negative correlation while
battery demand shows a positive correlation. These
findings highlight the critical roles of affordability
and technological advancements in driving market
growth within the electric vehicle sector.
The implications of this research extend to various
stakeholders, including policymakers, manufacturers,
and investors. By understanding how these factors
interact, decision-makers can formulate strategic
initiatives aimed at promoting electric vehicle
adoption, such as investment in charging
infrastructure and incentives for consumers. The
substantial impact of policy incentives on sales
growth suggests that targeted measures, such as tax
credits and rebates, could significantly accelerate
market expansion and enhance consumer interest.
Looking ahead, future research should consider
additional variables such as evolving consumer
preferences, competitive dynamics, and global market
influences to gain a more comprehensive
understanding of the electric vehicle landscape.
Furthermore, as the industry continues to evolve,
continuous monitoring of market trends and
technological innovations will be crucial for adapting
strategies to maximize growth potential. Ultimately,
this study underscores a promising future for the
electric vehicle market, shaped by the interplay of
price dynamics, advancements in battery technology,
and supportive governmental policies that facilitate a
transition toward sustainable transportation.
REFERENCES
IAM@Tanmay Shukla., 2025. Tesla Stock Data 2010–2025.
In Kaggle.
https://www.kaggle.com/datasets/iamtanmayshukla/tes
la-stocks-dataset
IEA., 2024. EV Battery Supply Chain Sustainability. In
International Energy Agency.
https://www.iea.org/reports/ev-battery-supply-chain-
sustainability
Ma, Y., 2022. Analysis of Influencing Factors and
Intervention Measures in the Electric Vehicle Market
(Master's Thesis, Northwest Normal University).
Master's thesis.
Mangram, M. E., 2012. The globalization of Tesla Motors:
A strategic marketing plan analysis. In Journal of
Strategic Marketing, 20(4), 289-312.
Muhammad, S., Long, X., & Salman, M., 2020. COVID-19
pandemic and environmental pollution: A blessing in
Forecasting the Electric Vehicle Market Based on Multiple Linear Regression, Time Series Analysis, and DID Models
389

disguise?. In Science of the Total Environment, 728,
138820.
Pelegov, D. V., & Chanaron, J. J., 2022. Electric car market
analysis using open data: Sales, volatility assessment,
and forecasting. In Sustainability, 15(1), 399.
Shao, X., Wang, Q., & Yang, H., 2021. Business Analysis
and Future Development of an Electric Vehicle
Company—Tesla.
Standage, T., 2021. The Lost History of the Electric Car—
and What It Tells Us About the Future of Transport. In
The Guardian, 3.
Weng, X., 2014. Analysis of Factors Influencing the
Development of China's Electric Vehicle Market and
Marketing Strategies. In Modern Property (Mid-month),
13(05), 22-23.
Yu, J., 2022. Statistical analysis of the impact of subsidy
policy decline on China's new energy vehicle market
(Master's Thesis, Dongbei University of Finance and
Economics). Master's thesis.
IAMPA 2025 - The International Conference on Innovations in Applied Mathematics, Physics, and Astronomy
390
