
Research on the Prediction of the Global Price of Gold
Zining Chen
a
Suzhou Foreign Language School, Suzhou, Jiangsu, 215000, China
Keywords: Prediction, Gold Price, ARIMA Model.
Abstract: Gold, as a safe-haven and value-preserving asset, has been brought to worldwide attention. However, its
price is influenced by numerous factors, making it difficult to predict and causing many investors to hesitate
about whether to invest. The Autoregressive Integrated Moving Average (ARIMA) model, a time series
model, has gained recognition and widespread adoption due to its accuracy. In this paper, the ARIMA
model is used to predict gold prices from Feb 22 to Mar 23. The findings indicate that the predicted values
also suggest further increases. The residual test confirms that the residuals of the ARIMA model's
predictions exhibit pure randomness, thereby validating the model's accuracy. This study confirms the
effectiveness of the ARIMA model in short-term gold price forecasting, yet its limitation lies in the
difficulty of predicting the multiple factors influencing gold prices. Future research may consider
incorporating additional exogenous variables and nonlinear models to enhance long-term predictive
performance.
a
https://orcid.org/0009-0007-2990-0263
1 INTRODUCTION
Gold, as a precious metal with significant economic
implications, experiences increasing annual demand
due to its properties as a hedge and a store of value.
The significant volatility and uncertainty of gold
price can be attributed to several key factors.
Initially, the supply and demand dynamics of gold
and rising interest rates can directly influence its
price (Davis & Thompson, 2018; Smith & Brown,
2021). Additionally, geopolitical instability and
rising inflation rates boost the demand for gold as a
store of value, which will lead to an increase in its
price (Johnson & Lee, 2019; Wang & Chen, 2019).
Furthermore, various technical analysis indicators
can also impact short-term fluctuations in gold
prices (Liu & Zhao, 2021).An increasing number of
investors are tending to invest in gold to get
long-term profit. Predicting gold prices can provide
valuable insights into economic cycle fluctuations
and market risk aversion, thereby guiding investors
in making rational decisions and reducing
investment risks (Chai, Zhao, Hu & Zhang, 2021).
The ARIMA model offers the following key
advantages in gold price forecasting: Gold prices
typically exhibit trend and seasonal fluctuations, and
the ARIMA model can effectively handle
non-stationary time series; Based on linear
regression and time series autocorrelation, ARIMA
has a transparent model structure with clear
interpretability and requires only historical gold
price data for modeling, reducing dependency on
external variables (Wang, 2021). Furthermore, In
Wang & Li (2018) study on gold price forecasting
for the Shanghai Gold Exchange, they demonstrated
that the ARIMA model achieved superior
performance with 68.4% directional accuracy in
five-minute high-frequency trading data,
outperforming all comparative models. This finding
substantiates the irreplaceable role of ARIMA
models in gold price prediction. This paper will
select an appropriate ARIMA model to predict gold
prices and evaluate the residuals.
2 METHODS
2.1 Data Sources
The gold price data is taken from Investing.com.
The data is the daily closing price of each ounce of
Chen, Z.
Research on the Prediction of the Global Price of Gold.
DOI: 10.5220/0013826300004708
Paper published under CC license (CC BY-NC-ND 4.0)
In Proceedings of the 2nd International Conference on Innovations in Applied Mathematics, Physics, and Astronomy (IAMPA 2025), pages 379-383
ISBN: 978-989-758-774-0
Proceedings Copyright © 2025 by SCITEPRESS – Science and Technology Publications, Lda.
379
gold calculated in US dollars. There a total of 557
data from Jan 2, 2023, to Feb 21, 2025. The gold
price data from Investing.com exhibits high
reliability as the platform directly interfaces with
authoritative exchanges and institutions while
employing cross-validation from multiple data
providers.
2.2 Variable Selection
The price of gold can be affected by many factors,
such as some big global events. Because of the
randomness of these factors, the gold price’s
fluctuation can be very frequent and substantial,
which is difficult to predict only by observing the
recent data. The data show that the recent gold
price shows an upward trend according to the figure.
However, the price also fluctuates greatly during the
period, with a maximal daily rise of 3.37% and drop
of -3.22%.
2.3 Model Selection
This article selects the Autoregressive Integrated
Moving Average (ARIMA) model, a typical type of
time series model, to analyse and predict the price.
The ARIMA model is used widely and is made up of
the autoregressive model (AR), integrated (I), and
moving average model (MA).
The AR part represents the linear relationship
between the current data and the past data, including
one or more time-delay terms to show the influence
of the current data by its coefficient. The I part is
used to deal with an unstable time series by using
differencing. The MA part represents the linear
relationship between the error term of the current
data and the past data by using a similar method as
the AR part.
The usual notation for the ARIMA model is
denoted by ARIMA(p, d, q), where p is the
autoregressive order, d is the difference order, and q
is the moving average order.
3 RESULTS AND DISCUSSIONS
3.1 Data Processing
Data used in the ARIMA model need to ensure its
stationarity and pure randomness (white noise).
Table 1: The ADF Test
Dickey-fuller Lag order p-value
-1.770 7 0.674
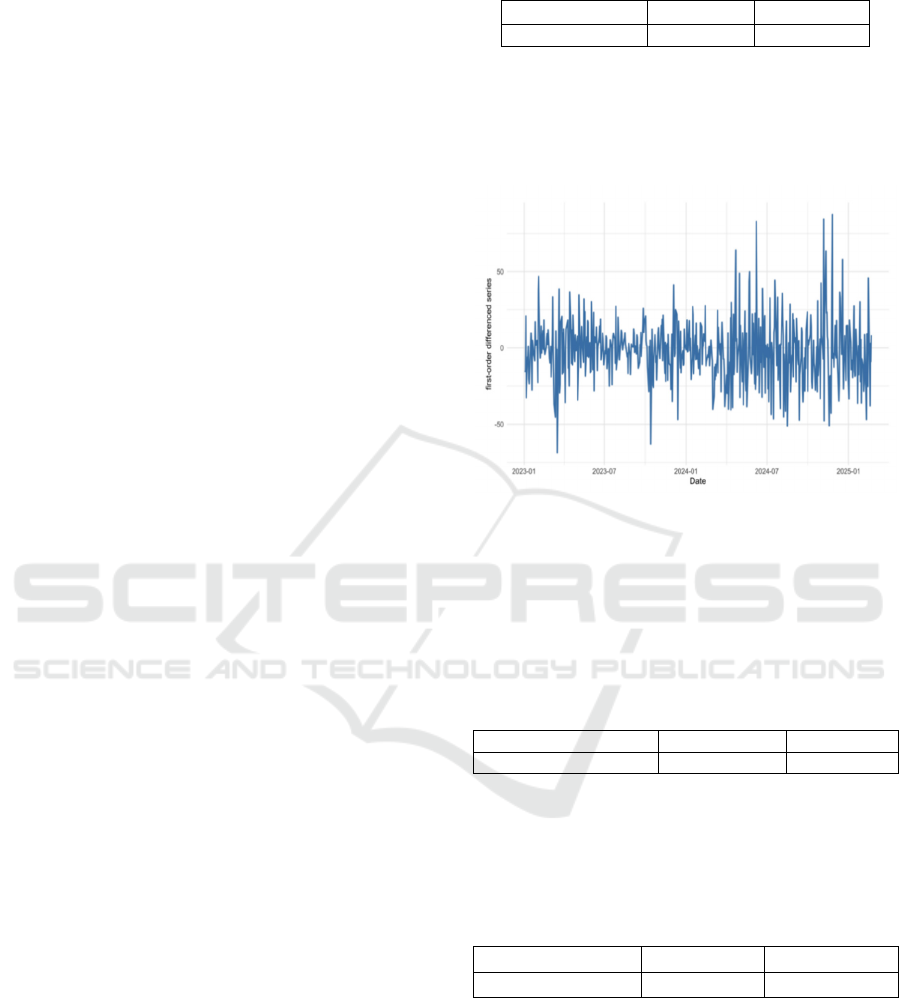
Noticed that the Table.1 shows that the p-value is
0.674 (>0.05), the paper conclude that the data isn’t
stationary. So, the paper performed first-order
differencing on it. The resulting differenced series is
presented in Figure 1.
Figure 1: First-order Differenced Series (Picture credit:
Original)
The results of the Augmented Dickey-Fuller
(ADF) test, used to examine the stationarity of the
first-order differenced series, are presented in Table
2.
Table 2: The ADF Test
Dickey-fulle
r
Lag orde
r
p
-value
-7.198 7 0.01
Since the p-value is 0.01 (<0.05), the paper
conclude that the first-order differenced series is
stationary. The results of the Ljung-Box (LB) test,
used to examine the pure randomness of the data, are
presented in Table 3.
Table 3: The Ljung-Box Test
X-squared df p-value
18.982 24 0.7529
Since the p-value is 0.7529 (>0.05), then paper
fail to reject the null hypothesis that the series is
white noise.
3.2 Model Evaluation and Selection
While using the ARIMA model to analyse and
forecast the price, the selection of the parameters is
of great significance. The ACF plot (Figure 2) and
IAMPA 2025 - The International Conference on Innovations in Applied Mathematics, Physics, and Astronomy
380
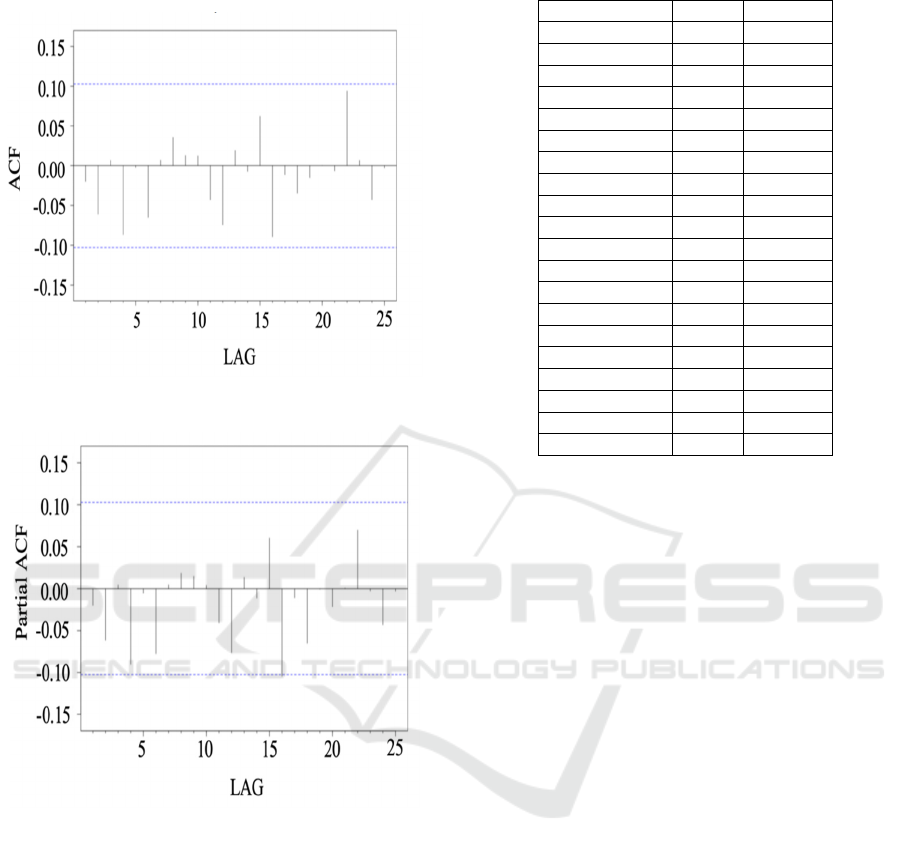
the PACF plot (Figure 3) can help to select the
parameters more accurately.
Figure 2: The ACF Plot (Picture credit: Original)
Figure 3: The PACF Plot (Picture credit: Original)
By testing ARIMA models with different
parameters, the selection of the model can be made
more accurate. In this article, the Root Mean Square
Error(RMSE) and Akaike Information
Criterion(AIC) values are used for evaluation.
RMSE measures the difference between the
predicted values and the actual values, while AIC is
used to assess the goodness of fit of the model. The
smaller these two values are, the more accurate the
model becomes. These two values together help us
select the optimal ARIMA model. The table (Table
4) below lists the RMSE and AIC values for
different ARIMA models applied to gold price data.
Table 4: ARIMA Model Evaluation
ARIMA Model RMSE AIC
(
0,1,1
)
4.3677 791.2459
(0,1,2) 4.6307 789.5815
(
0,1,3
)
4.5604 791.3864
(
0,1,4
)
4.8386 788.2144
(0,1,5) 4.8493 790.2117
(
1,1,0
)
4.3632 791.2661
(
1,1,1
)
7.7885 787.5097
(1,1,2) 4.4268 788.9579
(
1,1,3
)
4.4910 790.8374
(
1,1,4
)
4.8640 790.2081
(2,1,0) 4.5332 790.5929
(
2,1,1
)
4.4046 789.0548
(
2,1,2
)
7.8470 787.1255
(2,1,3) 7.7076 788.0462
(
3,1,0
)
4.4907 792.4458
(
3,1,1
)
4.4236 791.0303
(3,1,2) 7.7145 788.0075
(4,1,0) 4.7160 788.6824
(
4,1,1
)
4.6016 790.4662
(
5,1,0
)
4.7071 790.6794
From the table above, it can be observed that the
model (0,1,1) has the smallest values for both RMSE
and AIC. Therefore, the paper select the model
(0,1,1) as the optimal model. In the following
sections, the paper will use this model to forecast
gold prices.
3.3 Price Forecasting
This article will use ARIMA(0,1,1) to forecast the
coming 30 days’ price of gold and the prediction
data show that the price of gold is predicted to
maintain a sustained upward trend over the next
thirty days.
3.4 Residuals Checking
To ensure the accuracy of the prediction, the crucial
next step is to inspect the residual terms. In this
article, the ACF test and LB test will be used to
check the autocorrelation. The results from this
examination are depicted in Figure 4, Table 5.
Research on the Prediction of the Global Price of Gold
381
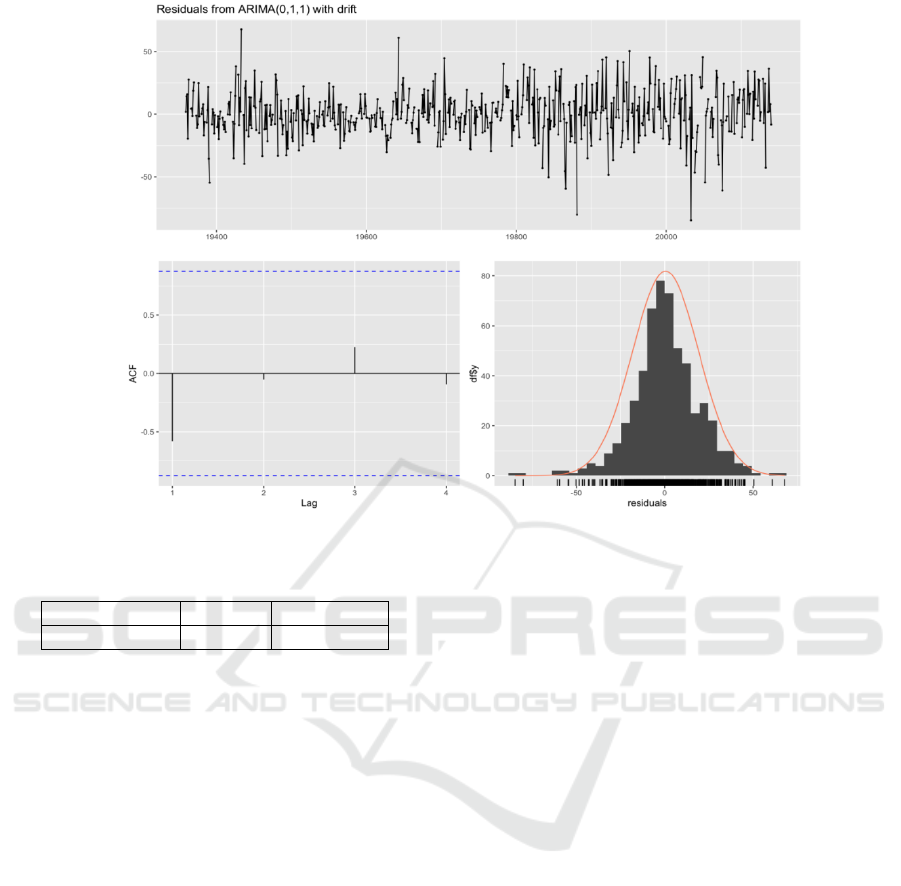
Figure 4: Residuals Testing (Picture credit: Original)
Table 5: Ljung-Box Test
X-square
d
df
p
-value
8.8321 10 0.5481
From the ACF plot on the bottom left, it can be
observed that all four values are significantly smaller
than the critical value. The plot on the bottom right
also indicates that the residuals closely follow a
normal distribution. Furthermore, the LB test shows
that the p-value is 0.5481, which is much greater
than 0.05, suggesting that the residuals do not
exhibit significant autocorrelation. This implies that
the prediction errors of the model are random, and
the ARIMA model fits the data very well.
3.5 Critical Thinking
Although the aforementioned predicted data have
passed various tests, to some extent indicating that
the predictions are reliable, the methodology used in
this study still has certain limitations. As previously
mentioned in this paper, gold prices are highly
influenced by major global events and economic
conditions. However, these factors were not taken
into account when using the ARIMA model for
prediction. Moreover, such global events are
inherently unpredictable. Therefore, this study still
has its limitations.
Comparisons of the effect of prediction between
ARIMA and machine learning models in gold price
forecasting demonstrate that ARIMA maintains
strong competitiveness for short-term (1-7 day)
predictions. However, its predictive accuracy
deteriorates significantly beyond 30-day horizons
due to the omission of macroeconomic variables
(Alameer et al., 2019). During the 2020-2023
Russia-Ukraine conflict period, the ARIMAX model
incorporating the Geopolitical Risk (GPR) index as
an exogenous variable achieved 17.8% higher
forecasting precision compared to conventional
ARIMA, substantiating the necessity of external
factors for enhancing ARIMA's long-term predictive
capacity(Abdollahi & Ranganathan, 2024).
In future research, the paper can integrate
ARIMA with machine learning models such as
LSTM and XGBoost to capture nonlinear
relationships. Additionally, a multivariate model
incorporating macroeconomic indicators, market
sentiment, and supply chain data could be developed
to enhance predictive performance.
4 CONCLUSION
Through the aforementioned research, it can be
concluded that gold prices exhibit a sustained
upward trend in the short term, and the ARIMA
IAMPA 2025 - The International Conference on Innovations in Applied Mathematics, Physics, and Astronomy
382

model's predictions strongly support this conclusion.
Therefore, this paper suggests that it is a wise
decision for investors to purchase gold at present to
capitalize on potential short-term gains.
Additionally, policymakers can use these prediction
data to assess economic risks and adjust monetary
policies accordingly. However, despite the relatively
high accuracy of the ARIMA model in forecasting,
certain limitations remain, such as the failure to
account for external factors. Future research could
collect more comprehensive data and advanced
models to further enhance prediction accuracy.
REFERENCES
Abdollahi, H., & Ranganathan, P., 2024. Geopolitical risks
and gold price prediction: An ARIMAX approach. In
Resources Policy, 88, 104512.
Alameer, Z., Adb Elaziz, M., Ewees, A. A., Ye, H., &
Jianhua, Z., 2019. Forecasting using improved
multilayer perceptron neural network and whale
optimization algorithm. In Resources Policy, 61,
250-260.
Chai, J., Zhao, C. Y., Hu, Y., & Zhang, Z. G., 2021.
Structure analysis and forecast of gold price return. In
Journal of Management Science and Engineering,
135-145.
Davis, S., & Thompson, R., 2018. A hybrid model for gold
price forecasting combining ARIMA and machine
learning. In Computational Economics, 52(3),
789-801.
Johnson, R., & Lee, K., 2019. The impact of geopolitical
risks on gold prices: A global perspective. In
Resources Policy, 63, 101-112.
Liu, Y., & Zhao, L., 2021. A machine learning-based
model for gold price prediction. In Journal of
Computer Applications, 38(5), 1456-1460.
Smith, J., & Brown, T., 2021. Forecasting gold prices
using deep learning techniques. In International
Journal of Forecasting, 37(4), 1234-1245.
Wang, W., & Chen, J., 2019. Gold price forecasting using
ARIMA model. In Statistics and Decision, 35(18),
80-83.
Wang, Y., 2021. Analysis and prediction of stock price
based on ARIMA model. In Productivity Research,
1004-2768.
Wang, Y., & Li, J., 2023. Intraday gold price forecasting: A
comparative study of time series and machine learning
models. In Finance Research Letter, 54, 103789.
Research on the Prediction of the Global Price of Gold
383
