
Research on Stock Price Prediction Based on the ARIMA Model
Ziyi Yang
a
School of Mathematics and Statistics, Huangshan University, Huangshan, Anhui, 245021, China
Keywords: Stock Price, ARIMA Model, Forecasting.
Abstract: In the financial field, stock prices have always been of great concern. Accurately and effectively predicting
stock prices is beneficial for investors to make reasonable decisions and avoid risks. The autoregressive
integrated moving average (ARIMA) model can effectively capture the fluctuation trend of historical stock
prices. This paper constructs an ARIMA model to predict the closing price of Zomato on that day. The results
show that compared with the real value, the root mean square error (RMSE) value predicted by the ARIMA
model is relatively small, only 4.6172, reflecting that the ARIMA model has high accuracy in short-term
forecasting (STF). In the long-term forecast, other non-linear factors should be considered, and other models
should be combined to make improvements and optimizations to improve the accuracy of the forecast. This
research will benefit both providing an effective reference for investors in short-term stock price forecasting
and further improvement and perfection of stock price forecasting in the future.
1 INTRODUCTION
As the most common and wide-ranging investment
method, stocks have long attracted the attention of
investors. The high return of stocks is accompanied
by higher risks, and accurate prediction of stock
prices facilitates obtaining considerable returns, so
this issue has been a hot topic in investment analysis
(Li, 2014). However, in the complex stock market,
stock prices are affected by many factors, which
makes it an arduous task to accurately predict stock
prices (Xu & Liang, 2019). ARIMA is a widely used
and effective model for time series forecasting,
particularly in stock price prediction.
At present, researchers have made progress in the
field of stock price forecasting using the ARIMA
model, which has a certain reference value. Wu &
Wen (2016) established an ARIMA (3,1,1) model to
dynamically and statically predict the closing price
(CP) of Huatai Securities. The relative error between
the predicted value fitted by the model and the real
value is only 0.0135, which verifies that the ARIMA
model has high accuracy in stock price forecasting.
Yang & Zhang (2021) concluded that the ARIMA
model can provide some decision-making suggestions
for policymakers in stocks’ STF through the example
analysis of Dazhong Public Utilities Stock. The
a
https://orcid.org/0009-0009-2785-515X
values obtained by Zhang et al. (2025) reflected that
the ARIMA model has high accuracy. The overall
fitting moderation, Ljung-Box Q test, and
normalization of Bayes’ information criterion (BIC)
results based on Bayes' decision rule all reflected the
better data fitting effect of the ARIMA model and the
higher short-term prediction accuracy.
The ARIMA model shows great potential in stock
price forecasting. This paper takes Zomato's CPs over
the past three years as the dataset, the ARIMA model
is introduced for prediction, and its advantages and
limitations are analyzed. Finally, this paper will
explore the improvement direction of the ARIMA to
provide a reference for follow-up research.
2 DATA SELECTION AND
RESEARCH METHODS
2.1 Dataset
The data used in this study comes from Kaggle
(Kaggle, 2024). The stock prices of Zomato from July
23, 2021, to February 7, 2024, a total of 632 data
points, were selected to build a model for short-term
stock price prediction.
374
Yang, Z.
Research on Stock Price Prediction Based on the ARIMA Model.
DOI: 10.5220/0013826100004708
Paper published under CC license (CC BY-NC-ND 4.0)
In Proceedings of the 2nd International Conference on Innovations in Applied Mathematics, Physics, and Astronomy (IAMPA 2025), pages 374-378
ISBN: 978-989-758-774-0
Proceedings Copyright © 2025 by SCITEPRESS – Science and Technology Publications, Lda.
This paper selects the date and the stock’s CP on
that day as indicators for analysis. First, stock price
data is recorded in chronological order, changing over
time and affecting each other. Dates are the basis of
time series data analysis, which can help identify the
trend of stock prices over time and whether stock
prices have seasonal changes. Secondly, the CP is the
last transaction price before the end of each trading
day, which is an important indicator of concern. The
CP can be used to identify the long-term trend of stock
prices and is an important factor in predicting stock
prices.
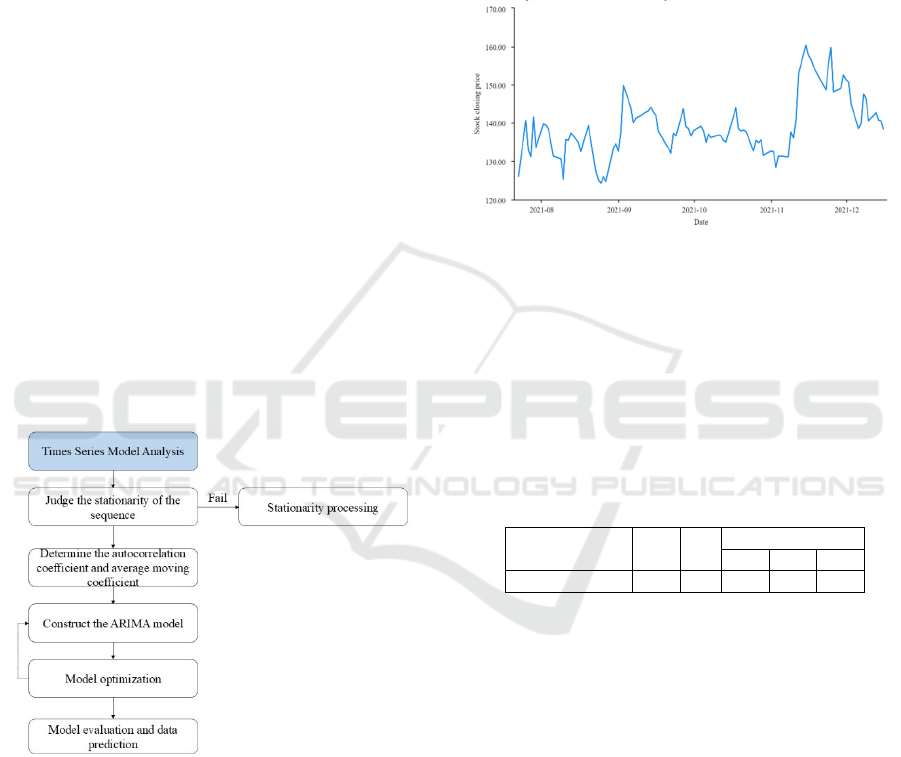
2.2 Method Introduction
In this paper, the ARIMA (p, d, q) model is selected
to process the time series data of stock prices.
Autoregressive (AR) is used to deal with the linear
relationship between current data and past data. The
difference (D) processes the non-stationary time
series, which is brought to a stationary state by
differential processing of up to order 2. The moving
average (MA) is used to represent the linear
relationship between the current value and the past
error term. The partial autocorrelogram determines
the appropriate p, q order. The appropriate difference
order is obtained by the ADF test. As shown in Figure
1, the overall flow is presented.
Figure 1: The structure of the ARIMA (Picture credit:
Original).
3 RESULTS AND DISCUSSION
3.1 Data Stationarity Test
The time series used to build the ARIMA model must
be a stationary series. As shown in Figure 2, the
horizontal axis coordinate is the date, the vertical axis
coordinate is the corresponding CP of the stock on
that day, and the unit is yuan.
Figure 2: Timing diagram of stock CP (Picture credit:
Original)
As can be seen from Figure 2, this group of data is
a stationary series, which fluctuates continuously
around the mean value in general, and have no
obvious continuous upward or downward trend. In
order to verify that the original data is stable,
performing the ADF unit root test on this group of
data is necessary to obtain more accurate judgment
results.
Table 1: Stock CP-ADF inspection
Differential ordert
p
Critical value
1% 5% 10%
0 -3.4020.011-3.498 -2.891 -2.583
As shown in Table 1, for the CP of stocks, the p-
value of 0.011<0.05 in the ADF test of this time series
is significant, and the t-statistic is -3.402, which is less
than the critical value of 5% and 10%. Therefore, the
certainty of rejecting the null hypothesis is 95%,
namely the original series does not have a unit root,
so the original series is a stationary series.
3.2 Model Order Determination and
Evaluation
According to the stationarity, the difference order
I(d)=0, determining the autocorrelation coefficient
and moving average coefficient of the AR and MA
parts, namely the p and q orders, is necessary to build
ARIMA model now.
Research on Stock Price Prediction Based on the ARIMA Model
375
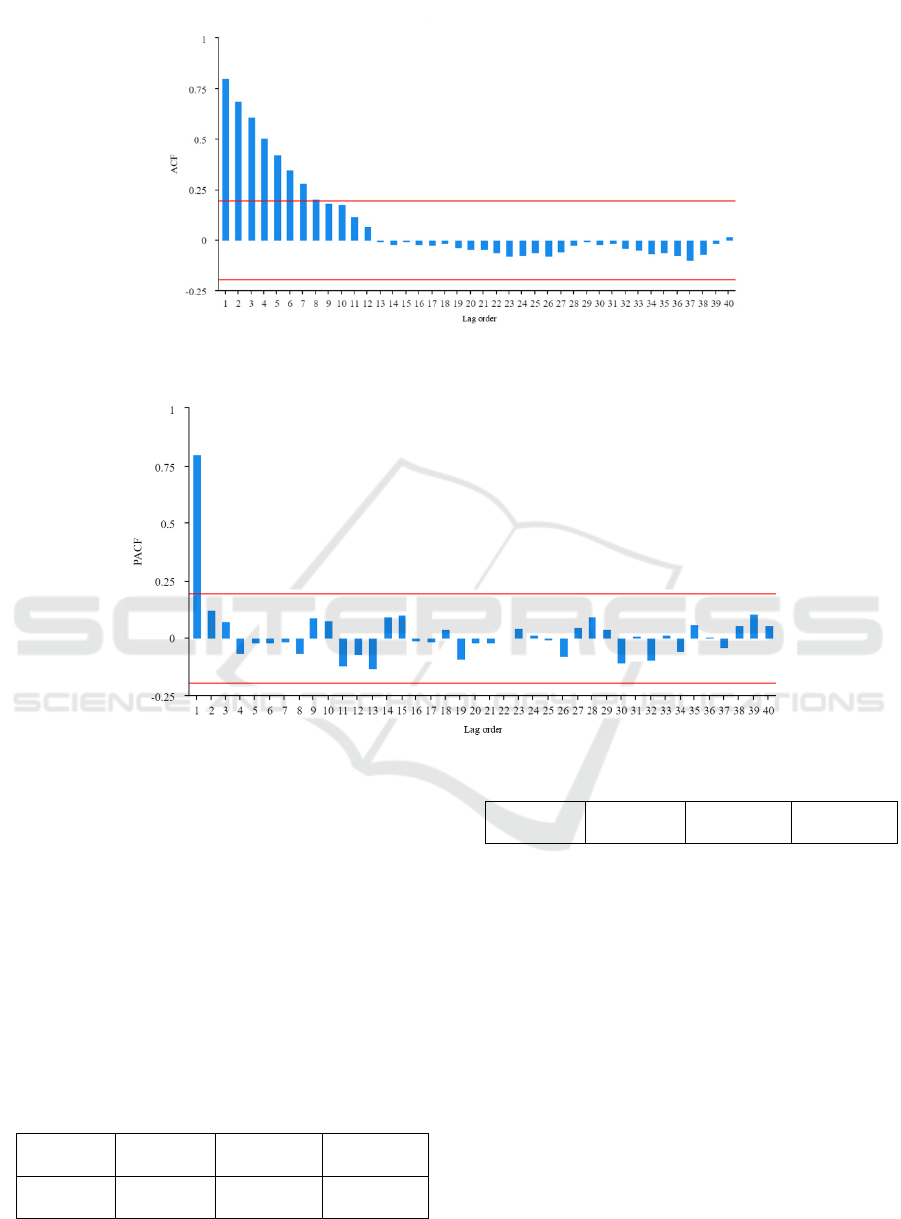
Figure 3: Original sequence autocorrelatin graph (Picture credit: Original)
Figure 4: Original sequence partial autocorrelation graph (Picture credit: Original)
Figures 3 and 4 show the autocorrelation and
partial autocorrelation of the original time series. The
autocorrelation function suggests a first-order tail,
and the partial autocorrelation function truncates at
the first order, indicating an ARIMA (1,0,1) model.
However, Akaike information criterion (AIC) and
BIC are used to determine the optimal p and q values.
Based on these, four models are tested:
ARIMA(1,0,0), ARIMA(1,0,1), ARIMA(2,0,0), and
ARIMA(2,0,1). The AIC and BIC values
corresponding to the above models are calculated
with SPSSAU, and the results are shown in Table 2.
Table 2: ARIMA fitting model AIC and BIC values
ARIMA(1
,0,0
)
ARIMA(1
,0,1
)
ARIMA(2,
0,0
)
ARIMA(2,
0,1
)
AIC592.0
05
593.254 593.442 595.098
BIC599.8
20
603.675 603.862 608.124
Table 2 clearly shows the comparison of AIC and
BIC values of the four ARIMA models. According to
the information criterion, the model with the smallest
AIC and BIC values is the better model, which can
better fit the time series. As can be seen from Table 2,
the AIC and BIC values corresponding to the
ARIMA(1,0,0) model are the smallest, so the
ARIMA(1,0,0) model, namely the AR(1) model, is
finally selected to predict and analyze the CP of the
stock. The formula for this model is
y(t)=27.645+0.800*y(t-1).
3.3 Residual Test
3.3.1 White Noise Test
After parameter estimation, the model's residuals are
tested for white noise. If the residuals show no
IAMPA 2025 - The International Conference on Innovations in Applied Mathematics, Physics, and Astronomy
376
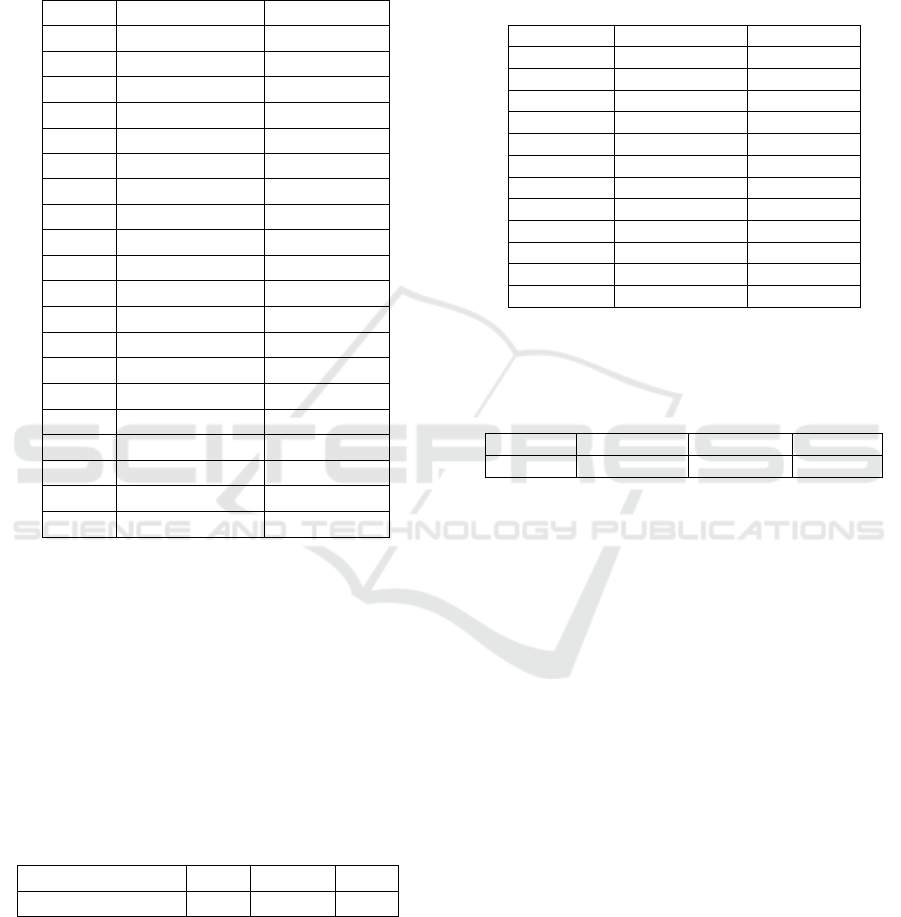
autocorrelation, the model is considered well fitted.
Otherwise, the model will be optimized. The test
results are shown in Table 3. A p-value greater than
0.1 for Q1-Q20 indicates that the residuals pass the
test.
Table 3: Statistics Table
item Statistics P value
Q
1
0.235 0.628
Q
2
0.279 0.870
Q
3
1.170 0.760
Q
4
1.171 0.883
Q
5
1.171 0.948
Q
6
1.177 0.978
Q
7
1.231 0.990
Q
8
2.812 0.946
Q
9
2.955 0.966
Q
10
5.180 0.879
Q
11
5.181 0.922
Q
12
5.343 0.946
Q
13
7.642 0.866
Q
14
8.352 0.870
Q
15
8.559 0.899
Q
16
8.583 0.930
Q
17
8.712 0.949
Q
18
9.151 0.956
Q
19
9.336 0.967
Q
20
9.358 0.978
Table 3 shows the statistical information of model
Q, including statistical value and p-value. It can be
seen from Table 3 that all p-values are greater than
0.1, namely the residuals are white noise, namely
residuals have no autocorrelation, indicating that the
established ARIMA model is reasonable and
effective.
3.3.2 LM Test
As shown in Table 4, the LM test results of the model
residual sequence can be observed.
Table 4: Residual term LM test
F statistics 0.849
P
value 0.584
T *R
2
Statistics 8.732
P
value 0.558
It can be seen from Table 4 that in the residual
term LM test, the corresponding P values of F statistic
and T * R ^ 2 statistic are both greater than 0.05,
which further verifies that residual sequence have no
sequence correlation so it can be determined that the
ARIMA model established has good fitting effect and
high accuracy.
3.4 Model Prediction
Since the established ARIMA (1,0,0) model has
passed the residual test, it can make a short-term
forecast of Zomato stock price and predict the stock
CP in the next 12 trading days.
Table 5: AR (1) model prediction results
Date Predicted value Actual value
2024-02-08 138.409 144.10
2024-02-09 138.416 149.54
2024-02-12 138.422 153.80
2024-02-13 138.427 154.75
2024-02-14 138.430 152.25
2024-02-15 138.433 154.85
2024-02-16 138.436 156.70
2024-02-19 138.438 157.50
2024-02-20 138.439 161.05
2024-02-21 138.404 158.65
2024-02-22 138.441 162.10
2024-02-23 138.442 164.05
As shown in Table 5, the comparison between the
model-predicted value and the real value of the stock
CP in the next 12 periods can be observed.
Table 6: Model error assessment
RMSE MSE MAE MAPE
4.6172 21.3189 3.4144 0.0245
Table 6 shows that the RMSE of the AR(1) model
is 4.6172, the MSE is 21.3189, the MAE is 3.4144,
and the MAPE is 0.0245. These indicators fully
reflect the high degree of fitting between the stock
CPs predicted by the AR (1) model and their actual
value, and the prediction results are more accurate.
Although the traditional time series prediction
model (ARIMA model) performs well in prediction,
it still has some limitations. For example, stock price
fluctuations are usually nonlinear and have complex
noise, but the ARIMA model is used to study linear
data, and it cannot find the relevant information about
nonlinear data. Therefore, accurate prediction results
cannot be obtained by only using the ARIMA model
(Zhang, 2019). ARIMA models may also have large
errors when dealing with long-term forecasts.
To obtain more accurate prediction results, a large
number of researchers have proposed improved
methods that combine the ARIMA model with other
models to reduce errors. For example, the long short-
term recurrent neural network (LSTM) is superior to
the traditional ARIMA model in predicting stock
prices, because it can capture time patterns.
Therefore, LSTM can be introduced to perform
memory storage of past information (Jiang,2025).
Gao (2021) combined the ARIMA model with the
Research on Stock Price Prediction Based on the ARIMA Model
377

deep learning model, and the results showed that the
Seq2Seq model based on the LSTM model has the
smallest mean square error in the prediction, which is
an excellent prediction tool for stock prices, and the
increase in the complexity of the neural network will
produce better prediction results. In addition, the
ARIMA model has limitations in dealing with
cyclical changes, while Prophet is more flexible and
good at processing time series data with seasonal,
trend, and holiday effects. Therefore, Anusha et al.
(2021) introduced Facebook Prophet based on the
ARIMA model, which successfully solved the
problem of dealing with the elements related to
seasonality in the data.
4 CONCLUSION
Stock price prediction has always been a highly
concerned and challenging problem, which can be
effectively predicted by using time series models.
This paper constructs an ARIMA model to fit and
predict Zomato stock price, and finds that the model
is effective in capturing time series and volatility. At
the same time, this paper found that the error between
the predicted values of the stock prices of the previous
periods and the real values is small and within the
allowable error range by comparing the predicted
stock prices of the 12 periods. As time goes on, the
error between the predicted value and the real value
of the stock price gradually increases, which fully
demonstrates that the ARIMA model shows high
accuracy in short-term prediction. However, due to
the complexity and nonlinear characteristics of the
stock market, the ARIMA model has some limitations
when dealing with long-term forecasting. Future
research can try to combine the ARIMA model with
machine learning models, such as decision tree,
LSTM, etc., to improve the model's prediction
performance. This paper provides strong theoretical
support for stock price forecasting and has practical
application value. Furthermore, the improvement
methods and suggestions for future research on stock
price forecasting are also presented in this paper.
REFERENCES
Aradhak, K., 2024. Zomato stock price prediction. Kaggle.
https://www.kaggle.com/datasets/aradhakkandhari/zo
mato-stock-price-prediction/dataSSS
Gao, Z., 2021. Stock price prediction with ARIMA and deep
learning models. In 2021 IEEE 6th International
Conference on Big Data Analytics (ICBDA), pp. 61–68.
IEEE.
Garlapati, A., Krishna, D. R., Garlapati, K., Rahul, U., &
Narayanan, G., 2021. Stock price prediction using
Facebook Prophet and ARIMA models. In 2021 6th
International Conference for Convergence in
Technology (I2CT), pp. 1–7. IEEE.
Jiang, S., 2025. Stock price prediction based on LSTM
model. Jiangsu Business Theory, (01), 83–86.
Li, Y., 2014. Stock price prediction based on the ARIMA
model and neural network model – taking the Bailian
Group as an example. Modern Marketing (Xueyuan
Edition), (04), 96–97.
Weng, Z., 2023. Stock price analysis and forecast based on
ARIMA model – taking Construction Bank as an
example. Modern Information Technology, 7(14), 137–
141.
Wu, Y., & Wen, X., 2016. Short-term stock price forecasting
based on the ARIMA model. Statistics and Decision,
(23), 83–86.
Xu, S., & Liang, X., 2019. Research on stock price
prediction based on the ARIMA-GARCH model.
Journal of Henan University of Education (Natural
Science Edition), 28(04), 20–24.
Yang, Y., & Zhang, M., 2021. Empirical analysis of stock
prices based on ARIMA model. Science and Technology
Information, 19(29), 121–123+127.
Zhang, Q., 2019. Analysis of the price forecast of GEM
stocks based on the ARIMA-SVM combination model.
Guangxi Quality Supervision Report, (12), 131–132.
Zhang, Y., Xiao, H., Zhang, Y., & Zhao, J., 2025. Stock
price forecast based on ARIMA model. Statistics and
Application, 14(4), 10–18.
IAMPA 2025 - The International Conference on Innovations in Applied Mathematics, Physics, and Astronomy
378
