
Research on the Influencing Factors of GPA Based on Multiple
Linear Regression
Xintong Du
a
School of Statistics, School of Southwestern University of Finance and Economics, Chengdu, Sichuan, China
*
Keywords: GPA, Influencing Factors, Multiple Linear Regression, Correlation Analysis, Descriptive Statistics.
Abstract: Academic performance is a critical determinant of future opportunities, yet the key drivers of GPA
variations remain underexplored. This study investigates the factors influencing Grade Point Average
(GPA) among university students using statistical methods, including multiple linear regression and
correlation analysis. This research aims to identify the most influential factors affecting GPA to provide
actionable insights for improving student outcomes. Data for this study were obtained from publicly
available datasets on Kaggle, which include variables such as study habits, socioeconomic background,
and academic performance. The results indicate that study hours have the most significant positive
impact on GPA, while sleep hours exhibit a significant negative correlation. Social hours, physical
activity hours and stress levels also show moderate positive effects, whereas extracurricular hours do
not significantly affect GPA. The study's limitations include the exclusion of qualitative factors. Future
research should incorporate other factors multicollinearity among predictors. Additionally, simplifying
the model and using cross-validation could enhance stability and predictive performance.
1 INTRODUCTION
Grade Point Average (GPA) is an important indicator
of academic performance and is widely used in higher
education. It not only reflects students' academic
achievements but also plays a key role in scholarship
assessments, graduate school applications, and job
competition. Therefore, researching the factors
influencing GPA is of great significance for the
formulation of educational policies, the improvement
of teaching quality, and the personal development of
students.
In recent years, with the accumulation of
educational data and the advancement of analytical
techniques, more and more studies have begun to
focus on the factors influencing GPA. The advantages
of multiple linear regression and correlation analysis
lie in their ability to quantify the impact of multiple
variables on GPA, identify key factors, and reveal the
relationships between variables. Compared to single
methods, these techniques are more suitable for
handling complex relationships involving multiple
factors. Several relevant studies have explored this
a
https://orcid.org/0009-0008-4660-6143
*
Corresponding author
topic. For instance, Yuan et al. (2024) uesd mutiple
linear regression to conclued that personality traits
like conscientiousnes s (r = 0.19 (p < 0.001)) are
strongly linked to higher GPA, while extraversion (r
= 0.05 (p < 0.05)) and openness (r = 0.06 (p <
0.05))are linked to lower GPA.Additionally,
Pascarella and Terenzini (2005) studied how study
time affects GPA. They showed that academic
engagement is important for GPA. Sirin (2005) found
that family income affects GPA through educational
resources, showing the role of socioeconomic
background in academic success. Steindórsdóttir et al.
(2024) showed that GPA has a long-term effect on
career success, linking GPA to career growth. Keles
et al. (2025) looked at how anxiety, loneliness, and
gender affect GPA, finding that these factors impact
academic performance. Li et al. (2022) showed that
learning attitudes, professional interest, and
motivation affect GPA, meaning internal factors are
as important as external ones. These studies provide
important empirical evidence for understanding the
mechanisms influencing GPA. This paper will use
multiple linear regression as the main method,
Du, X.
Research on the Influencing Factors of GPA Based on Multiple Linear Regression.
DOI: 10.5220/0013826000004708
Paper published under CC license (CC BY-NC-ND 4.0)
In Proceedings of the 2nd International Conference on Innovations in Applied Mathematics, Physics, and Astronomy (IAMPA 2025), pages 369-373
ISBN: 978-989-758-774-0
Proceedings Copyright © 2025 by SCITEPRESS – Science and Technology Publications, Lda.
369

combined with correlation analysis and descriptive
statistics, to explore the factors influencing GPA. This
research offers senior students a channel, through
which they can adapt their time allocation to improve
their GPA.
2 METHODOLOGY
2.1 Data Source and Description
The data used in this study is sourced from the Kaggle
open data platform, involving a dataset titled Daily
Lifestyle and Academic Performance of Students"
contains data from 2,000 students collected via a
Google Form survey (researched by Sumit Kumar,
ranging from 2023.8.1 to 2024.10.24) (Kaggle, 2024).
It includes information on study hours, extracurricular
activities, sleep, socializing, physical activity, stress
levels, and CGPA. The data covers an academic year
from August 2023 to May 2024 and reflects student
lifestyles primarily from India.
2.2 Indicator Selection and Description
In this study, the selection of indicators is divided into
quantitative and qualitative variables. The
quantitative independent variables include: study
hours per day, extracurricular hours per day, sleep
hours per day, social hours per day, and physical
activity hours per day. All these quantitative variables
undergo normalization to scale the data within a
specific range, ensuring comparability. Moreover, the
qualitative independent variable is Stress Level
(students' stress level), which is processed through
label encoding. The categories are encoded as: Low =
1, Moderate = 2, and High = 3. Meanwhile, the
dependent variable is GPA, which represents students'
academic performance and is used directly without
any processing. There is an index called
“Student_ID” among them, which is not related to this
research, so this paper deletes it.
2.3 Methodology Introduction
This research utilizes multiple linear regression
(MLR) as the primary statistical method to analyze
the factors affecting students' academic performance
(GPA). Multiple linear regression is a widely used
analytical technique that models the relationship
between a single dependent variable and multiple
independent variables. The general mathematical
representation of the regression model is formulated
as follows:
𝑦=𝛽
+𝛽
𝑥
+𝛽
𝑥
+⋯+𝛽
𝑥
+∈ (1)
where y represents the dependent variable, which
in this study corresponds to students' GPA,
𝑥
, 𝑥
...... 𝑥
denote the independent variables,
including study hours, extracurricular activities, sleep
duration, social interactions, physical activity, and
stress level.𝛽
is the intercept term, representing the
expected value of GPA when all independent
variables are zero.𝛽
,
𝛽
,...... ,𝛽
are the regression
coefficients, which quantify the impact of each
independent variable on GPA. These coefficients
indicate the magnitude and direction of influence that
each predictor variable has on academic performance.
ϵ is the error term, which accounts for variations in
GPA that cannot be explained by the included
independent variables. It is assumed to follow a
normal distribution.
To estimate the regression coefficients, this study
employs the least squares estimation method, which
minimizes the sum of squared differences between the
observed values and the predicted values of GPA. The
goodness-of-fit of the model is evaluated using the R-
squared (R2) statistic, which measures the proportion
of variance in GPA that is explained by the
independent variables included in the model. A higher
R2 value suggests a stronger explanatory power of the
model.
Before constructing the regression model, this
study conducts a correlation analysis to assess the
strength and direction of the relationships between
GPA and each independent variable. Pearson’s
correlation coefficient (r) is computed for this
purpose. The coefficient r ranges from -1 to 1 and is
interpreted as follows: Firstly, when r>0, it means a
positive correlation – as the independent variable
increases, GPA tends to increase. Similarly, when
r<0, it illustrates a negative correlation. when r≈0,
there is no significant correlation and there is no
meaningful linear relationship between the variables.
Moreover, descriptive statistics serve as the
foundation for GPA analysis by summarizing the
dataset, identifying patterns, and ensuring data quality
before performing deeper statistical modeling. By
using these methods, researchers can better interpret
how lifestyle factors influence academic performance
and set the stage for more complex analytical
techniques like correlation analysis and multiple
linear regression.
To enhance the accuracy and interpretability of
the regression model, data preprocessing is
implemented before the analysis. This step includes
handling missing data, identifying and addressing
outliers, and applying normalization techniques to
continuous variables where necessary.
IAMPA 2025 - The International Conference on Innovations in Applied Mathematics, Physics, and Astronomy
370
3 RESULTS AND DISCUSSION
3.1 Descriptive Statistics
The dataset used in this study includes records of
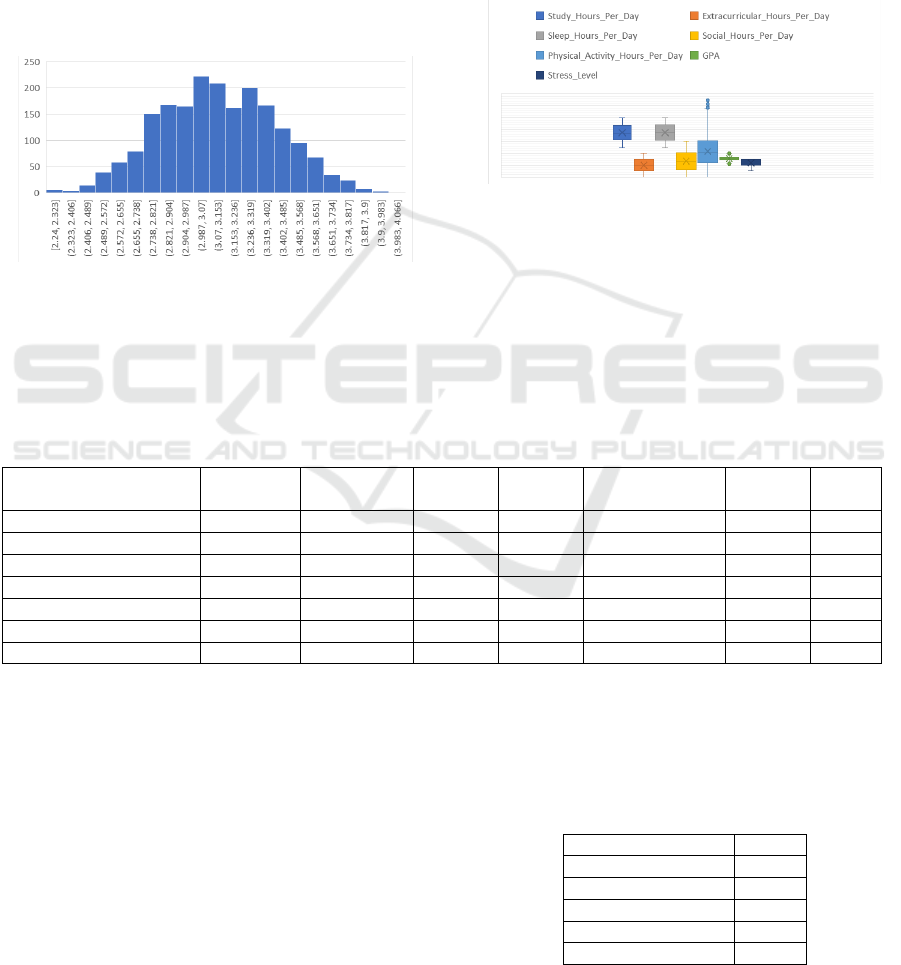
2,000 students' lifestyle habits and GPA. Figures 1
and 2 present the descriptive statistics for the key
variables.
In Figure 1, the horizontal coordinates are the
score of GPA, while the vertical coordinates represent
the number of students who got them. Figure 2
presents the central trend, dispersion, and outlier
among these factors.
Figure 1: Column diagram of GPA (photo is original)
Combined with the data and chart, here are the
conclusions:
Firstly, the average GPA is around 3.1, follows a
normal distribution, and is relatively concentrated with
a slight right skew. The median stress level is 3,
indicating that most students experience high stress.
Secondly, the standard deviation of sleep time is
0.03184, and the median is 7.4, showing a relatively
balanced distribution and the standard deviation of
study time is 0.0327, and the median is 7.5, indicating
a relatively balanced distribution. Figure 1 shows that
the distribution of GPA conforms to a normal
distribution. Figure 2 reveals some outliers in physical
exercise time, which need further investigation to
determine their impact on regression analysis.
Figure 2: Box Plot of variable influencing factors of GPA
(photo is original)
3.2 Correlation Analysis
By using Excel's data analysis tools, the calculated
correlation matrix is as Table 1:
Table 1: The box plot of GPA and influencing factors
Study
Hou
r
Extracurricu
lar Hours
Sleep
Hours
Social
Hours
Physical
Activit
y
Hours
GPA
Stress
Level
Study_Hours 1
Extracurricular Hours -0.0026 1
Sleep Hours 0.0267 0.0088 1
Social Hours -0.1378 -0.1391 -0.1936 1
Physical Activity Hours -0.4881 -0.3700 -0.4703 -0.4171 1
GPA 0.7344 -0.0322 -0.0043 -0.0857 -0.3412 1
Stress Level 0.7388 -0.0061 -0.2989 -0.0547 -0.2052 0.5504 1
Combined with the data in Table 2, here are the
conclusions: Study hours have a strong positive
correlation with GPA (r = 0.73). This means that
students who study more tend to get higher grades.
Physical activity hours have a negative correlation
with GPA (r = -0.34). This means that more time spent
on physical activity may lower academic
performance. Social hours have a weak negative
correlation with GPA (r = -0.08). This shows that
social time has little effect on academic performance.
Extracurricular involvement has a very low
correlation with GPA (r = -0.03). Sleep duration has
almost no correlation with GPA (r = -0.004). Stress
levels have a moderate to strong positive correlation
with GPA (r = 0.55). This means that students with
more stress tend to perform better academically.
Table 2: Regression Statistics Result of Multiple Linear
Regression
Regression Statistics
Multiple R 0.7355
R Square 0.5409
Ad
j
usted R S
q
uare 0.5395
Standard Erro
r
0.2025
Observed Value 2000
Research on the Influencing Factors of GPA Based on Multiple Linear Regression
371
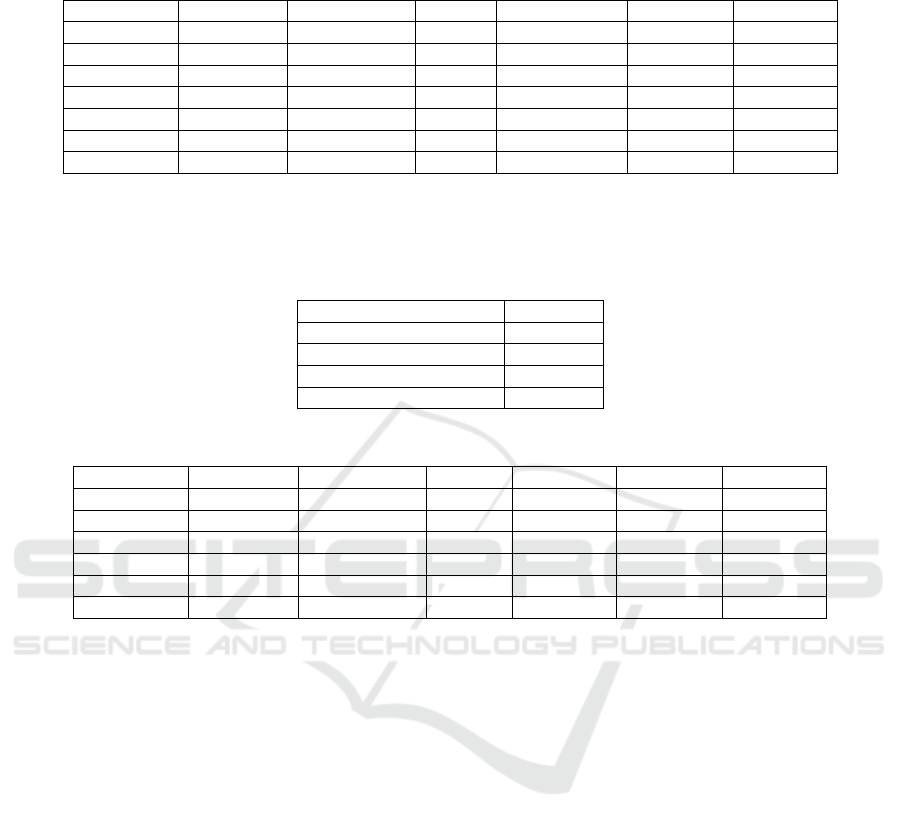
Table 3: Result of Multiple Linear Regression
Coefficients Standard Erro
r
t Stat P-value Lower 95% U
pp
er 95%
Interce
p
t 1.8273 0.0929 19.6671 0.0758*10-77 1.6450 2.009
X Variable 1 0.1618 0.0065 25.0853 0.0063*10-118 0.1745 -
X Variable 2 0 0 65535 - 0 0
X Variable 3 0.0030 0.0053 0.5635 - -0.0074 0.0134
X Variable 4 0.0088 0.0045 1.9534 0.0509 -3.5E-05 0.0177
X Variable 5 0.0075 0.0040 1.8925 0.0586 -0.0003 0.0153
X Variable 6 0.0002 0.0105 0.0197 0.9843 -0.0204 0.0208
Because there is the insignificant connection
between GPA and X Variable 2(Extracurricular
hours) in Table 3, the paper deletes this factor and
makes another form without it:
Table 4: Regression Statistics Result of Multiple Linear Regression (without X Variable 2)
Multiple R 0.8048
R Square 0.6477
Ad
j
usted R S
q
uare 0.6468
Standard Erro
r
0.4324
Observed Value 2000
Table 5: Result of Multiple Linear Regression (without X Variable 2)
Coefficients Standard Erro
r
t Stat P-value Lower 95% Upper 95%
Intercept 0.6894 0.2161 3.1903 0.0014 0.2656 1.1132
X Variable 1 0.3828 0.0133 28.8761 0.0018-150 0.3568 0.4088
X Variable 3 -0.1581 0.0107 -14.7491 0.0832-45 -0.1791 -0.1371
X Variable 4 -0.0042 0.0096 -0.4399 0.6601 -0.0231 0.0147
X Variable 5 0.0021 0.0085 0.2475 0.8045 -0.0145 0.0187
X Variable 6 0.0009 0.0478 0.0197 0.9843 -0.0928 0.0947
Above all, the paper can conclude that: The p-
value of study hours (X Variable1) is extremely small
and well below 0.05, which means it has a highly
significant positive effect on GPA (Tables 4, 5). In
contrast, the p-value of sleep hours (X Variable3) is
small enough, hurting GPA. Furthermore, social
hours (X Variable 4), physical hours (X Variable 5),
and stress level (X Variable 6) do not have significant
effects on the dependent variable, as indicated by their
high p-values. These variables are not contributing
meaningfully to the model and could potentially be
excluded in further analysis. The R2 is o.6477, which
means there is a nice variance in GPA.
3.3 Discussion
This study only considers quantifiable lifestyle
factors (e.g., study time, sleep, social activities).
However, qualitative factors such as learning
strategies, motivation, and family support may also
significantly influence GPA, but were not included.
There are a lot of surveys highlighted the significant
impact of qualitative factors on GPA. For instance,
Marley and Wilcox (2022) found that family and peer
academic social supports are predictive of academic
motivation and first-semester GPA among first-year
college students. Similarly, Pérez-Navío et al. (2023)
demonstrated that learning strategies, intrinsic
motivation, and study habits are strongly associated
with academic performance in university students.
These findings suggest that factors beyond
quantifiable lifestyle elements, such as study time and
sleep, play crucial roles in influencing GPA.
Moreover, Brambila-Tapia et al. (2022) found that
positive relationships with others, emotion
perception, and weekly physical activity hours are
associated with higher GPA in female students.
Similarly, Wu et al. (2022) demonstrated that intrinsic
motivation, need for cognition, grit, and growth
mindset are predictive of academic achievement in
high school students.
Although the R² value of 0.64 indicates that the
model explains a decent amount of variance in GPA,
future experiments may also benefit from further
simplifying the model or exploring different
combinations of predictors to avoid unnecessary
complexity. Additionally, techniques like cross-
validation could be considered to assess the stability
IAMPA 2025 - The International Conference on Innovations in Applied Mathematics, Physics, and Astronomy
372

and generalizability of the model, ensuring
improvements in predictive performance.
However, the study also finds multicollinearity
between several variables, meaning some of the
predictors are too similar. This means the author
needs to carefully choose which variables to include
in the future to make the model more reliable.
4 CONCLUSION
This paper uses multiple linear regression as a
majority, combined with descriptive and correlation
analysis, showing a detailed correlation between GPA
and lifestyle. It shows that study habits affect GPA a
lot, with study hours being the most important factor.
More study time leads to better grades. The study
shows that sleep duration hurts GPA. In contrast,
factors like social hours, physical activity, and
extracurricular involvement have little effect on GPA.
However, the limit of the dataset and the
multicollinearity between several variables need to be
improved in future studies.
Future research should look at non-linear
relationships between variables and include other
factors, such as learning methods, motivation, and
mental health, which might help explain academic
performance better.
REFERENCES
Brambila-Tapia, C., Gálvez, M., & Martínez-Sánchez, M.,
2022. The relationship between emotion perception,
social relationships, and GPA in female students: The
role of physical activity. In Psychology, Health &
Medicine, 27(7), 1551-1563.
Keles, B., Demir, A., & Uzun, M., 2025. Anxiety,
loneliness, and gender as determinants of GPA in
university students. In Journal of Student Affairs
Research, 41(2), 123-135.
Li, Y., Zhao, L., & Wang, Q., 2022. Factors influencing
GPA in university students: The roles of learning
attitude, motivation, and professional interest. In
Journal of Educational Psychology, 58(6), 1129-1144.
Marley, L., & Wilcox, D., 2022. Family and peer academic
social supports as predictors of academic motivation
and first-semester GPA among first-year college
students. In Journal of College Student Development,
63(5), 567-579.
Pascarella, E. T., & Terenzini, P. T., 2005. How College
Affects Students: A Third Decade of Research. In
Jossey-Bass.
Pérez-Navío, E., García-Sánchez, J. N., & Figueroa, F.,
2023. The impact of learning strategies, intrinsic
motivation, and study habits on academic performance
in university students. In Sustainability, 15(4), 3497.
Sirin, S. R., 2005. Socioeconomic status and academic
achievement: A meta-analytic review of research. In
Review of Educational Research, 75(3), 417-453.
Steindórsdóttir, J., Ásgeirsson, T., & Jónsson, H., 2024. The
long-term effects of GPA on career success: Evidence
from a longitudinal study. In Journal of Higher
Education Research, 63(5), 903-918.
Wu, Z., Li, S., & Xie, Y., 2022. The influence of intrinsic
motivation, need for cognition, and grit on academic
achievement in high school students. In arXiv.
Yuan, S., Zhang, Y., & Liu, X., 2024. The influence of
personality traits on academic performance: A cross-
lagged study. In Educational Psychology, 44(4), 366-
381.
Sumit Kumar., 2025. The dataset of 2000 students’ lifestyle.
In Kaggle.
https://www.kaggle.com/datasets/steve1215rogg/stude
nt-lifestyle-dataset
Research on the Influencing Factors of GPA Based on Multiple Linear Regression
373
