
Quantitative Analysis of Short Video Dissemination Effects: Based on
the Likes, Share Rate and Comment Density
Jiashuo Wang
a
School of Math, University of Southampton, Southampton, SO14, U.K.
Keywords: Short Video, Logistic Regression, User Engagement Index.
Abstract: The rapid development of the short video industry makes people pay attention to the huge changes brought
by this new era of communication, from the past, a message may be a year, two years or more to let the whole
world know, to the current speed of light to spread, the short video makes the information gap has become
smaller. At the same time, short video as a form of public entertainment, the economic benefits of short video
should not be underestimated. After summarizing the directions of previous research, collected basic data on
videos from TikTok, exploring the correlation between explanatory variables, this paper uses OLS Model to
give an insight into the correlation between User Engagement Index and Short video basic data. This paper
not only confirms independence between each explanatory variable as well as the robustness of the model but
also proves the parsimony of the OLS model and the fitness between the model and the data. According to
the inferred results show that short video user participation is closely related to Comment density and Share
rate and also has a certain relationship with the number of likes. In conclusion, by studying the relationship
between user participation index and basic video data, this paper provides a more in-depth understanding of
the impact of short videos, which is conducive to further promoting the further development of the short video
industry.
1 INTRODUCTION
Under the background of accelerated global digital
process, short video culture is gradually prevalent,
YouTube, TikTok and other short video platforms
have produced different forms of short videos with
different contents, short videos have gained
popularity by virtue of their short duration, low
threshold, social attributes and precise pushing, and
have rapidly developed into a blue ocean of
development and an important research topic in the
field of Internet industry (Zhang et al., 2021). As a
text form carrying symbolic expressions, these short
videos themselves are applicable to dissemination
scenarios ranging from mobile devices to fixed
devices, and they are applicable to a wide range of
forms, making them a symbolic mode of content
dissemination in contemporary network culture.
From the point of view of technological progress,
digital video is no longer a medium juxtaposed with
other symbols, but wraps existing media forms in it,
thus presenting a videoed image of the complete
society (Zhang et al., 2022). Some scholars have
a
https://orcid.org/0009-0002-4367-3654
pointed out that ‘In the current mobile social
behaviour, short video, as a rapid means of
communication, can more easily achieve the needs of
mass and intuitive communication, and at the same
time can effectively reorganize multiple meaning
symbols' short video creators based on their own
experience and imagination, with the help of video
symbols, text, expanding the use of various types of
short video is not limited to the creator's imagination
and search for the meaning of life channels. The
subject's imagination and the search for the meaning
of life channels, which is also a short video can
transcend many forms of content expression, out of
all kinds of media culture is an important reason (Liu,
2024).
According to some data, the average daily usage
time of short video platforms (e.g., TikTok,
YouTube) has exceeded 2.5 hours, which has become
an important channel for global Internet users to
entertain and obtain information. According to
statistics, by 2024, the user scale of TikTok video
platform has exceeded 1.58 billion (Liu et al., 2024).
Among them, the scale of short video users in China
360
Wang, J.
Quantitative Analysis of Short Video Dissemination Effects: Based on the Likes, Share Rate and Comment Density.
DOI: 10.5220/0013825800004708
Paper published under CC license (CC BY-NC-ND 4.0)
In Proceedings of the 2nd International Conference on Innovations in Applied Mathematics, Physics, and Astronomy (IAMPA 2025), pages 360-363
ISBN: 978-989-758-774-0
Proceedings Copyright © 2025 by SCITEPRESS – Science and Technology Publications, Lda.
is close to 1 billion, and the average daily interaction
volume is up to tens of billions of times (Zheng et al.,
2023). The rise of short video platforms has not only
revolutionized global media consumption patterns,
but also spawned interactive behavioural metrics
cantered on the rate of likes, retweets and comment
density. Likes, retweets and comments reflect users'
identification, social motivation and deep
engagement (Chen et al., 2021). Studies have shown
that liking behavior is often viewed as low-cost
immediate feedback, and its frequency of occurrence
is significantly and positively correlated with the
content's visual appeal, emotional resonance, and
entertainment (Cheng, 2024). Reposting behavior is
related to an individual's social network, while
comment density reflects the content's controversial
and topical nature. For example, a large number of
likes may stimulate retweeting behaviour through the
‘herd effect’, while a large number of comments may
in turn increase the content's exposure in the
algorithm (Zhang, 2023). Existing studies on short
video user engagement behaviour have mostly
investigated the facilitation mechanism of user
engagement behaviour in terms of the functional
features of short video platforms and the motivation
to use them (Sun et al., 2021). Therefore, this paper
constructs a user engagement analysis model with
‘likes, retweets and comment density’ as the core
variables, which provides a new perspective for
platform optimization and academic research. This
paper collects public data from short video platforms,
combines correlation analysis and multiple linear
regression analysis, and explores the following
questions: Is there a significant linear correlation
between the number of likes, retweets and comment
density. How to predict user engagement through the
synergistic effect of the three.
2 METHODOLOGY
2.1 Data Source
The data utilized in this study was sourced from
Kaggle, this data summarizes the data from one
hundred account videos, these data mainly show
some interactive behaviors of TikTok users, these
data mainly contain the number of likes, comments
and share, based on these data for deeper calculations
and summaries. TikTok is the most popular short
video platform in the market, its users are not only
most of the young people, but also a lot of older
people, so the analysis of TikTok's user behaviour
data, can get more accurate results.
2.2 Variable Description
Likes: The number of likes is the number of positive
feedback expressed by users by clicking or touching
the ‘Like’ button provided by the platform after
watching short videos. The number of likes directly
reflects the degree of users' love and recognition of
the video content and is a low-cost and direct way of
user interaction.
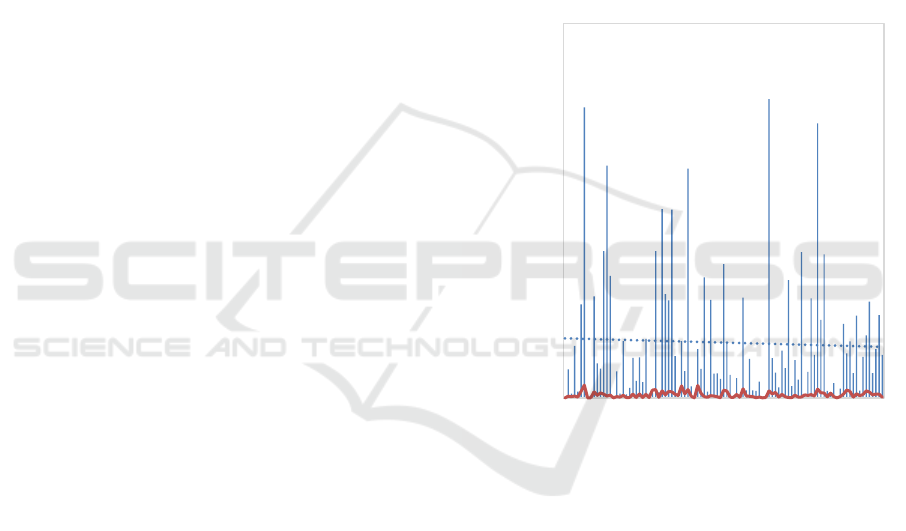
Share Rate: Users' ability to forward videos to
others or to other platforms is key to the proliferation
of video content and a measure of its potential for
dissemination (Figure 1).
The measurement mode is:
𝑆ℎ𝑎𝑟𝑒 = 𝑆ℎ𝑎𝑟𝑒 ÷ 𝐿𝑖𝑘𝑒𝑠 (1)
Figure 1: Share Rate and Likes (Picture credit: Original)
Comment Density: Commenting is the act of
expressing one's views, opinions or feelings through
text or other means after watching a video,
representing a deeper level of user engagement.
Measurement mode is:
𝐶𝑜𝑚𝑚𝑒𝑛𝑡 𝐷𝑒𝑛𝑠𝑖𝑡𝑦 = 𝐶𝑜𝑚𝑚𝑒𝑛𝑡 ÷ 𝐿𝑖𝑘𝑒𝑠 (2)
In this graph Comment rate is the amount of
comments divided by the value of the amount of likes,
the changes and the amount of likes are closely
related to the chart the author can see that, with the
amount of likes continue to rise, the amount of
comments are also improved, it can be clearly seen
that the comment rate is positively correlated with the
amount of likes (Figure 2).
0
50000
100000
150000
200000
250000
Share rate
Likes
Quantitative Analysis of Short Video Dissemination Effects: Based on the Likes, Share Rate and Comment Density
361
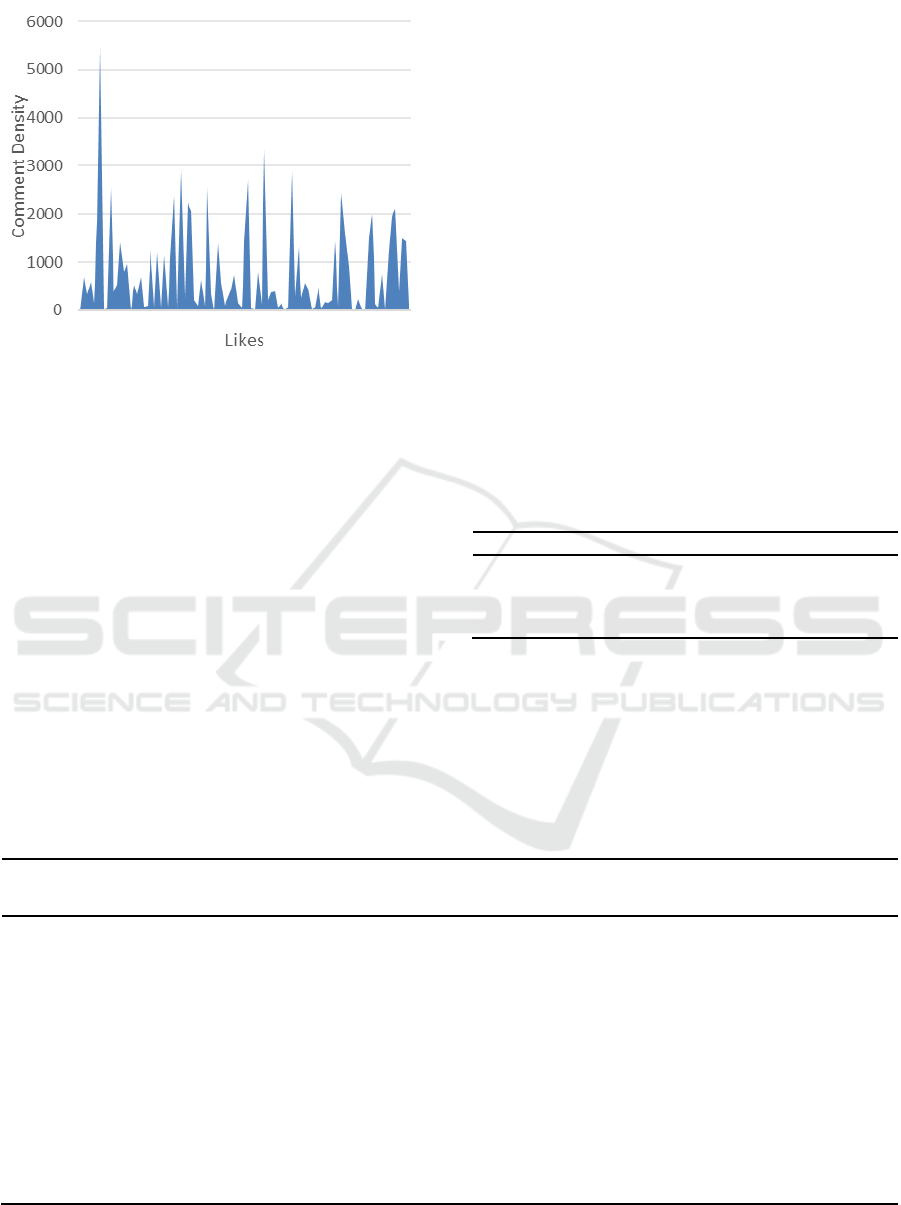
Figure 2: Comment Density and Likes (Picture credit:
Original)
2.3 Method Introduction
The method used in this paper is the Ordinary Least
Squares (OLS). It serves as a cornerstone in
understanding the relationships between variables,
OLS is a classical method of linear regression
analysis which aims to find the optimal linear
relationship between the independent variables and
the dependent variable by minimizing the sum of
squared residuals between the predicted and actual
values (Zhang et al., 2019). Through its application,
this paper will reveal unique insights into the User
Engagement Index. The linear fitting equation in OLS
Model can be written as:
𝑦=𝛽
+𝛽
𝑥
+𝛽
𝑥
+⋯+𝛽
𝑥
+𝜀 (3)
Where 𝑦 is User Engagement Index, 𝑥
is Likes, 𝑥
is
Share Rate, 𝑥
3
is Comment Rate.
3 RESULTS AND DISCUSSION
3.1 Collinearity Diagnosis
The test for multicollinearity of the model shows that
all the Variance Inflation Factor (VIF) values in the
model are less than 2 (with a maximum value of
1.280), which implies that there is no problem of
covariance; the D-W values are all around 2, which
suggests that there is no autocorrelation in the model,
and there is no correlation between the sample data
(Table 1). The tolerance values are all greater than 0.7,
which further supports that there is no strong
correlation between the variables. Therefore, the
explanatory variables in the model have good
independence and are suitable for regression analysis.
Table 1: Collinearity Diagnosis
Ite
m
VIF Tolerance
Likes 1.052 0.951
Share Rate 1.280 0.781
Comment Rate 1.243 0.804
3.2 OLS Regression Model
After the above preparation work, the paper started
to establish the OLS regression model.
Table 2: OLS Regression results
Unstandardised
coefficient
Standardised.
coefficient
Std. Error t p Value 95% CI
Constant -0.000 - 0.000 -0.68 0.498 -0.000 ~ 0.000
Likes 0.400 1.000 0.000 31135450 0.000** 0.400 ~ 0.400
Share Rate 0.300 0.000 0.000 1659897 0.000** 0.300 ~ 0.300
Comment Rate 0.300 0.000 0.000 53750 0.000** 0.300 ~ 0.300
R
2
1.000
Adjust R
2
1.000
F Test
F (3, 95) = 3.398, p = 0.000
D-W
1.995
Note: Dependent Variable = User Engagement
*
p
< 0.05 **
p
< 0.01
IAMPA 2025 - The International Conference on Innovations in Applied Mathematics, Physics, and Astronomy
362

Analysis of the results of the OLS regression model
found that. Likes, Share Rate and Comment Rate all
have a significant positive effect on user engagement,
but the model R²=1.000 suggests that there may be a
risk of overfitting; the F-test and the Durbin-Watson
test verify the overall significance of the model and
the residuals' no-autocorrelation property,
respectively (Table 2). The unstandardised regression
coefficient of the number of likes, β=0.400, indicates
that when the number of likes increases by 1 unit, user
engagement increases by 0.400 units on average. The
coefficients of β = 0.300 for both share rate and
comment rate indicate that user engagement increases
by 0.300 units for each 1-unit increase in both. The p-
values for all three are less than 0.01, indicating that
the coefficients are highly statistically significant.
The standardised coefficients show that the number
of likes has the greatest impact, while the
standardised values of sharing rate and comment rate
are zero, which may be due to multicollinearity
between the variables causing distortion in the
standardised results. This model verifies the positive
contribution of the number of likes, shares and
comments to user engagement, with the number of
likes having the greatest impact; however, the high R²
and the zero standardised coefficient suggest the risk
of overfitting and multicollinearity, which can be
improved in subsequent studies by increasing the
sample size, eliminating covariates, or adopting
regularisation methods.
4 CONCLUSION
Overall, based on the user interaction data of TikTok
provided by Kaggle, three core indicators, namely,
the number of likes, the retweet rate and the comment
density, were selected to analyse their effects on user
engagement through the least squares regression
(OLS) method. The results show that all three
variables are significantly positively correlated with
user engagement, and the model R² is as high as
1.000, indicating that the variables can fully explain
the changes in user engagement without
multicollinearity or autocorrelation problems, and
have good statistical stability. Among them, the
regression coefficient of the liking behaviour is 0.400,
which has the most significant impact, and the
forwarding rate and comment density are both 0.300,
indicating that all three play a key role in enhancing
the content dissemination effect. The model not only
provides quantitative reference for the optimisation of
platform recommendation mechanism but also
provides a theoretical basis for the formulation of
short video content operation strategy. Meanwhile,
although this study combines multi-dimensional data,
the data is still not rich enough. In future research,
more dimensional variables, such as video content
type, release time, audience profile, etc., can be
introduced to further enrich the structure of the
model; at the same time, non-linear models such as
machine learning can be combined to improve the
prediction accuracy and adaptability to the reality, in
order to more comprehensively reveal the
behavioural mechanisms behind the dissemination of
short videos.
REFERENCES
Chen, L., Wang, X., Wang, P., Ma, X. 2021. Cancer
communication and user engagement on Chinese social
media: Extracting topics using text analytics. Journal of
Medical Internet Research.
Cheng, Z. 2024. Like, comment, and share on TikTok:
Exploring the effect of sentiment and second-person
view on the user engagement with TikTok news videos.
Master’s thesis, University of Arizona.
Liu, C., Jiang, M., Muhammad, Z. A. 2024. The impact of
tiktok short video factors on tourists' behavioral
intention among generation z and millennials: the role
of flow experience. PLoS ONE, 19(12).
Liu, H. 2024. Analysis of the influence of TikTok short
video platform on user. Bachelor’s thesis, Inner
Mongolia Normal University. News and
Communication.
Sun, G. M., Wang, S., Zhang, Y., Liu, Y., Gao, J., Xie, Q.
2023. Behavior analysis of user interaction on online
short video platform. J. Comput. Inf. Technol., 30, 51-
65.
Zhang, M., Long, B., Shao, X., Liu, Y., Zhang, Y. 2022.
Formation mechanism of short video app users’
willingness to continuously use and its governance
outlook: Based on the analytical perspective of mimetic
companionship. Modern Intelligence, 41(07), 49-59.
Zhang, S., Wang, W., Xie, Y. 2021. Evolutionary law and
power mechanism of continuous participation behavior
of online health community users. Modern Intelligence,
41(05), 59-66.
Zhang, X., Wu, J., Liu, S. 2019. Analysis of influencing
factors of browsing and creating behavior of mobile
short video users. Library and Intelligence Work,
63(06), 103–115.
Zhang, Y. 2023. Study on the influencing factors of public
participation in political short video: Taking political
Jitterbug number as an example. Master’s thesis, Hebei
University of Technology.
Zheng, Z., Lu, C., Zhao, W. 2023. Study on the influence
of douyin short video marketing on camping travel
intention. SHS Web of Conferences, 179(000), 5.
Quantitative Analysis of Short Video Dissemination Effects: Based on the Likes, Share Rate and Comment Density
363
