
Research on the Prediction Models Based on Mobiles Dataset
Haoning Li
1a
, Zhexi Wang
2b
and Haoxuan Yang
3,* c
1
Beijing No.161 Middle School, Beijing, 100031, China
2
International Department of Hefei No. 8 Middle School, Kuanghe Campus, Hefei, 230031, China
3
International Digital Economy College, Minjiang University, Fuzhou, 350108, China
Keywords: Smartphone Market Trends, Multivariate Linear Regression, Random Forest, RMSE.
Abstract: This study utilizes multivariate linear regression (MLR) and random forest (RF) models to predict smartphone
market trends, analyzing a dataset of 930 models with specifications like Random Access Memory (RAM),
cameras, battery capacity, and regional prices. The goal is to decode how hardware features and pricing
strategies influence market dynamics, offering data-driven insights for industry stakeholders. MLR was
applied to explore linear relationships between features and China launch prices, while RF modeled non-
linear patterns. The dataset was split into 80% training and 20% test subsets, evaluated via R² and RMSE.
Feature importance in RF highlighted key predictors. Findings show MLR identifies RAM, mobile weight,
and screen size as significant linear predictors but with limited explanatory power. RF outperforms,
demonstrating stronger training fit and generalization, with front camera and RAM as top drivers. Complex
interactions emerge, such as positive effects of screen size/weight and negative impacts of battery capacity
on prices. Conclusively, RF excels in capturing non-linear trends, while MLR provides foundational linear
insights. Both models underscore RAM, camera specs, and screen size as critical pricing determinants. The
results guide manufacturers in feature prioritization and pricing strategies, with R² and RMSE validating
model robustness for market trend analysis. These insights enhance data-informed decision-making in the
dynamic smartphone industry.
1 INTRODUCTION
In an era marked by rapid technological advancement
and intense competition in consumer electronics, the
smartphone industry faces growing pressure to
decipher how hardware specifications and pricing
strategies shape market trends. With billions of
devices sold globally each year, the ability to predict
consumer preferences and price dynamics has
become critical for manufacturers, investors, and
policymakers alike. Social trends such as the rise of
mobile photography, remote work-driven demand for
multitasking performance, and sustainability
concerns have further complicated this landscape,
necessitating sophisticated analytical tools to unravel
complex relationships between features and market
a
https://orcid.org/0009-0008-7307-7013
b
https://orcid.org/0009-0006-6459-3142
c
https://orcid.org/0009-0005-4568-536X
outcomes (Wang et al., 2018; Everingham et al.,
2016).
Within the academic and industrial research
domain, smartphone market analysis has increasingly
relied on data-driven models to address these
challenges. Traditional approaches like multivariate
linear regression (MLR) have provided foundational
insights into linear associations, such as the impact of
screen size or Random Access Memory (RAM) on
launch prices (Uyanık and Güler, 2013). For example,
studies applying MLR to single-region datasets have
identified significant linear relationships between
hardware features and pricing, though these models
often suffer from limited explanatory power due to
their reliance on linear assumptions and inability to
capture non-linear interactions (Čeh et al., 2018). In
contrast, machine learning algorithms like random
forest (RF) have emerged as powerful alternatives in
348
Li, H., Wang, Z. and Yang, H.
Research on the Prediction Models Based on Mobiles Dataset.
DOI: 10.5220/0013825600004708
Paper published under CC license (CC BY-NC-ND 4.0)
In Proceedings of the 2nd International Conference on Innovations in Applied Mathematics, Physics, and Astronomy (IAMPA 2025), pages 348-354
ISBN: 978-989-758-774-0
Proceedings Copyright © 2025 by SCITEPRESS – Science and Technology Publications, Lda.

fields ranging from traffic forecasting to agricultural
yield modeling, demonstrating superior performance
in handling high-dimensional data and non-linear
patterns (Liu and Wu, 2017). In the smartphone
context, RF has been used to prioritize feature
importance, such as identifying camera resolution and
processor speed as key drivers of price variation
while mitigating overfitting risks (Smith et al., 2013).
Despite these advancements, several research
gaps persist. Most studies focus on single markets,
overlooking how consumer priorities for hardware
features differ across regions-for instance, price
sensitivity to RAM in emerging markets versus a
premium placed on camera quality in developed
economies (Hengl et al., 2018). Additionally, the
comparative utility of MLR and RF in a hybrid
modeling framework remains underexplored,
limiting insights into how linear and non-linear
approaches can complement each other. Existing
literature also often neglects to analyze interactions
between multi-faceted features (e.g., battery capacity
and screen size), which collectively influence pricing
strategies in ways that linear models cannot capture
(Grömping, 2009; Kalaivani et al., 2021).
This study addresses these gaps by systematically
comparing MLR and RF models using a
comprehensive dataset of 930 smartphone models
across five regions (China, USA, Pakistan, India,
Dubai). The research integrates MLR’s
interpretability with RF’s capability to handle
complex interactions, aiming to identify key drivers
of price variation, evaluate model performance in
capturing regional market nuances, and provide data-
driven guidance for feature optimization and pricing
strategies. By leveraging both methodologies, the
study bridges traditional econometric approaches
with modern machine learning to offer a more holistic
understanding of market dynamics.
The significance of this work lies in its dual
contributions to theory and practice. Theoretically, it
advances understanding of how hybrid modeling can
enhance predictive accuracy in technology markets,
where feature interactions and regional variations are
prevalent (Smith et al., 2013). Practically, the study
offers manufacturers actionable insights into regional
preferences-such as prioritizing camera upgrades in
premium markets or optimizing battery capacity in
cost-sensitive regions-using metrics like Root Mean
Squared Error (RMSE) to validate model robustness
(Wang et al., 2018). Its novelty resides in the
integration of multi-regional data, systematic
comparison of MLR and RF, and focus on feature
interactions, which have been understudied in prior
research (Speiser et al., 2019).
Guided by these objectives, the study addresses
three key research questions: What linear
relationships exist between hardware features and
prices in diverse markets? How effectively can RF
models capture non-linear patterns and regional
nuances? And which model demonstrates superior
generalizability across different market conditions?
To answer these, the research employs MLR to assess
linear associations and RF to model non-linear
interactions, using an 80% training–20% test dataset
split and feature importance analysis. This approach
rigorously evaluates both models’ strengths in
capturing market dynamics, from linear trends in
RAM and screen size to non-linear synergies between
camera quality and processor performance (Liu and
Wu, 2017).
These results not only provide data-driven support
for manufacturers to optimize regional pricing
strategies (e.g., emphasizing RAM cost-effectiveness
in emerging markets and camera innovation in
premium segments) but also offer methodological
references for academia by validating the synergistic
value of traditional econometrics and machine
learning in technology market analysis through
comparative metrics like R² and RMSE. Future
research could further expand to cross-annual
dynamic data to explore the impact of technology
iteration cycles on model stability, or incorporate
unstructured data such as consumer sentiment
analysis to more comprehensively reveal the driving
forces behind market trends. The analytical
framework established in this study is expected to
facilitate the smart hardware industry in forming a
closed loop of "data insight-strategy optimization-
market validation," enabling enterprises to achieve
precise product positioning and resource allocation in
rapidly evolving global competition.
2 METHODOLOPGY
2.1 Data Source
This paper found some data from Kaggle to explore
factors that influence phone prices. The dataset
involves 930 samples. The research concentrates on 6
factors: “Front camera”, “Back camera”, “Processor”,
“Mobile weight”, “Screen size” and “Battery
capacity”.
2.2 Multiple Linear Regression
The Multiple Linear Regression (MLR) model is used
in the predictive research to forecast the phone price.
Research on the Prediction Models Based on Mobiles Dataset
349
This paper primarily constructs the general form of
MLR.
𝑌=𝛽
𝛽
𝑋
𝛽
𝑋
⋯𝛽
𝑋
𝜖 (1)
This equation predicts the price of different phones in
China. In this equation, Y is the price of the phone.
X
,…,X
are the feature variables such as back
camera, screen size, etc. β
is the intercept term,
representing the expected value of the phone
price when all feature variables are
zero. β
,…,β
are the regression coefficients,
representing the change in the phone price for a one-
unit change in the corresponding independent
variable, holding all other variables constant.ϵ is the
error term, accounting for the variability in phone
price not explained by the independent variables. It is
assumed to be normally distributed with mean zero
and constant variance.
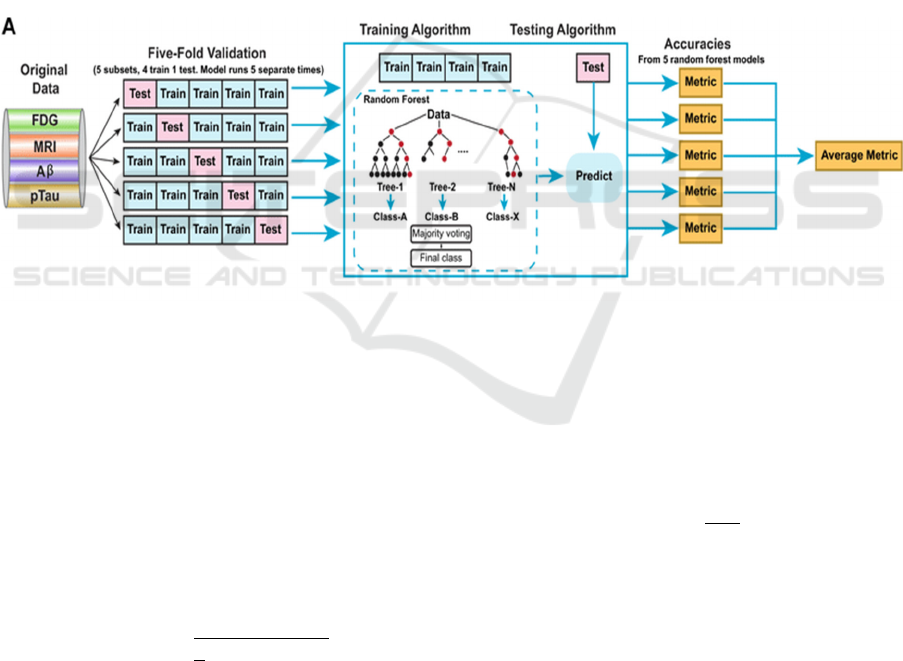
2.3 Random Forest
The random forest primarily inputs data from the
original training dataset. Secondly, it generates k
subsets by random sampling with replacement (each
subset = N samples with some of them repeated). For
each of the subsets, a decision tree is constructed by
recursively splitting nodes based on random selection
to choose m features by using Gini impurity or Mean
Squared Error (MSE) criteria. When all k trees are
built, the outputs are aggregated to make predictions:
majority voting for classification or averaging for
regression. Finally, the model adapts to training and
reduces the variance while maintaining low bias.
Figure 1 shows the process (Wang et al., 2018).
Figure 1: Flow chart of the random forest method (Wang et al., 2018)
2.4 Evaluation Parameters
Formula 2 is Root Mean Squared Error (RMSE).
Here, N is the number of data points. represents the
actual phone price value at the 𝑖 -th point,
and represents the phone price value predicted by the
regression tree at the 𝑖-th point. RMSE is used to
assess the error of the regression tree in predicting
phone prices. It has the same unit as the phone price,
which makes it convenient for directly gauging the
average magnitude of the prediction error in the
context of phone price values.
𝑅𝑀𝑆𝐸 =
∑
𝑦
−𝑦
(2)
Formula 2 is the coefficient of determination. The
Sum of Squares of Residuals (𝑆𝑆
) represents the
sum of the squared differences between the observed
phone price values and the values predicted by the
model. Total Sum of Squares (𝑆𝑆
) is the sum of the
squared differences between the observed phone
price values and the mean of the observed phone price
values. R² is used to measure the proportion of the
phone price fluctuation that the model can explain. Its
value ranges from 0 to 1. The closer R2 is to 1, the
better the model fits the data, indicating that a larger
proportion of the variability in phone prices is
accounted for by the model.
𝑅
=1−
(3)
3 RESULTS AND DISCUSSION
3.1 Multiple Linear Regression Results
After the datasets had been input, SPSSAU produced
the results in Table 1:
IAMPA 2025 - The International Conference on Innovations in Applied Mathematics, Physics, and Astronomy
350

Table 1: Results of Linear Regression
Non-normalized
coefficients
Normalization
facto
r
t p
Colinearity
diagnosis
B Standard Erro
r
Beta VIF Tolerance
constant 112.992 7.379 - 15.312 0.000** - -
RAM -3.518 0.446 -0.246 -7.887 0.000** 1.132 0.884
Front Camera -0.646 0.169 -0.119 -3.830 0.000** 1.118 0.895
Back Camera -0.240 0.043 -0.171 -5.546 0.000** 1.106 0.904
Processor -0.021 0.017 -0.036 -1.187 0.235 1.062 0.941
Mobile Weight 0.283 0.045 0.217 6.336 0.000** 1.363 0.734
Screen Size 0.136 0.065 0.071 2.106 0.035* 1.306 0.766
Battery Capacity -0.277 0.042 -0.226 -6.591 0.000** 1.372 0.729
R² 0.207
Adjust R² 0.201
F F (7,922)=34.320,p=0.000
D-W values 1.419
* p<0.05 ** p<0.01
The linear regression analysis in Table 1 examines the
relationship between smartphone launch prices in
China (dependent variable) and seven independent
variables: RAM, Front Camera, Back Camera,
Processor, Mobile Weight, Screen Size, and Battery
Capacity. The model equation is defined
as 𝐿𝑎𝑢𝑛𝑐ℎ𝑒𝑑 𝑃𝑟𝑖𝑐𝑒 = 112.992 − 3.518𝑅𝐴𝑀 −
⋯ − 0.277𝐵𝑎𝑡𝑡𝑒𝑟𝑦 𝐶𝑎𝑝𝑎𝑐𝑖𝑡𝑦.
With an R-squared value of 0.207, these variables
collectively explain 20.7% of the variation in prices.
The model’s statistical significance is confirmed by
the F-test (F = 34.320, p < 0.05), indicating that at
least one of the predictors significantly influences the
price.
Further analysis of individual coefficients reveals
distinct patterns. RAM shows a significant negative
effect (coefficient = -3.518, t = -7.887, p < 0.01),
suggesting that higher RAM configurations correlate
with lower prices. Similarly, Front Camera
(coefficient = -0.646, t = -3.830, p < 0.01), Back
Camera (coefficient = -0.240, t = -5.546, p < 0.01),
and Battery Capacity (coefficient = -0.277, t = -6.591,
p < 0.01) also demonstrate significant negative
relationships, implying that advancements in camera
technology or battery capacity may unexpectedly
reduce market prices. In contrast, Mobile Weight
(coefficient = 0.283, t = 6.336, p < 0.01) and Screen
Size (coefficient = 0.136, t = 2.106, p < 0.05) exhibit
positive effects, indicating that heavier devices or
larger screens are associated with higher prices.
However, the Processor’s coefficient (coefficient = -
0.021, t = -1.187, p = 0.235) is statistically
insignificant, showing no measurable impact on
pricing.
At the same time, the table shows that the model
has an R-squared value of 0.207, indicating that
RAM, Front Camera, Back Camera, Processor,
Mobile Weight, Screen Size, and Battery Capacity
collectively explain 20.7% of the variation in
Launched Price (China). This suggests that these
variables account for a moderate proportion of the
observed price differences, while the remaining
variation is likely influenced by factors not included
in the model. In addition, the values of the VIF of
these seven variables are all less than 5, which means
that there is no relevance between these variables.
This means the model has no collinearity problem.
Also, the p-values of these variables are all smaller
than 0.05, which means the results of the model are
meaningful.
In summary, Mobile Weight and Screen Size
positively influence smartphone prices, while RAM,
Front Camera, Back Camera, and Battery Capacity
exert significant negative effects. The Processor’s
role, however, remains negligible within this model.
These results highlight the complex interplay of
hardware features in pricing strategies, with certain
technological improvements paradoxically linked to
cost reductions, potentially reflecting market trends
or consumer preferences not captured by the model.
3.2 Random Forest Results
After the input of the same datasets of mobile markets
in 2025 from Kaggle, with the same independent
variables selected, SPSSAU has formed the results
automatically in Table 2:
Research on the Prediction Models Based on Mobiles Dataset
351

Table 2: Feature Weight Values
Item Weight value
Mobile Weight 0.123
RAM 0.202
Front Camera 0.215
Back Camera 0.072
Processor 0.189
Batter
y
Ca
p
acit
y
0.074
Screen Size 0.124
The feature weights, which represent the relative
importance of each variable in contributing to the
model and sum to a total value of 1, demonstrate the
following distribution based on the table. The Front
Camera holds the highest weight at 21.50%,
indicating its critical role in shaping the model's
outcomes. Following closely, RAM accounts for
20.21%, making it the second most influential feature
in the model's construction. The Processor and Screen
Size contribute 18.91% and 12.44%, respectively.
Combined, these four features-Front Camera, RAM,
Processor, and Screen Size-collectively represent
73.05% of the total weight, underscoring their
dominant impact on the model. In contrast, the
remaining three variables-Mobile Weight, Battery
Capacity, and Back Camera-show comparatively
lower contributions, with weights of 12.33%, 7.42%,
and 7.20%, respectively, totalling 26.95%. This
distribution highlights the disproportionate influence
of camera specifications, processing components, and
display size in determining the model's predictions,
while factors such as physical device weight and
battery capacity play a relatively minor role.
Table 3: Model Evaluation Results
Index Training set Test set
R-s
q
uare
d
value 0.931 0.578
Mean absolute error value MAE 5.768 14.481
Mean square error (MSE). 102.757 654.613
Root mean square error RMSE 10.137 25.585
Median absolute error MAD 3.316 7.353
Mean absolute
p
ercenta
g
e error MAPE 3.197 2.078
Interpretable variance EVS 0.931 0.580
Root mean square logarithmic error MSLE 0.163 0.476
Table 3 presents the evaluation results of the random
forest model, where the model’s generalization
capability and goodness-of-fit are comprehensively
assessed using the metrics listed in the table. This
study systematically analyzes the statistical
characteristics and potential issues of the random
forest model implemented in SPSSAU based on its
performance across training and test datasets. As
shown in the table, the training set achieves a high R-
squared value (0.931) and an explained variance
score (EVS, 0.931), indicating that the model
captures approximately 93.1% of the variance in the
training data. However, the test set’s R-squared value
drops significantly to 0.578, accompanied by a
marked increase in mean squared error (MSE) from
102.757 to 654.613 and a rise in root mean squared
error (RMSE) from 10.137 to 25.585. These results
strongly suggest the presence of overfitting, where
the model excessively adapts to the training data but
fails to generalize effectively to unseen data. This
issue is further corroborated by the substantial
discrepancy in mean absolute error (MAE) between
the training set (5.768) and the test set (14.481).
From the perspective of error distribution
robustness, the median absolute deviation (MAD)
increases from 3.316 in the training set to 7.353 in the
test set, reflecting a broader deviation in the central
tendency of predictions. Notably, the mean absolute
IAMPA 2025 - The International Conference on Innovations in Applied Mathematics, Physics, and Astronomy
352

percentage error (MAPE) decreases to 2.078% in the
test set (compared to 3.197% in the training set),
which may be attributed to reduced sensitivity of the
percentage-based metric to outliers due to
heterogeneous error distributions. Additionally, the
mean squared logarithmic error (MSLE) rises from
0.163 to 0.476, highlighting the model’s amplified
penalty for underpredicted samples in the test set and
further exposing its limited generalization capacity.
From a statistical inference standpoint, while the test
set’s R-squared value remains above 0.5-indicating
residual explanatory power, the model requires
refinement through regularization or feature
optimization to mitigate overfitting. In conclusion,
model evaluation must holistically balance goodness-
of-fit and generalization performance, avoiding
reliance on singular metrics, thereby ensuring reliable
engineering applications of probabilistic and
statistical models.
3.3 Comparison Results
Table 4 compares the predictive performance of the
Random Forest and Linear Regression models. The
Random Forest model achieves an R² (coefficient of
determination) of 0.578, indicating that it explains
approximately 57.8% of the variation in the target
variable. In contrast, the Linear Regression model
yields a substantially lower R² of 0.207, accounting
for only 20.7% of the data variability. This disparity
highlights the superior ability of the Random Forest
to capture complex relationships within the data,
likely due to its ensemble learning approach, such as
aggregating predictions from multiple decision trees,
and its flexibility in modelling nonlinear patterns.
Table 4: Comparison of Model Evaluation Results
Models
R²
RMSE
Random Forest 0.578 25.585
Linear Regression 0.207 34.578
Regarding prediction accuracy, the Random Forest
model demonstrates a Root Mean Squared Error
(RMSE) of 25.585, which is notably lower than the
Linear Regression model’s RMSE of 34.578. The
34% reduction in RMSE underscores the Random
Forest’s higher precision, making it more suitable for
scenarios requiring tight error margins. For instance,
in predicting smartphone prices, the Random Forest’s
smaller error range could translate to more reliable
pricing strategies compared to Linear Regression,
which may struggle with real-world data complexities
due to its rigid assumption of linear relationships
between variables.
4 CONCLUSION
This study set out to investigate the factors driving
smartphone launch prices in China by applying two
predictive models: Multiple Linear Regression and
Random Forest. The analysis showed that the
Random Forest model was better than the Linear
Regression model at predicting smartphone launch
prices in China. The Random Forest model had an R²
value of 0.578 and an RMSE of 25.585, while the
Linear Regression model had an R² of 0.207 and an
RMSE of 34.578. This means the Random Forest
model is good at finding complex, non-linear
connections between variables like RAM, camera
specifications, and screen size, which are important
for smartphone prices. On the other hand, the Linear
Regression model assumes a simple linear connection
between variables, which made it less effective at
explaining the data, as shown by its lower R² value.
However, the Random Forest model’s R² of 0.578
shows that 42.2% of the price differences are still not
explained. This suggests other factors, such as brand
reputation, market demand, or software features,
might also affect prices but were not included in the
model. Also, the Random Forest model had a problem
with overfitting, as it performed much better on the
training set (R² of 0.931) than on the test set. To
improve predictions, future studies could add more
variables or test other methods, like Gradient
Boosting. In summary, this study shows that
predicting smartphone prices in China is challenging
and needs more research to understand all the
influencing factors.
AUTHORS CONTRIBUTION
All the authors contributed equally and their names
were listed in alphabetical order.
REFERENCES
Čeh, M., Kilibarda, M., Lisec, A., Bajat, B. 2018.
Estimating the performance of random forest versus
multiple regression for predicting prices of the
apartments. ISPRS international journal of geo-
information, 7(5), 168.
Research on the Prediction Models Based on Mobiles Dataset
353

Everingham, Y., Sexton, J., Skocaj, D., Inman-Bamber, G.
2016. Accurate prediction of sugarcane yield using a
random forest algorithm. Agronomy for sustainable
development, 36, 1-9.
Grömping, U. 2009. Variable importance assessment in
regression: linear regression versus random forest. The
American Statistician, 63(4), 308-319.
Hengl, T., Nussbaum, M., Wright, M.N., Heuvelink, G.B.,
Gräler, B. 2018. Random forest as a generic framework
for predictive modeling of spatial and spatio-temporal
variables. PeerJ, 6, 5518.
Kalaivani, K.S., Priyadharshini, N., Nivedhashri, S.,
Nandhini, R. 2021. Predicting the price range of mobile
phones using machine learning techniques. In AIP
Conference Proceedings, 2387.
Liu, Y., Wu, H. 2017. Prediction of road traffic congestion
based on random forest. In 2017 10th international
symposium on computational intelligence and design
(ISCID), 2, 361-364.
Smith, P.F., Ganesh, S., Liu, P. 2013. A comparison of
random forest regression and multiple linear regression
for prediction in neuroscience. Journal of neuroscience
methods, 220(1), 85-91.
Speiser, J.L., Miller, M.E., Tooze, J., Ip, E. 2019. A
comparison of random forest variable selection
methods for classification prediction modeling. Expert
systems with applications, 134, 93-101.
Uyanık, G.K., Güler, N. 2013. A study on multiple linear
regression analysis. Procedia-Social and Behavioral
Sciences, 106, 234-240.
Wang, Z., Wang, Y., Zeng, R., Srinivasan, R.S., Ahrentzen,
S. 2018. Random Forest based hourly building energy
prediction. Energy and Buildings, 171, 11-25.
IAMPA 2025 - The International Conference on Innovations in Applied Mathematics, Physics, and Astronomy
354
