
Comparison of Prediction Models for Heart Failure Related Data
Haoyang Zhang
a
Data Science, Capital University of Economics and Business, Beijing, 102627, China
Keywords: Logistic Regression, Random Forest, K-Nearest Neighbour, Heart Failure.
Abstract: Using the Heart Failure Clinic Records Dataset from Kaggle, this study assesses how well three machine
learning models-Logistic Regression, Random Forest, and K-Nearest Neighbours-predict mortality events
associated to heart failure. The dataset includes 299 patients with 12 clinical features such as ejection fraction,
serum creatinine, platelet counts, and smoking history. To guarantee reliable model training, data pretreatment
addressed outliers, missing values, and scalability concerns. For feature selection, Principal Component
Analysis (PCA) was employed to reduce dimensionality while preserving crucial data. The model's
performance was assessed using metrics of accuracy, precision, recall, and F1 score; cross-validation was
employed to ensure generalizability. According to the results, the Random Forest model outperforms K-
Nearest Neighbours (0.786) and Logistic Regression (0.812) by achieving the best accuracy of 0.907. The
Random Forest also shows superior precision (0.92) and recall (0.89), effectively balancing false positives
and negatives. The promise of machine learning in predictive healthcare is demonstrated by this work,
especially in identifying high-risk individuals for early intervention. The results highlight how well ensemble
techniques like Random Forest handle complicated clinical data and offer guidance for incorporating machine
learning into future studies and clinical practices.
1 INTRODUCTION
Many different types of people can be afflicted with
heart failure. With a frequency of 1 to 3 percent in the
average adult, it is a global pandemic that affects 64
million people globally and is more likely to occur in
developed nations (Savarese et al., 2023; Norhammar
et al., 2023). And it is a very challenging disease to
manage and treat effectively. Within 30 days
following release, over 25% of patients with heart
failure are readmitted (Khan, 2021; Javeed et al.,
2022). Therefore, the best way to reduce mortality
from heart failure is prevention. Numerous systematic
studies show that patients with heart failure are
readjusted not only due to deteriorating symptoms but
also because of psychological variables such
depression, multimorbidity, older age, and non-
adherence to treatment (Retrum et al., 2013). To
avoid risk factors comprehensively, predictive
modeling research is necessary.
A medical disease known as heart failure occurs
when the heart cannot adequately pump blood to
fulfill the body's metabolic demands. There are four
kinds of this complicated clinical syndrome: systolic
a
https://orcid.org/0009-0002-8883-1353
dysfunction, diastolic dysfunction, right heart failure,
and left heart failure. When the left heart fails, the
arterial system does not get enough blood, which
causes pulmonary hypertension and breathing
difficulties. Nausea and vomiting are symptoms of
right heart failure, which is caused by the heart's right
ventricle's inability to adequately pump blood to the
lungs for oxygenation. Systolic and diastolic
dysfunction have the characteristics of losing part of
the functional muscle of the ventricle, unable to
effectively contract and ejection, and increasing
diastolic filling pressure, which will work together to
produce dyspnea, palpitation and fatigue (Rockwell,
1999).
Heart failure ranks sixth globally and is one of the
top causes of mortality, according to the World
Health Organization's (WHO) Global Health
Estimates report. About 1.5 million people die each
year from heart failure, accounting for 2.5 percent of
all deaths worldwide (Forouzanfar et al., 2017). Heart
failure has been researched for many years and is
linked to low survival, frequent hospitalizations, and
a poor quality of life (Ho et al., 1993). Therefore,
accurate prediction of heart failure is very important
to prevent heart failure. In this context, many scholars
324
Zhang, H.
Comparison of Prediction Models for Heart Failure Related Data.
DOI: 10.5220/0013825200004708
Paper published under CC license (CC BY-NC-ND 4.0)
In Proceedings of the 2nd International Conference on Innovations in Applied Mathematics, Physics, and Astronomy (IAMPA 2025), pages 324-330
ISBN: 978-989-758-774-0
Proceedings Copyright © 2025 by SCITEPRESS – Science and Technology Publications, Lda.

have used machine learning methods for more
accurate prediction.
Scholars such as Javeed Ashir et al. have utilized
machine learning to predict heart failure (Javeed et
al., 2022). They analyzed the study using different
mechanical models. These include, but are not
restricted to, Random Forest (RF), logistic regression,
support vector machines (SVM), convolutional
neural networks (CNN), and recurrent neural
networks (RNN). To decrease data dimensionality
and increase model accuracy, they also use a variety
of approaches (principal component analysis (PCA),
independent component analysis (ICA), etc.) to
extract and choose important features. This paper
summarizes several public datasets, such as
University of California, Irvine (UCI) Heart Disease
dataset, Cleveland dataset, StatLog dataset, etc.
Accuracy, Sensitivity, Specificity and other
indicators were used to evaluate the model
performance.
However, the role of machine learning in self-
management for heart failure patients has not been
adequately explored. Sheojung and many other
scholars compared ML and statistical regression
models for predicting prognosis of heart failure
patients. They believe that ML methods have more
advantages than statistical regression models.
Because ML method gets higher c-indices. However,
from the perspective of epidemiological evaluation of
clinical prediction models, the quality of currently
available ML-based prediction models remains
suboptimal (Shin et al., 2019).
This research compares the accuracy differences
of K-Nearest Neighbors, Random Forest, and
Logistic Regression models in predicting heart
failure. This study aims to provide insights and
references for heart failure research and treatment.
2 METHODOLOGY
2.1 Data Source
The data used in this study were obtained from
Kaggle. The data set used in this study is called the
Heart Failure Prediction Data Set and is owned by
Larxel. This dataset has been widely used in the field
of healthcare research, especially related to heart
failure prediction and analysis.
This dataset received a usability rating of 10.0,
indicating its high quality and reliability for research
purposes. It was downloaded 158994 times, reflecting
its popularity and usefulness among researchers and
practitioners. This dataset contains records from 299
participants and includes 12 clinical characteristics
such as age, sex, ejection fraction, serum creatinine,
and other relevant health measures. These
characteristics are commonly used in medical studies
to predict outcomes such as mortality or readmission
rates in patients with heart failure.
This dataset is particularly valuable for machine
learning and statistical modeling studies because it
provides a comprehensive set of clinical variables that
can be used to train and evaluate predictive models.
In addition, the structure and variables of the dataset
are very consistent with the objectives of this study.
2.2 Variables and Data Preprocessing
In the original dataset, there were 12 variables, and
the names and explanations of each variable are
shown in Table 1.
For data preprocessing, the normal range of serum
sodium is defined in medicine as 135-145 mEq/L.
Python code was used to remove outliers that fall
outside this range. This operation removes 15 rows of
serum sodium data with no more than 20% missing
values. At the same time, no variable in this paper has
more than 20% missing value, so there is no need to
reduce the variable.
The original dataset contains 12 clinical features,
which may introduce complexity and redundancy into
the prediction model. High dimensional data can lead
to overfitting, especially when some features exhibit
multicollinearity or weak correlation with the target
variable, DEATH_EVENT. Principal Component
Analysis (PCA) is used in this research to overcome
this problem by reducing the dimension while
keeping important information.
2.3 Machine Learning Models
Three models-the K-Nearest Neighbor model, the
Random Forest model, and the Logistic Regression
model-were employed for analysis in this work.
The logistic function is used by the logistic
regression model to simulate the likelihood of a
particular class or occurrence (Li, 2021). The formula
is given by:
𝑃
𝑌=1
|
𝑋
=
⋯
(1)
Where β
is the intercept, and β
,β
,…,β
are the
coefficients for the input features 𝑋
,𝑋
,…,𝑋
.
During training, a large number of decision trees
are constructed using an ensemble learning approach
called Random Forest, which independently
generates the mean prediction of each tree.
Comparison of Prediction Models for Heart Failure Related Data
325

Table 1: Attribute Information
Variables Explanation
Appendix
age Age of the patient
anaemia Whether the patient has anaemia
1 for yes, 0 for no
creatinine_phosphokinase Blood level of the CPK enzyme
diabetes Whether the patient has diabetes
1 for yes, 0 for no
ejection_fraction The proportion of blood that exits the heart
high_blood_pressure Whether the patient has hypertension
1 for yes, 0 for no
platelets Blood platelet count
serum_creatinine Level of serum creatinine in the blood
serum_sodium Level of serum sodium in the blood
Sex Gender of the patient
1 for male, 0 for female
Smoking Whether the patient smokes
1 for yes, 0 for no
time Duration of follow-up in days
DEATH_EVENT Whether the patient died
1 for yes, 0 for no
Each tree is trained on a random subset of the data.
Each tree is trained on a random sample of the data,
and at each split, a random subset of characteristics is
considered.
K-Nearest Neighbor is a non-parametric
regression and classification method. In both cases,
the k training examples that are closest to one another
in the feature space comprise the input. A class
membership is the result of categorization and is
decided by a majority vote of its neighbors. The
average of its neighbors' values is the result of
regression. The formula for the prediction is:
𝑦=
∑
𝑦
(2)
Where 𝑦
are the values of the K-Nearest Neighbors.
3 RESULTS AND DISCUSSION
3.1 Data Distribution
Figure 1 represents the histogram of the frequency
distribution of the 7 principal components. “Age” is
close to a normal distribution centered on the mean
age (60-70). There was a slight rightward deviation of
“platelets”, indicating an elevated platelet count in a
subset of patients. “Time” is clustered around the
median and the surface observation period is
balanced. Notably, “creatinine_phosphokinase”
showed a strong right skew, reflecting elevated
muscle or myocardial damage in a few cases.
“Serum_ creatinine” showed an extreme right
distribution, suggesting serious problems with renal
function in high-risk patients. “Ejection_fraction”
was left skewed due to reduced systolic function. The
close aggregation of “serum_sodium” confirmed the
rationality of the clinical values.
3.2 Logistic Regression Model
Table 2 represents the Variance Inflation Factor (VIF)
values. VIF is used to measure the strength of linear
correlation between independent variables, with
higher values indicating more severe collinearity. The
VIF value of "sex" is 2.75, which is the highest among
all features, but it is still in the safe range. The VIF
values of features in the table are all low, indicating
that each feature has good independence and is
suitable for direct use in logistic regression models.
Table 2: Components’ VIF Value
Feature VIF
a
g
e 1.079
anaemia 1.514
creatinine
_p
hos
p
hokinase 1.075
diabetes 1.408
e
j
ection
_
fraction 1.045
high_blood_pressure 1.393
p
latelets 1.055
serum_creatinine 1.024
serum
_
sodiu
m
1.023
sex 2.749
Smoking
time
2.067
1.076
IAMPA 2025 - The International Conference on Innovations in Applied Mathematics, Physics, and Astronomy
326
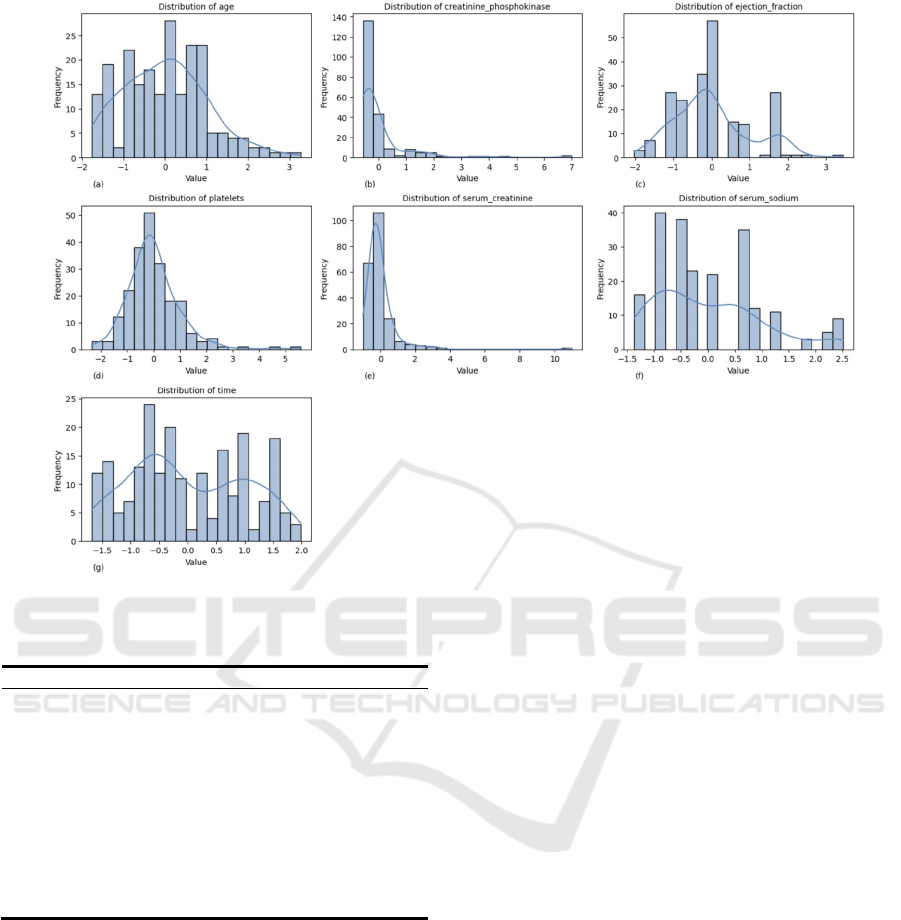
Figure 1: Histograms of the variable (Picture credit: Original)
Table 3: Logistic Regression Coefficient
Feature Coefficient
Interce
p
t -0.806
p
c1 -0.276
p
c2 0.723
p
c3 1.046
p
c4 -0.959
p
c5 -0.365
pc6
pc7
p
c8
0.372
0.504
0.941
pc9
p
c10
-0.477
-0.428
Table 3 represents the coefficients of each principal
component in the logistic regression model the impact
and strength of patient death. When all principal
components (pc1-pc10) are zero, the benchmark log
probability of the event is -0.806. This represents the
initial probability of an event occurring in the overall
data. Through observation, it can be found that pc3
(1.046) and pc8 (0.941) are strong positive driving
factors. pc4 (-0.960) is a strong negative driving
factor. The absolute values of the coefficients of pc1,
pc5, pc9, and pc10 are small (<0.5) and have a weak
impact on the results. Therefore, it can be concluded
that high serum creatinine and aging are the main
drivers of mortality risk, and the model results are
consistent with medical knowledge.
The confusion matrix generated by the established
model's predictions on the test set is shown in Figure
2. The computed accuracy is 0.791, meaning that the
model has an accuracy of around 79.07% for all
predictions. With a precision rate of 0.429, 42.86
percent of the instances that the model projected
would result in deaths are accurate. With a recall rate
of 0.857, the model was able to correctly identify
85.71% of the real fatalities. The accuracy rate and
recall rate performance are combined to get the F1
score of 0.571.
The confusion matrix shows that while the model
accurately forecasted 28 cases in which no death
event happened (TN), it mispredicted eight events as
deaths (FP). For the cases where a death event
occurred, the model correctly predicted six (TP), but
one was incorrectly predicted as no death (FN). It can
be concluded that the model performs well in
identifying actual death events but needs to be
improved in reducing false positives. In conclusion,
the model performed reasonably well in predicting
heart failure deaths, but there is still room for
improvement.
Comparison of Prediction Models for Heart Failure Related Data
327
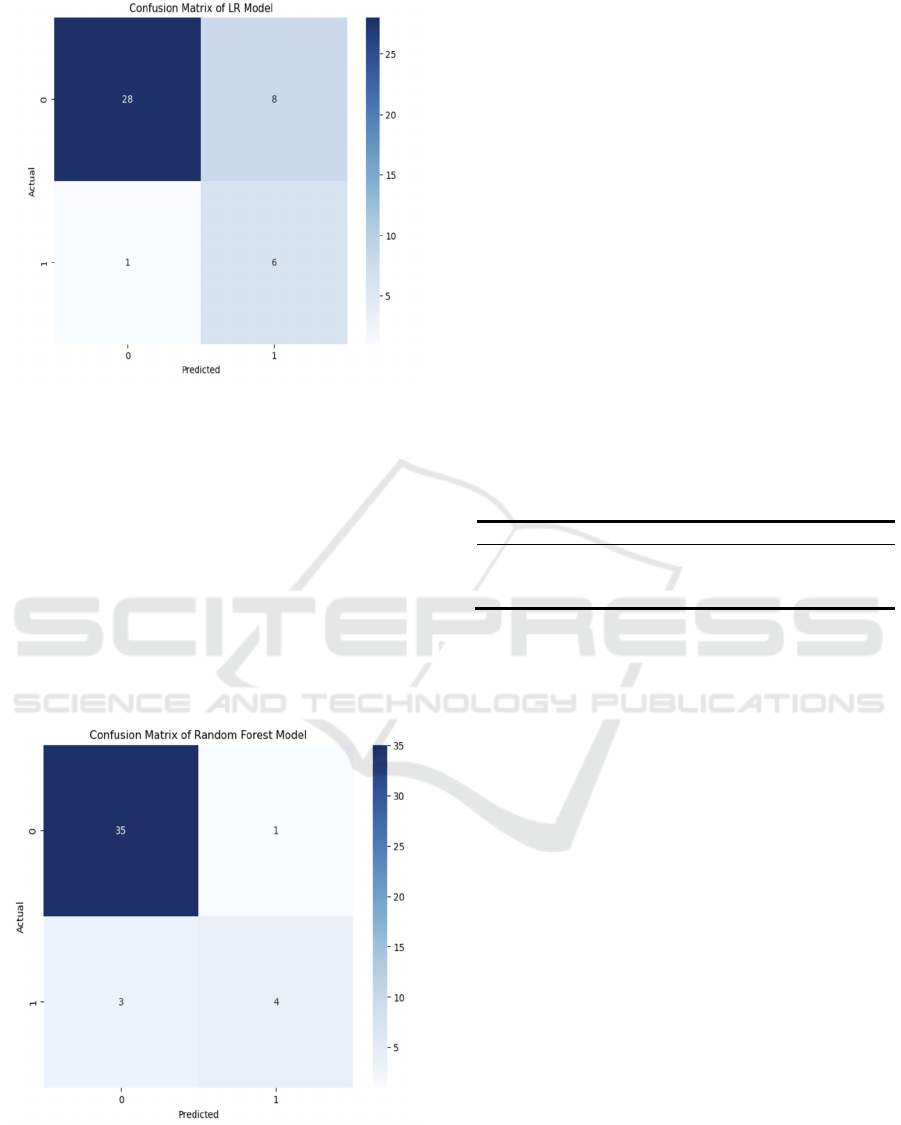
Figure 2: Confusion Matrix of LR Model (Picture credit:
Original)
3.3 Random Forest Model
Figure 3 represents the random forest model. Through
the model, the accuracy is 0.9070, indicating that the
model has a correct rate of about 90.70% in all
predictions. The precision rate of 0.800 means that
the model is correct in 80% of the cases predicted as
deaths. The recall rate is 0.571, indicating that the
model successfully identified 57.14% of the actual
deaths. The F1 score is 0.667, which combines
performance of precision and recall.
Figure 3: Confusion Matrix of RM (Picture credit: Original)
The confusion matrix demonstrates how well the
random forest model predicts the incidence of heart
failure deaths. The model correctly predicted 35 cases
with no death event (TN) and only one case was
incorrectly predicted as death (FP). For the cases
where a death event occurred, the model correctly
predicted four (TP), but three were incorrectly
predicted as no death (FN).
Overall, the model performs well in identifying
cases where no death event occurred, but there is
room for improvement in identifying actual deaths.
3.4 K-Nearest Neighbor Model
Table 4 shows the cross-validation table. In the
experiment, three k values of 5, 7 and 9 were selected.
The cross-validation results show that when k=5, the
average accuracy of the model is 0.766, which is the
highest value among the three test k values (5, 7, 9).
This shows that in multiple data divisions, the
performance of the model when k=5 is the most stable
and reliable.
Table 4: Resampling Results Across Tuning Parameters
K
Accurac
y
5 0.7663
7 0.7605
9 0.7549
The confusion matrix for the K-Nearest Neighbor
Model is shown in Figure 4. The confusion matrix
shows the model's accurate classification
performance on the test set. With an accuracy of
0.814, the model's efficacy under a particular data
partition is demonstrated. The matrix's values for
TP=2, TN=33, FP=3, and FN=5 show that the model
does a good job of recognizing the negative class
(non-events), but it makes some mistakes when
identifying the positive class (events). The precision
rate is 0.400, the recall rate is 0.286, and the F1 score
is 0.33. Despite the high accuracy, there is still room
for improvement in the performance of the model in
identifying positive classes.
IAMPA 2025 - The International Conference on Innovations in Applied Mathematics, Physics, and Astronomy
328
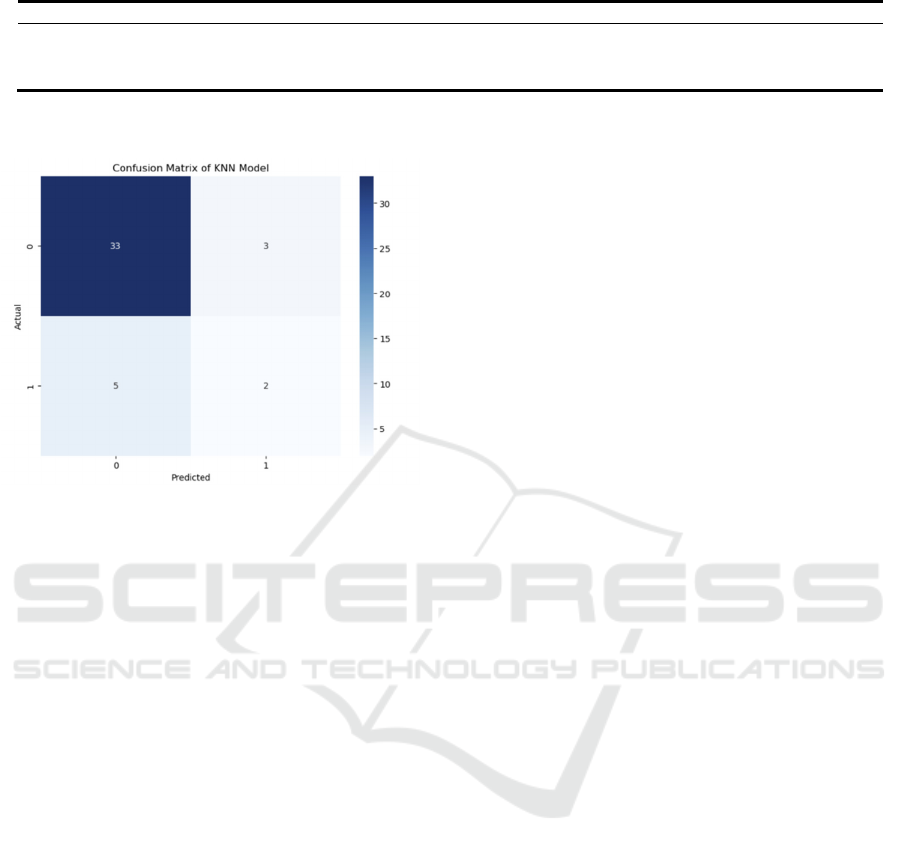
Table 5: Prediction Accuracy
Accurac
y
Precision Recall F1 Score
Logistic Regression 0.791 0.429
0.857 0.571
Random Forest 0.907 0.800 0.571 0.667
K-Nearest Neighbor 0.814 0.400 0.286
0.333
Figure 4: Confusion Matrix of KNN (Picture credit:
Original)
In evaluating the KNN model, this paper combines
both methods of confusion matrix and cross
validation. By combining both techniques, this paper
can both guarantee the accuracy of model selection
and learn more about how the model functions with
real data. While the accuracy of the confusion matrix
illustrates the model's impact on a particular test set,
the accuracy of cross-validation indicates the model's
capacity for generalization. These two techniques
enable people to evaluate the model's performance in
detail and present strong justifications for its
application.
3.5 Comparison
As can be seen from Table 5, this paper has found that
Random Forest is best model in predict heart failure
field.
Advantages: RF model has the advantage of high
accuracy and robustness. It is more effective in
dealing with high-dimensional data.
Disadvantages: RF model has a large amount of
calculation and slow operation speed. Moreover, the
model is relatively unintuitive and not easy to
understand.
4 CONCLUSION
In order to predict mortality events associated to heart
failure, this study examined the effectiveness of three
machine learning models: K-Nearest Neighbor,
Random Forest, and Logistic Regression. According
to the results, the Random Forest model had the best
prediction performance on the test set, with the
greatest accuracy of 0.907. This implies that the
Random Forest model is especially appropriate for
this dataset, most likely as a result of its proficiency
in managing intricate nonlinear connections and
feature interactions.
While the Random Forest model excels in
accuracy and robustness, it also presents challenges
such as high computational load and slower operation
speed. Additionally, the model's lack of intuitiveness
may pose interpretability issues in clinical settings.
Extending experimental samples should be the
main goal of future studies in order to improve the
findings' generalizability. Enhanced feature selection
techniques could further refine the models by
reducing dimensionality and minimizing redundancy.
Moreover, combining more mixed models or hybrid
approaches could potentially improve prediction
accuracy and address the limitations of individual
models.
There is great potential for improving diagnostic
effectiveness and facilitating individualized treatment
planning through the use of machine learning into
clinical procedures. Healthcare professionals may
prioritize high-risk patients for early intervention by
precisely predicting the consequences of heart failure,
which might improve patient outcomes and save
healthcare expenditures. Further research into model
interpretability and computational efficiency is also
warranted to ensure that these models are practical
and accessible for real-world clinical applications.
REFERENCES
Forouzanfar, M. H., Afshin, A., Alexander, L. T., Anderson,
H. R., Bhutta, Z. A., Biryukov, S., et al. 2017. Global,
regional, and national burden of cardiovascular diseases
for 10 causes, 1990–2015: A systematic analysis for the
Comparison of Prediction Models for Heart Failure Related Data
329

Global Burden of Disease Study 2015. The Lancet,
389(10075), 1599-1609.
Ho, K. K., Anderson, K. M., Kannel, W. B., Grossman, W.,
Levy, D. 1993. Survival after the onset of congestive
heart failure in Framingham Heart Study subjects.
Circulation, 88(1), 107-115.
Javeed, A., Khan, S. U., Ali, L., Ali, S., Imrana, Y., Rahman,
A., Asghar, M. Z. 2022. Machine learning-based
automated diagnostic systems developed for heart
failure prediction using different types of data
modalities: A systematic review and future directions.
Computational and Mathematical Methods in Medicine,
9288452.
Khan, M. S., Sreenivasan, J., Lateef, N., Abougergi, M. S.,
Greene, S. J., Ahmad, T., et al. 2021. Trends in 30- and
90-day readmission rates for heart failure. Circulation:
Heart Failure, 14(6), 450-458.
Li, J. 2021. Analysis of the dynamic positioning system of
a 152000 heavy duty shuttle oil tanker. Ship and Ocean
Engineering, 37(05), 56-59.
Norhammar, A., Bodegard, J., Vanderheyden, M., Tangri,
N., Karasik, A., Maggioni, A. P., et al. 2023. Prevalence,
outcomes and costs of a contemporary, multinational
population with heart failure. Heart, 109(6), 548-556.
Retrum, J. H., Boggs, J., Hersh, A., Wright, L., Main, D. S.,
Magid, D. J., et al. 2013. Patient-identified factors
related to heart failure readmissions. Circulation:
Cardiovascular Quality and Outcomes, 6(2), 171-177.
Rockwell, J. M. 1999. Heart failure. The American Journal
of Nursing, 99(10), 24BB–24HH.
Savarese, G., Becher, P. M., Lund, L. H., Seferovic, P.,
Rosano, G. M. C., Coats, A. J. S. 2023. Global burden
of heart failure: A comprehensive and updated review of
epidemiology. Cardiovascular Research, 118(10),
3272-3287.
Shin, S., Freitas, C., Abdel-Qadir, H. M., Mahendiran, M.,
Tomlinson, G. A., Epelman, S., Lawler, P. R., Billia, F.,
Gramolini, A., Austin, P. C., Ross, H. J., Lee, D. S. 2019.
Comparison of machine learning methods with
statistical regression models for prediction of
readmission and mortality in heart failure patients: A
systematic review. Circulation, 140, 12533.
IAMPA 2025 - The International Conference on Innovations in Applied Mathematics, Physics, and Astronomy
330
