
Analysis of Metal Distribution in Sc Type Galaxies Using the
SDSS-IV DR17 MaNGA Survey
Zifeng Gao
Beijing International Bilingual Academy, Beijing, China
Keywords: Spiral Galaxy, Metallicity, Data Analysis.
Abstract: The study of spiral galaxies has yielded fruitful results over the past half-century. The metallicity of a galaxy,
the ratio of metal elements to hydrogen and helium, has been shown to decrease as the distance to the center
of the galaxy increase. This study verifies the metallicity distribution of Sc type galaxies, with more definite
metallicity gradients. In this paper, the author utilized the SDSS-IV MaNGA survey to plot out the metallicity
gradient calculated with the O3N2 calibrator. The result shows a large amount of scattering after a certain
distance, and that the metallicity gradient is mostly flat, with the exception of a number of galaxies. This
shows that the metallicity gradient conforms with the traditional view. The scattering can be explained by the
spiral structure of the galaxy, and the exceptions may be due to the observational issues or higher redshifts,
which has demonstrated a positive metallicity gradient. These results allowed the confirmation of the
metallicity gradient at lower redshifts, and it has given more insight into the metallicity distribution of Sc type
galaxies, and thus more insight into the formation of spiral galaxies.
1 INTRODUCTION
Spiral galaxies (SG) have been the centre of
astronomical research for decades after Edwin
Hubble differentiated galaxies from ordinary nebulae
in 1926 (Dobbs & Baba, 2014). Hubble constructed
the Hubble Type classification schemes, separating
elliptical galaxies, SG’s and barred spirals. Hubble
then separated SG’s, both barred and unbarred, into 3
major types with differing structures: Sa galaxies with
a larger bulge, compact arms and higher luminosity;
Sb galaxies with smaller bulges loosely wound arms;
Sc galaxies with a smaller bulge to arm ratio and
generally the loosest arms. SG’s allowed researchers
to deduce conclusions such as the existence of Dark
Matter, from the peculiar shape of the rotation curves
all SG’s exhibit which was noticed in the 1970s
(Rubin, 1983; Rubin, et al., 1985). This utterly
important result, which has fuelled many simulations
and theories ever since its proposal, has allowed a
clearer view of the formation of the entire universe.
Another active field of research regarding spirals is
the study of the galaxy’s metallicity. Metallicity is the
ratio between the masses of elements heavier than He
to the combined masses of He and H (Henry &
Worthey, 1999). Metallicity is an essential part in the
investigation of the formation of the Solar System,
since the heavier elements such as Silicon, Carbon
and Nitrogen would contribute to the formation of
planets (Winter, et al., 2024). Thus, the study of
metallicity in galaxies allow researchers to
understand the formation of stars and planets more
thoroughly, thus pushing the boundaries in the studies
of the Solar System. SG’s have long perplexed
researchers and has yielded many fruitful results for
the scientific community such as the DM theory and
the metallicity results. Thus, this field is of great
future prospect, as more theories could potentially
arise from the study of SG’s.
The focus of this paper is on the metallicity
distribution of SG’s. Older studies, like the paper
published in 1999 by Henry and Worthey focuses on
the analysis of the metallicities for all types of
galaxies, ranging from the earlier HT’s to later HT’s,
concluding that the metallicity showed a negative
correlation with the distance to the centre (Henry &
Worthey, 1999). More recent papers focused on
analyzing the gas-phase metallicity (GP) by
calculating the oxygen abundance. One paper from
2025 used JWST data to analyse the gas-phase
metallicity gradient from galaxies of redshift z=0.5 to
z=1.7, testifying that the metallicity is lower in the
interstellar medium (ISM) of the outer regions of a
246
Gao, Z.
Analysis of Metal Distribution in Sc Type Galaxies Using the SDSS-IV DR17 MaNGA Survey.
DOI: 10.5220/0013823000004708
Paper published under CC license (CC BY-NC-ND 4.0)
In Proceedings of the 2nd International Conference on Innovations in Applied Mathematics, Physics, and Astronomy (IAMPA 2025), pages 246-251
ISBN: 978-989-758-774-0
Proceedings Copyright © 2025 by SCITEPRESS – Science and Technology Publications, Lda.

galaxy and also showing that most metallicity
gradients are indeed flat (Ju, et al., 2025). They have
also found that some galaxies at higher redshifts
greater than 0 could demonstrate a positive radial
metallicity gradient with sometimes a steep slope,
which is consistent with the results from the TNG
simulations (Ju, et al., 2025). The metallicity gradient
at z=0 could be explained by an inside-out growth
model of galaxies, stating that the initial
accumulation of matter at the beginning of the galaxy
would spread out over time, which would make the
gradient less steep (Ju, et al., 2025). This model
explains negative, flat slope observed at low redshifts,
but fails to account for the situation at higher redshifts
(Ju, et al., 2025). This team utilized integral field
units(IFU) from JWST observations, thus to construct
three dimensional spectroscopies (Ju, et al., 2025).
Another paper from 2019 reached a similar
conclusion, and also linked the higher metallicity
with other values which showed an increase in that
region, such as ionization, which led the researchers
to conclude that star formation plays a role in the
enrichment of the ISM (Kreckel, et al., 2019).
Furthermore, another study from 2025 also
substantiated the negative metallicity gradient in low-
redshift galaxies, using the MaNGA survey. They
also found that the slope becomes steep at a mass
smaller than 3×10
10
M
solar
and then flattens at masses
greater than this limit (Khoram & Belfiore, 2025).
This study would further examine the radial
metallicity gradient as a whole in Sc type spirals using
the newer IFU methods to collect data, thus
constructing a comprehensive view of larger galaxies,
which can further substantiate that the metallicity
gradients of SG’s are negatively correlated with the
radius. The Sc type is particularly selected, as Sc type
galaxies are galaxies early in their process of
evolution. Being early in its evolution, the Sc’s ISM
has not yet been supplied with a large amount of
metals, which would limit the amount of time
available for the redistribution effect achieved by the
inside-out growth theory as previously described.
This would contribute to a steeper metallicity gradient,
benefitting the analysis of metal distribution.
Furthermore, as the bulge is smaller, this paper would
analyse the combined metallicity in a certain region
of a galaxy, using mainly the GP metallicity to
compute the metallicity distribution.
In the following part, first, the author will
introduce detailed description of SG’s. Then, the
MaNGA and SDSS would be talked about, giving
insight into their technical aspects. Afterwards, the
author will talk about the methodology used to
analyse the data from MaNGA. The results would
follow this, then a discussion of the potential reasons
that lie behind the results would be given. Lastly, the
paper will discuss the conclusion, limitations and
future prospects.
2 SPIRAL GALAXIES AND
DETECTION
SG’s are essentially a type of galaxy with long arms
wrapped around them. As aforementioned, spirals are
a Hubble Type with three major categories. Although
the Sa type galaxy is commonly called the early type
is now thought to be older than Sb and Sc types, due
to their star formation rates being lower than that
which exists in Sb and Sc types. Thus, indicating that
the age should be the oldest for Sa’s, then Sb’s, with
the youngest being the Sc galaxy.
For the data collection part, the author will be
using the MaNGA survey from the seventeenth data
release from SDSS-IV. The SDSS survey has been
carried on for nearly thirty years, beginning in 1998
(Abdurro’uf, et al., 2022). The MaNGA survey is one
of the surveys of the SDSS, with the full name
Mapping Nearby Galaxies at Apache Point Observer
(APO). In the northern hemisphere, SDSS uses the
2.5-meter aperture telescope at the Sloan foundation
observatory. They also use the La Campanas
Observatory located in Chile to observe the southern
hemisphere. This allows for a comprehensive view of
the entire night sky.
The MaNGA survey uses IFU, a technology
aforementioned, to construct three dimensional,
spatially resolved surveys of galaxies and clusters.
Thus, MaNGA is capable of constructing full
spectroscopic data on a 2D maps, differing it from the
traditional spectroscopes, which only allows users to
analyze data at a certain region within the galaxy. The
MaNGA is capable of taking large field spectroscopic
data of entirety of galaxies using integral field units.
This, combined with the 2D view, allows a more
integral view of galaxies, facilitating future
researches (Bundy, 2014).
MaNGA stores data in the form of data cubes,
which can be extracted individually from the Marvin
API via Python by inputting a specific identification
number, for individual data cubes, known as the
plate-ifu (Cherinka, et al., 2019). In total, MaNGA
made surveys of 10,010 galaxies using the IFU
method. The IFU is made up of small packets of fiber
optic organized in hexagons (Dory, et al., 2015). In
total, 1423 fibers are utilized in the MaNGA. Each of
these fibers will form harnesses, which are larger
Analysis of Metal Distribution in Sc Type Galaxies Using the SDSS-IV DR17 MaNGA Survey
247
bundles of optic fibers and their corresponding
hardware used to hold them in place. The light signals
captured by the telescope would be sent to the sensors
via the harnesses. The instrument, via this set-up, is
capable of resolving lights of wavelength 3600 to
10300Å.
3 METHODOLOGIES
This paper will thus be using the MaNGA survey to
construct maps of metallicities of entire galaxies and
their corresponding metallicity gradient. The study
will be using Marvin as a tool to extract and represent
data from the MaNGA survey.
This study intends to use the 12+log(O/H)
indicator to calculate the GP metallicity for SG’s,
using the O3N2 calibrator to eliminate the disruptive
effects of dust on the observed light (Boardman, et al.,
2023). Furthermore, the O3N2 calibrator has an
advantage over the N2 calibrator, as the latter tends to
be less accurate with IFU data as mentioned by
Marino et al., 2013 (Marino, et al., 2013). Hence, the
O3N2 calibrator will be utilized in combination with
the 12+log(O/H). The O3N2 calibrator described in
Ma2013 takes the value of
O3N2 = log (
×
) (1)
and the 12+log(O/H) takes the value of
12 + log
= 8.533 − 0.214 × O3N2 (2)
This paper will not be taking into account the effect
of redshift. This is because, firstly, this study will
only take samples from regions of low redshift, at z =
0, that is, this paper will only account for galaxies at
a distance that is near to us. Hence, it will not result
in a high redshift. Thus, the effect of the redshift will
be minimal. Secondly, the research only desires to
acquire the shape of the metallicity distribution across
the radius of the SG, discovering the relative
distribution of metal elements. Thus, it is unnecessary
to determine specific metal elements. For further
calculations to be accomplished, the Sc types must be
selected first, which can be accomplished by
accessing the MaNGA visual morphology catalogue
(MVM-VAC). The Sc Type galaxies filtered out is
then inputted into a csv file by using the Pandas
library in Python. 20 Sc galaxies will be drawn
randomly from the 418 Sc galaxies that are included
in the MVM-VAC. The 20 Sc galaxies and their
corresponding data is visible in Table 1. Then, the
plate-ifu of the individual galaxies will be inputted
into Marvin, thus to acquire the metallicity data using
the aforementioned O3N2 calibrator. And after
investigations, due to the messy nature of
observational data, the 2D metallicity maps of the
SDSS-IV will not be utilized, instead, the metallicity
data will be plotted onto a graph with metallicity
against radius in kpc. Furthermore, it is also necessary
to obtain the radius, which can be easily done by the
following code found in the Marvin Documentation
(Cherinka, et al., 2019):
radius = 0.7*(galaxy.spx_ellcoo_r_kpc.value) (3)
The 0.7 is multiplied as the radius within the SDSS
survey is presented in the units of kpc/h, where h is
the dimensionless Hubble parameter(dHp). The h in
this paper will be taken as 0.7 as presented by a
review in 2013 (Croton, 2013). Multiplying the radius
by 0.7 will rid of the dHp thus returning a value in
kpc. Then, it is possible to plot the metallicity results
against the radius, returning a scatter plot showing the
general trend of the metallicity distribution.
Table 1: The 20 Sc galaxies filtered from MVM-VAC. All of these galaxies are randomly selected from 418 samples available
in the MVM-VAC. The galaxies are presented with their plate-ifu, the MangaID and their redshifts (Cherinka, et al., 2019).
name
p
lateifu MANGAID Redshift
man
g
a-7443-6101 7443-6101 12-84726 0.03091249
man
g
a-7443-6103 7443-6103 12-84665 0.01834222
manga-7443-9101 7443-9101 12-84660 0.0404705
manga-9871-3703 9871-3703 1-322258 0.018230092
man
g
a-9871-9101 9871-9101 1-321936 0.017267063
man
g
a-9872-12701 9872-12701 1-322161 0.018649809
man
g
a-9872-12702 9872-12702 1-322506 0.04083086
manga-9872-6102 9872-6102 1-322507 0.019473994
manga-9872-6104 9872-6104 1-322353 0.018495463
manga-9876-3703 9876-3703 1-456616 0.016713664
man
g
a-9891-12703 9891-12703 1-593748 0.01753549
man
g
a-9891-6102 9891-6102 1-373878 0.045699038
man
g
a-8145-12704 8145-12704 1-152587 0.023471711
manga-8146-12701 8146-12701 1-604839 0.02784799
manga-8147-12703 8147-12703 1-146028 0.026618272
IAMPA 2025 - The International Conference on Innovations in Applied Mathematics, Physics, and Astronomy
248
man
g
a-8149-12701 8149-12701 1-604930 0.042103108
manga-8150-3703 8150-3703 1-390130 0.09668134
manga-8154-12701 8154-12701 1-603920 0.03146515
man
g
a-8154-12703 8154-12703 1-37546 0.03965886
man
g
a-8154-12705 8154-12705 1-37547 0.028330915
4 RESULTS AND DISCUSSIONS
Firstly, one has to eliminate certain results from the
data selection, thus to be able to find a general trend
that governs metallicity distribution. There are two
sets of data that do not show any clear trends, that is,
8146-12701 and 8154-12703. The distribution of data
is very loose in these samples; thus, it is more difficult
to utilize this data and state any conclusions about the
gas-phase metallicity distribution of SG’s. Therefore,
these samples will not be considered during analysis,
as it will confound the results. These anomalies may
be due to the data from the SDSS as the ifu itself may
be damaged or of low quality.
The graphs are clearly separated into 2 parts, one,
the distance nearer to the centre of the galactic bulge,
which had less varied metallicity values. This
distance took up about half the entirety of each
sample. However, 8149-12701, 9891-6102, 9872-
12702, 8150-3703 and 8971-12702 showed a
different trend, having less of a region with smaller
dispersions in metallicity. These exceptions showed a
greater range of distribution in the GP metallicity of
galaxies. Furthermore, 9871-3703 also showed the
exception of having more of its region with GP
metallicity scattered across a smaller range of
metallicity values. These exceptions are likely due to
the properties of individual galaxies being different to
each other. This could potentially be explained by the
difference in morphology or size of the galaxies, as
some of the galaxies with metallicity being more
varied tend to also have a larger size, like 9872-12702.
However, the more intriguing result comes from
the general trend of scattering after a certain distance.
This could be explained by the loose spiral arms of
Sc-type galaxies. Therefore, the metallicity, after an
initial distance within the central bulge with a more
stable metallicity distribution, will tend to scatter as it
moves onto the spiral arms. Because, then, the
metallicity will be accounting for both the spiral arms
with a more compact mass and metal distribution, and
the region between the spiral arms with less luminous
matter, thus giving rise to the great variation in GP
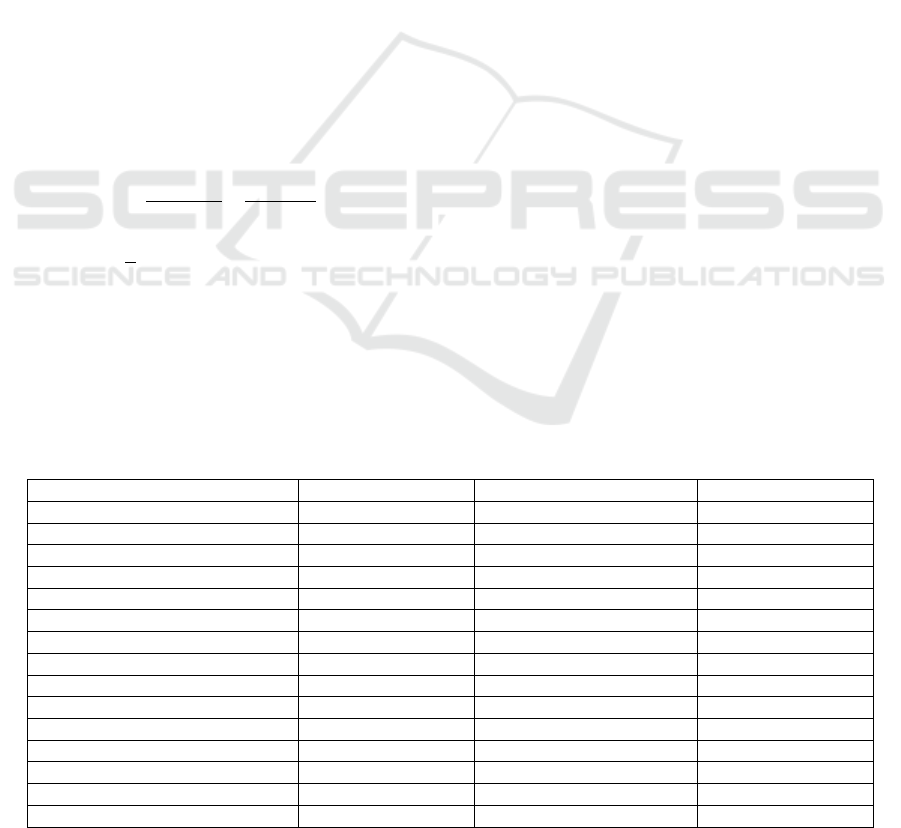
metallicity after about one half the radius. Fig. 1 rom
the SDSS-IV data release illustrates the loose spiral
arms, and as one can see, the sample includes the
entirety of the galaxy, from the centre to the edge
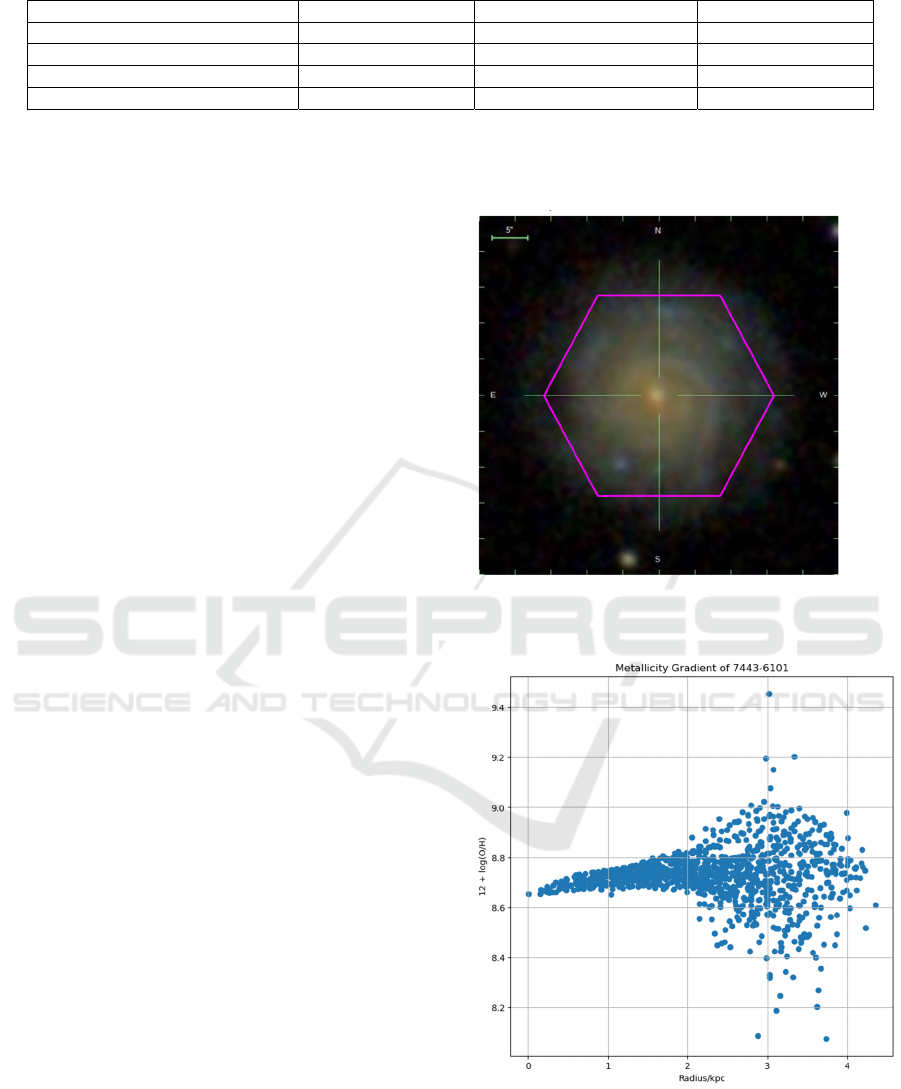
(Cherinka, et al., 2019). Fig. 2 shows the scattering of
metallicity values after a certain distance.
Figure 1: The spiral Sc galaxy from the SDSS-IV survey,
plateifu = 8145-12704 (Cherinka, et al., 2019).
Figure 2: The spiral Sc galaxy from the SDSS-IV survey,
plateifu = 7443-6101. The metallicity value stars to scatter
above Radius = 2kpc (Photo/Picture credit: Original).
After providing an explanation to one trend
observed in the graphs, it is then possible to organize
the other samples into two groups: those with
Analysis of Metal Distribution in Sc Type Galaxies Using the SDSS-IV DR17 MaNGA Survey
249
decreasing or flat trends of metallicity, and those with
increasing metallicity. The majority of galaxies, of
about 12 galaxies, had a rather flat metallicity, with
very small amounts of fluctuations near the centre of
the galaxy. And two of the galaxies had an increase
and then abrupt decrease in metallicity. These are
expected results, as most SG’s do show either
decreasing or flat trends across its radius as a result of
inside-out growth. Similar results are present in Ju et
al. and furthermore, their results also included a
galaxy with an increasing then decreasing metallicity
trend (Ju et al., 2025). This is due to the inside-out
growth model as aforementioned. The inside-out
growth model enriches the centre with more metal
elements; because the model suggests that the centre
of the galaxy is where the galaxy begins growing,
meaning that the initial star formation occurs in the
centre, thus resulting in higher metallicity. The
smooth decreasing curve or flat curve is a result of the
later diffusion and spreading of metal elements after
the initial formation at the centre.
Table 2: the galaxies categorized with the trend of their
graphs.
Galax
y
Trend
7443-6101
Flat
7443-6103
Decrease after increase
7443-9101
Decrease after increase
9871-3703
Flat
9871-9101
Flat
9872-12701
Flat
9872-12702
Flat
9872-6102
Flat
9872-6104
Flat
9876-3703
Flat
9891-12703
Flat
9891-6102
Flat
8145-12704
Increase
8146-12701
Discarded
8147-12703
Flat
8149-12701
Flat
8150-3703
Increase
8154-12701
Increase
8154-12703
Discarded
8154-12705
Increase
The samples with the increasing metallicity as
radius increase demands different explanations as it
opposes the classic results from the inside-out growth
model. High redshift regions could result in a positive
metallicity gradient. However, the values in Table 2
indicate that most of the samples do not have a high
redshift. Only one galaxy 8150-3703 has a relatively
high redshift of 0.967, and simultaneously, its radius
and metallicity have a weak positive correlation,
rendering it the only galaxy that could be potentially
explained by the high redshift proposition. The other
galaxies mostly have lower redshifts below 0.5.
Therefore, it may be the issues with the data, or the
individual morphological characteristics of these Sc
normal spirals.
5 LIMITATIONS AND
PROSPECTS
It is no doubt that this paper has reached some results.
However, there were many issues and limitations
with the methodology and the data. Firstly, there were
flaws in the method. The author did not account for
issues with the data cubes, for instance, potential data
that were corrupted, or cannot be used, or lacks
validity. The paper can be improved if masks were to
be used in the Python code to decrease the number of
spaxels that contained unreliable data, thus increasing
the reliability and confidence with the final results.
Furthermore, this paper focused only on using the
oxygen abundance to derive the GP, which has been
shown by Fraser-McKelvie et al. in 2021 to be only a
rough estimate of the GP in a galaxy, as other
elements are also present in the ISM (Fraser-
McKelvie, et al., 2021). Potentially, in the future,
stellar metallicity should also be considered so to
acquire the overall metallicity of the entire galaxy,
giving new insights into the inside-out model, as the
inside-out model is proposed based upon GP
metallicity, examining it using a stellar metallicity
result might yield valuable results.
This field also has many limitations currently.
Due to the lack of better means of probing the
universe and the limitations in the technique, the data
sent from all-sky surveys still has uncertainties.
Surveys like such may lack details when probing
galaxies, hence limiting the current researches.
Furthermore, the existence of dust, nebulae and other
matter in the Milky Way can also impede further
inspections on extragalactic objects. Although there
are algorithms that can reduce noise and other sources
of uncertainty, there exists, still, a physical constraint
on further investigating objects at distant locations
like galaxies.
This field is still an active one. In the future, it is
also possible that the observation techniques improve.
SDSS is in fact starting to release their new SDSS-V,
making the data more reliable and more accurate,
IAMPA 2025 - The International Conference on Innovations in Applied Mathematics, Physics, and Astronomy
250

which can offer newer insights in the formation and
evolution of galaxies. Furthermore, more accurate
simulations, such as Illustris TNG and Thesan can
also be integrated with actual observations so to
further test the understanding of galaxies and the
universe. These simulations, in the future, could be
used to test the validity of galaxy formation theories,
if fed with more accurate results from observations.
The development of machine learning in the past few
years can also be used to analyse and interpret data
from surveys and simulations, providing more
solutions to issues like the price and time for
simulations. This can and will improve the results
from the field, making researches more fruitful.
6 CONCLUSIONS
In conclusion, this research has discussed the metal
distribution in normal Sc type galaxies by utilizing
the SDSS-IV DR17 MaNGA survey. The research
has concluded that most galaxies do follow a nearly
flat metallicity gradient, thus indicating the validity
of the inside-out growth model of galaxies, further
substantiating the theory. Furthermore, the data used
in the paper has also yielded some anomalous results,
showing 4 galaxies with a clear increasing trend and
a positive gradient, and most of which do not
necessarily have a satisfactory explanation, since only
one out of 4 has a redshift greater than 0.5. In the
future, this field still holds many potentials, as
machine learning develops and new technology arises.
The study of SG’s is capable of ridding of more
physical constraints in the near future. And, this field
also has great potential and significant meaning.
Integrating results from metallicity gradients can also
provide more insight into DM, for metallicity is a
very fundamental characteristic of galaxies and could
potentially have connections with DM, which plays a
significant role in spiral galaxies.
REFERENCES
Abdurro’uf, A., K., Aerts, C., Silva Aguirre, V., et al., 2022.
The seventeenth data release of the sloan digital sky
surveys: Complete release of Manga, MaStar, and
apogee-2 data. The Astrophysical Journal Supplement
Series, 259(2), 35.
Boardman, N., Wild, V., Heckman, T., Sanchez, S. F.,
Riffel, R., Riffel, R. A., Zasowski, G., 2023. Gas
metallicity distributions in SDSS-IV manga galaxies:
What drives gradients and local trends? Monthly
Notices of the Royal Astronomical Society, 520(3),
4301–4314.
Bundy, K., 2014. Manga: Mapping nearby galaxies at
apache point observatory. Proceedings of the
International Astronomical Union, 10(S311), 100–103.
Cherinka, B., Andrews, B. H., Sánchez-Gallego, J., et al.,
2019. Marvin: A tool kit for streamlined access and
visualization of the SDSS-IV manga data set. The
Astronomical Journal, 158(2), 74.
Croton, D. J., 2013. Damn you, little H! (or, real-world
applications of the Hubble constant using observed and
simulated data. Publications of the Astronomical
Society of Australia, 30.
Dobbs, C., Baba, J., 2014b Dawes Review 4: Spiral
structures in disc galaxies. Publications of the
Astronomical Society of Australia, 31.
Dory, N., MacDonald, N., Bershady, M. A., et al., 2015.
The manga integral field unit fiber feed system for the
sloan 2.5 m telescope. The Astronomical Journal,
149(2), 77.
Fraser-McKelvie, A., Cortese, L., Groves, B., et al., 2021.
The Sami Galaxy Survey: The drivers of gas and stellar
metallicity differences in Galaxies. Monthly Notices of
the Royal Astronomical Society, 510(1), 320–333.
Rubin, V. C., 1983. Dark matter in spiral galaxies. Scientific
American, 248(6), 96–108.
Rubin, V. C., Burstein, D., Ford, W. K., Thonnard, N., 1985.
Rotation velocities of 16 SA galaxies and a comparison
of SA, SB, and SC Rotation Properties. The
Astrophysical Journal, 289, 81.
Henry, R. B. C., Worthey, G., 1999. The distribution of
heavy elements in Spiral and elliptical galaxies.
Publications of the Astronomical Society of the Pacific,
111(762), 919–945.
Ju, M., Wang, X., Jones, T., Barišić, I., Nanayakkara, T.,
Bundy, K., Faucher-Giguère, C. A., Feng, S.,
Glazebrook, K., Henry, A., Malkan, M. A.,
Obreschkow, D., Roy, N., Sanders, R. L., Sun, X., Treu,
T., Zhou, Q., 2025. MSA-3D: Metallicity gradients in
galaxies at Z ∼ 1 with JWST/NIRSpec slit-stepping
spectroscopy. The Astrophysical Journal Letters, 978,
2.
Khoram, A. H., Belfiore, F., 2025. Direct-method
metallicity gradients derived from spectral stacking
with SDSS-IV manga. Astronomy & Astrophysics, 693.
Kreckel, K., Ho, I. T., Blanc, G. A., et al., 2019. Mapping
metallicity variations across nearby Galaxy Disks. The
Astrophysical Journal, 887(1), 80.
Marino, R. A., Rosales-Ortega, F. F., Sánchez, S. F., et al.,
2013. The O3N2 and N2 abundance indicators
revisited- improved calibrations based on CALIFA and
Te-based literature data.
Astronomy & Astrophysics,
559.
Winter, A. J., Benisty, M., Andrews, S. M., 2024. Planet
formation regulated by Galactic-scale interstellar
turbulence. The Astrophysical Journal Letters, 972, 1.
Analysis of Metal Distribution in Sc Type Galaxies Using the SDSS-IV DR17 MaNGA Survey
251
