
Optimizing Electric Vehicle Range Prediction Using Machine
Learning: A Feature-Based Comparative Study
Yijia Yang
a
Economics and Mathematics (MA Hons), The University of Edinburgh, EH8 9JU, U.K.
Keywords: Electric Vehicle Range Prediction, Machine Learning, LightGBM, Feature Selection, Battery Capacity.
Abstract: Accurate prediction of electric vehicle (EV) driving range is essential to addressing consumer range anxiety
and improving energy planning. This study investigates a feature-based comparative approach to EV range
prediction by integrating real-world vehicle specifications and battery characteristics. A cleaned dataset of
102 EV models from Kaggle was analysed using three machine learning algorithms: Light Gradient Boosting
Machine (LightGBM), Extreme Gradient Boosting (XGBoost), and Gaussian Process Regression (GPR).
Variables such as battery capacity, energy efficiency, fast charging rate, and top speed were selected based
on their measurable correlation with EV range. Pearson correlation analysis and LightGBM feature
importance visualization revealed Battery_Pack_Kwh and Efficiency_WhKm as dominant predictors. A
linear regression model, implemented in R, achieved high predictive performance with an R² of 0.969 and
MAE of 17.08 km on the test set. Residual diagnostics, Q-Q plots, and predicted-vs-actual comparisons
confirmed the model’s reliability. The findings underscore the importance of data-driven modelling and
suggest that even moderately correlated features can enhance prediction when modelled non-linearly.
1 INTRODUCTION
Environmental sustainability and energy efficiency
have emerged as global priorities in the 21st century,
catalysing the advancement of electric vehicle (EV)
technologies that promise zero tailpipe emissions and
a more intelligent, sustainable transportation
ecosystem (Kumar and Revankar, 2017). However,
despite rapid technological progress, a critical barrier
remains range anxiety—the fear that a battery electric
vehicle may not have sufficient charge to reach its
destination. Reliable range prediction has therefore
become essential to promoting EV adoption and
enhancing consumer trust (Varga, Sagoian and
Mariasiu, 2019).
A key determinant of EV range is battery
performance, particularly lithium-ion batteries, which
dominate the current market due to their high energy
density and long cycle life (McManus, 2012). Battery
range is influenced by internal and external factors
such as depth of discharge, ambient temperature,
charge/discharge rate, and cycle count. Consequently,
indicators like State of Health (SOH) and State of
a
https://orcid.org/0009-0006-9220-4634
Charge (SoC) are critical for modelling EV range (Li
et al., 2018). SOH reflects the battery’s capacity
retention, while SoC denotes its real-time charge
level. Accurate estimation of these parameters under
varying operational conditions is vital for maintaining
powertrain reliability and user safety (Chandran et al.,
2021).
Traditional analytical models often fail to capture
the nonlinear degradation patterns of EV batteries. In
contrast, machine learning (ML) methods offer
considerable potential to model such complexity. For
example, Random Forest Regression (RFR) has been
applied to estimate battery capacity and degradation
trends from multiple sensor inputs (Zhang et al.,
2021). While Artificial Neural Networks (ANN) and
Gaussian Process Regression (GPR) have been used
to predict range based on real-time features from
battery management systems (Chandran et al., 2021).
Recent work has shifted toward leveraging
feature-rich, production-level datasets to build
predictive models for EV range estimation (Ali et al.
2025). In this study, a curated dataset titled Cars
Dataset with Battery Pack Capacity from Kaggle is
utilized, it contains model-level specifications such as
Yang, Y.
Optimizing Electric Vehicle Range Prediction Using Machine Learning: A Feature-Based Comparative Study.
DOI: 10.5220/0013822700004708
Paper published under CC license (CC BY-NC-ND 4.0)
In Proceedings of the 2nd International Conference on Innovations in Applied Mathematics, Physics, and Astronomy (IAMPA 2025), pages 233-239
ISBN: 978-989-758-774-0
Proceedings Copyright © 2025 by SCITEPRESS – Science and Technology Publications, Lda.
233
battery pack capacity, acceleration, top speed, energy
efficiency, and drivetrain type. This dataset offers a
realistic technical foundation for constructing
interpretable and scalable regression models.
While various of machine learning algorithms
have been explored for electric vehicle range
prediction, not all perform equally across different
problem settings. Ensemble methods such as Light
Gradient Boosting Machine (LightGBM) and
Extreme Gradient Boosting (XGBoost) have
demonstrated consistently high accuracy and
robustness in energy consumption forecasting tasks
(Ullah et al., 2021). Additionally, Gaussian Process
Regression (GPR) has shown strength in capturing
non-linear battery dynamics, particularly in state-of-
charge estimation scenarios (Chandran et al., 2021).
Despite their advantages, direct performance
comparisons of these models in range prediction
remain limited. Furthermore, emerging studies
emphasize the value of incorporating long-term
battery degradation indicators, such as cycle index,
discharge capacity fade, and temperature variance, to
improve range prediction accuracy (Zhang et al.,
2025). To address these gaps, this study integrates
real-world EV technical specifications with battery
health variables extracted from National Aeronautics
and Space Administration (NASA)’s lithium-ion cell
dataset.
This study aims to address the challenge of
electric vehicle range prediction by building a
feature-driven modelling framework that integrates
real-world technical specifications. To achieve this,
this paper develops and compares three machine
learning models-LightGBM, XGBoost, and GPR,
based on their ability to predict driving range and
identify key influencing factors. These models are
developed with the goal of improving consumer trust
and reducing EV range anxiety through more accurate
and interpretable range estimation.
2 METHODOLOGY
2.1 Data Source and Preprocessing
This study employs the Cars Dataset with Battery
Pack Capacity from Kaggle, which contains
specifications for 102 electric vehicle (EV) models.
The dataset includes attributes such as acceleration
time (AccelSec), top speed, energy efficiency, battery
capacity, fast-charging rate, drivetrain type, plug
interface type, and manufacturer-suggested price.
Initial data cleaning involved removing rows with
excessive missing values and outliers. The remaining
missing entries were imputed using appropriate
statistical methods, such as mean or mode, depending
on the variable type. Categorical variables were
encoded using one-hot encoding, while numerical
features were standardized to ensure scale uniformity.
Feature selection was guided by both literature review
and statistical correlation analysis, prioritizing
variables with strong theoretical relevance and
measurable influence on EV range.
2.2 Feature Overview and Selection
Table 1 summarizes the selected variables and their
value ranges in the cleaned dataset.
Battery_Pack_Kwh and Efficiency_WhKm showed
the strongest linear correlations with driving range
and were identified as key predictors. Variables such
as PlugType and Seats were also retained to improve
interpretability and capture potential nonlinear
effects.
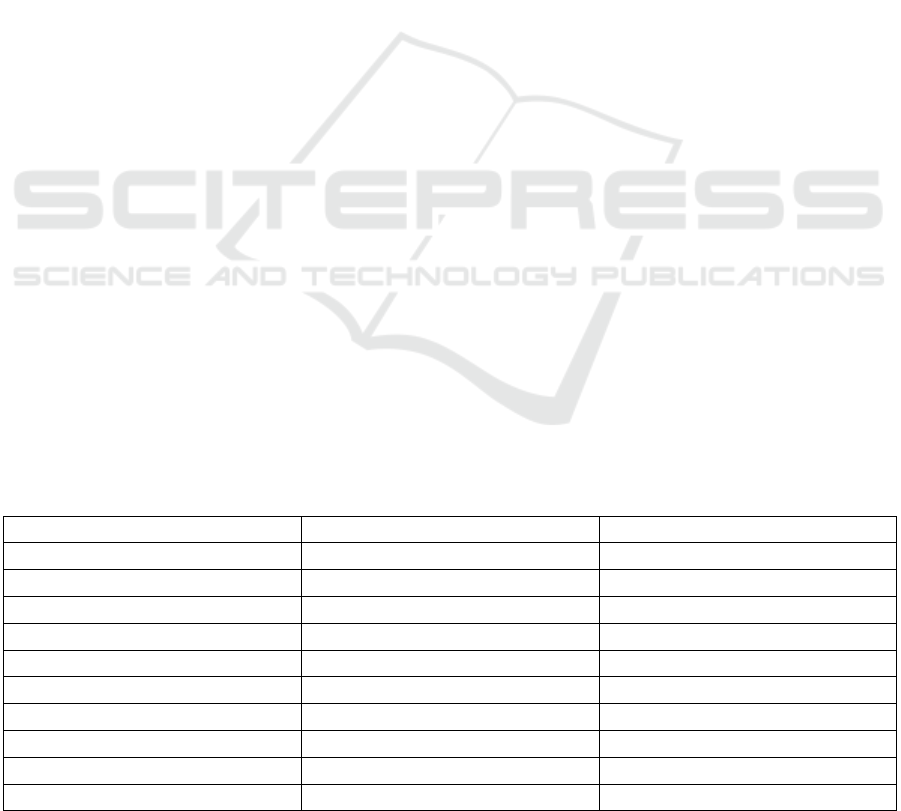
Table 1: Variable Description and Observed Value Ranges
Variable Name Description Value Range
AccelSec Time to accelerate 0–100 km/h 2.1-22.4 s
TopSpeed_KmH Maximum vehicle speed 123.0-410.0 km/h
Battery_Pack_Kwh Battery capacity 16.7-200.0 Kwh
Efficiency_WhKm Energy consumption per km 104.0-273.0 Wh/km
FastCharge_KmH Speed of fast charging 0.0-940.0 km/h
PowerTrain Drivetrain type FWD, RWD, AWD
PlugType Plug interface type Type1, Type2, CCS, CHAdeMO
Seats Number of seats 2-7
PriceEuro Manufacturer suggested price (Euro) 20129.0-215000.0 (Euro)
Range_Km Target variable (driving range) 95.0-970.0 km
IAMPA 2025 - The International Conference on Innovations in Applied Mathematics, Physics, and Astronomy
234
2.3 Model Selection and Evaluation
Three machine learning algorithms were employed to
compare predictive performance: Light Gradient
Boosting Machine (LightGBM), Extreme Gradient
Boosting (XGBoost), and Gaussian Process
Regression (GPR). These models were selected based
on their established effectiveness in regression tasks
and their complementary strengths-LightGBM and
XGBoost as scalable, tree-based ensemble methods,
and GPR as a nonparametric, kernel-based model
capable of capturing complex nonlinear patterns.
Each model was trained to predict the EV driving
range using the same input feature set consisting of
eight technical variables (e.g., battery capacity,
energy efficiency, top speed). The dataset was split
into training and test sets using an 80:20 ratio.
Hyperparameter tuning was conducted via 5-fold
cross-validation to reduce overfitting and ensure
generalizability.
Model performance was evaluated using three
standard regression metrics: Mean Absolute Error
(MAE), Root Mean Square Error (RMSE), and the
coefficient of determination (R²). These metrics
provide a comprehensive view of prediction
accuracy, residual variance, and overall model fit.
3 RESULTS AND DISCUSSION
3.1 Feature Importance Analysis
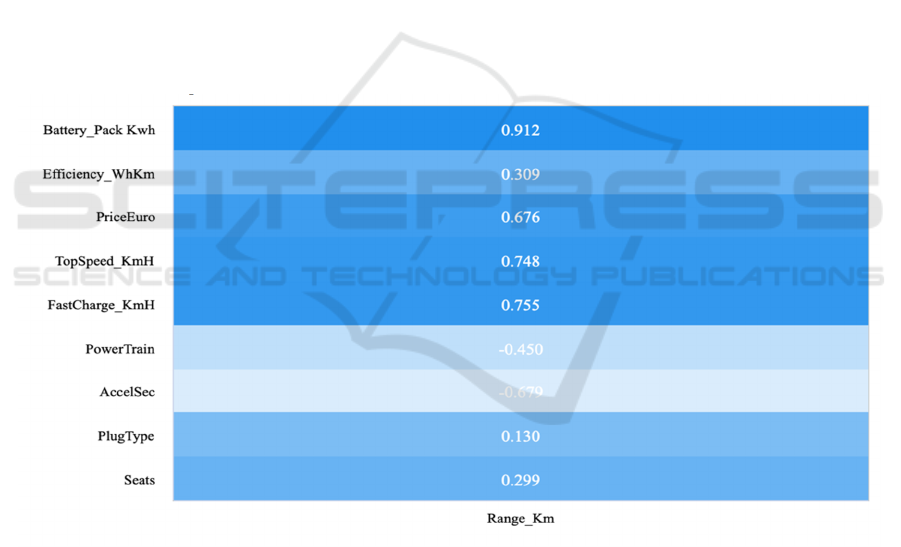
As presented in Table 1, several features exhibited
strong quantitative relationships with the electric
vehicle range. These associations are further
visualized in Figure 1, which depicts Pearson
correlation coefficients among selected variables.
Notably, Battery_Pack_Kwh (r=0.912),
FastCharge_KmH (r=0.755), and TopSpeed_KmH
(r=0.748) demonstrated the strongest positive
correlations with the EV range.
F
igure 1: Pearson Correlation and EV Range (Picture credit: Original)
The heatmap presents correlation coefficients (r)
ranging from -1 to 1. Values closer to ±1 reflect
stronger linear relationships. The given Pearson
Correlation Heatmap shows that Battery capacity and
fast-charging speed stand out as dominant linear
predictors.
In addition to correlation analysis, Figure 2
presents the LightGBM feature importance plot.
This paper ranks predictors based on their relative
contribution to model performance. While
Efficiency_WhKm exhibits only moderate linear
correlation, it emerges as the most important feature
in LightGBM. This suggests it contributes to the
model through nonlinear interactions or synergy with
other features.
Optimizing Electric Vehicle Range Prediction Using Machine Learning: A Feature-Based Comparative Study
235
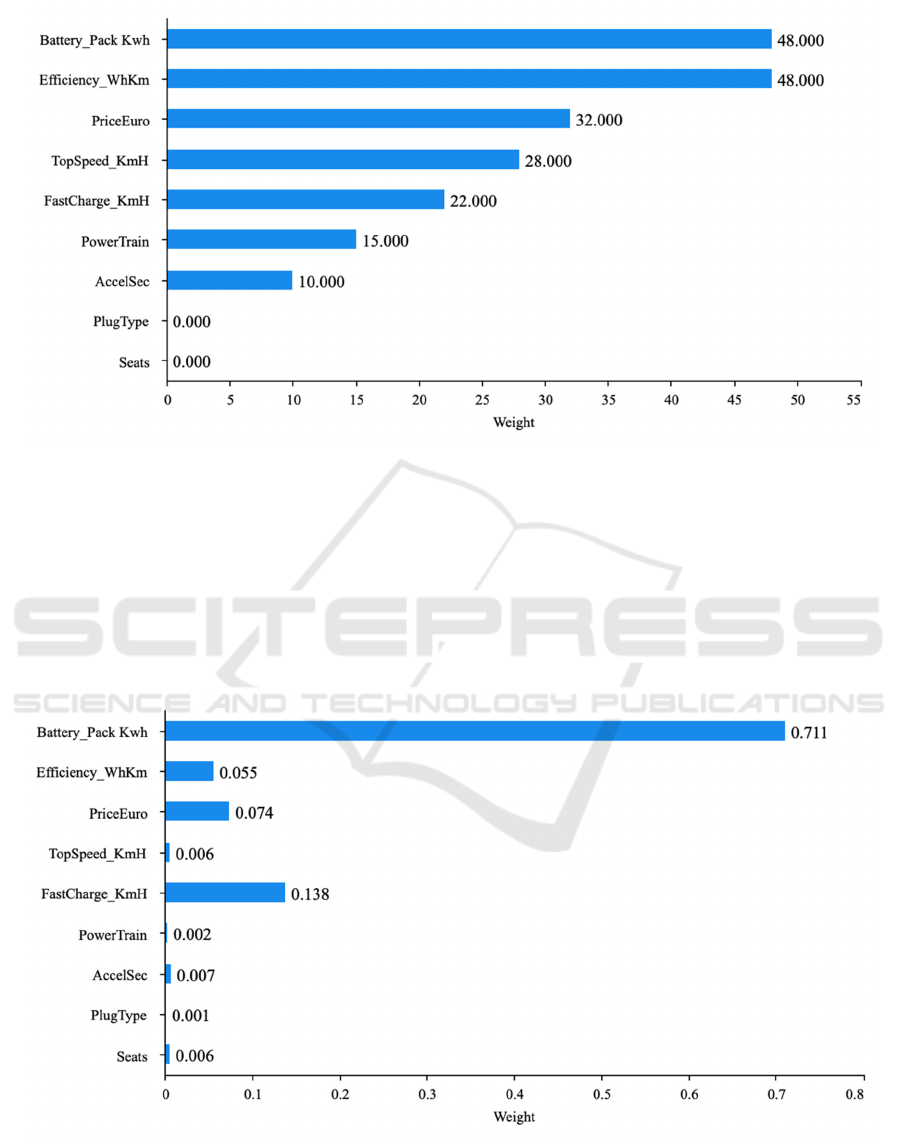
Figure 2: LightGBM Feature Importance Ranking (Picture credit: Original)
Battery capacity and efficiency are identified as the
top predictors, followed by vehicle price and top
speed. The result underscores the value of tree-based
models in capturing complex relationships beyond
linearity.
To further validate these findings, an additional
tree-based model, Extreme Gradient Boosting
(XGBoost), was implemented to assess feature
importance. As illustrated in Figure 3, XGBoost
similarly highlights battery capacity as the most
influential predictor, followed by Segment,
FastCharge_KmH, and Efficiency_WhKm. These
results are consistent with domain knowledge and
previous correlation analysis, further reinforcing the
critical role of battery capacity in EV range
prediction.
Figure 3: XGBoost Feature Importance (Picture credit: Original)
Unlike decision-tree models, Gaussian Process
Regression (GPR) is a nonparametric, kernel-based
algorithm and does not natively produce feature
importance rankings. However, to explore its internal
IAMPA 2025 - The International Conference on Innovations in Applied Mathematics, Physics, and Astronomy
236
feature sensitivity, permutation-based importance
was applied. This method evaluates the increase in
prediction error when individual features are
randomly shuffled, thereby disrupting their
relationship with the target variable.
The results revealed that battery capacity,
efficiency, and fast charging rate remain among the
top contributors to prediction accuracy, mirroring the
findings from LightGBM and XGBoost. While the
lack of a direct importance chart limits visual
comparison, the consistency of these features across
models demonstrates their centrality to range
prediction.
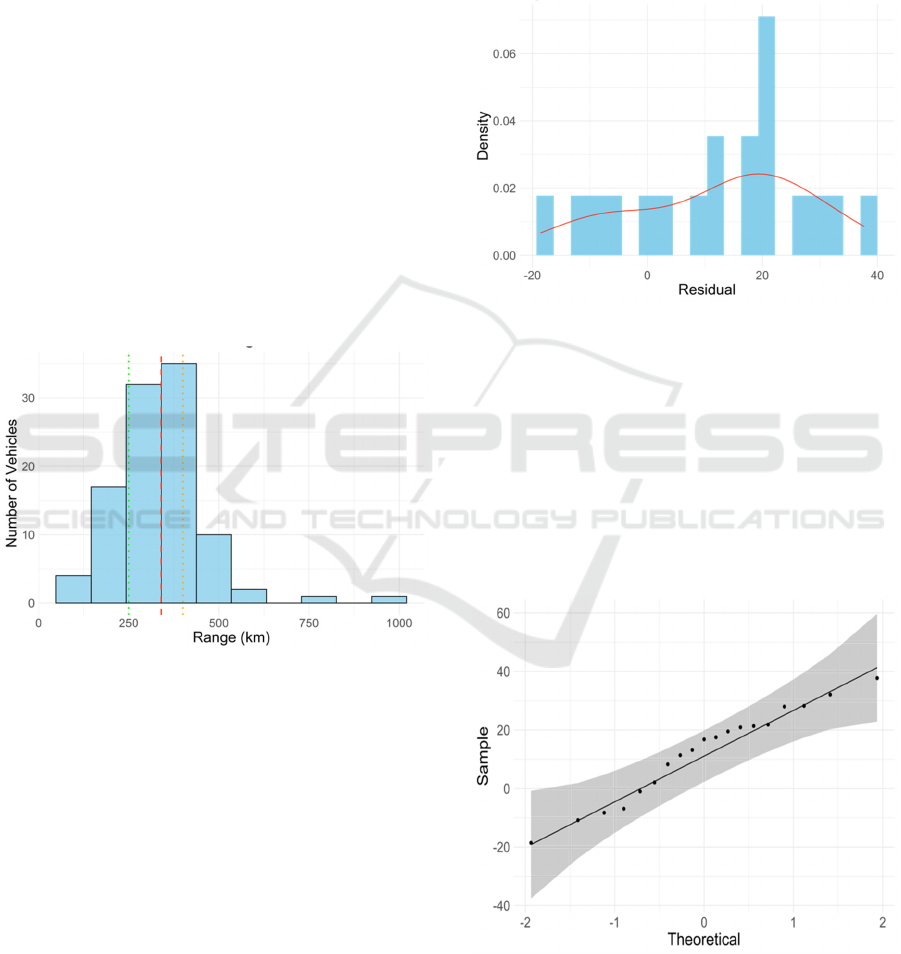
3.2 Exploratory Data Analysis
The target variable Range_Km displayed a
moderately right-skewed distribution, with most EVs
achieving between 250 and 450 kilometres of driving
range. Outliers above 500 km generally represent
premium models. Figure 4 shows the histogram of EV
range distribution, annotated with percentile
thresholds.
Figure 4: Distribution of Actual EV Driving Range
(Picture credit: Original)
In Figure 4, The histogram indicates that the majority
of EVs cluster around a median range of 335 km. The
25th and 75th percentiles correspond to
approximately 250 km and 450 km, respectively.
These boundaries frame the central tendency of the
dataset and offer a benchmark for model calibration.
3.3 Residual and Predictive
Performance Analysis
To establish a benchmark for model performance, a
baseline linear regression model was trained using an
80:20 train-test split. Figures 5–8 present diagnostic
plots based solely on this baseline model, including
residual distribution, Q-Q plot, and predicted-versus-
actual comparisons. The residuals and predictions for
the test set were analysed through visual and
statistical techniques.
Figure 5 presents the histogram of residuals,
showing a near-normal distribution with mild right
skew. Errors are concentrated around zero,
suggesting minimal systematic bias in predictions.
Figure 5: Residual Distribution (Picture credit: Original)
The residuals are symmetrically distributed,
supporting the suitability of the linear model for
initial-level prediction.
Figure 6 presents the quantile-quantile (Q-Q) plot
of residuals, which closely aligns with the reference
line, indicating that the residuals approximately
follow a normal distribution. This result further
supports the validity of the linear model under
standard assumptions and demonstrates consistent
model behaviour.
Figure 6: Q-Q Plot of Residuals (Picture credit: Original)
Figure 7 illustrates the relationship between predicted
and actual values, revealing a strong linear pattern.
The scatter points closely align with the diagonal, and
Optimizing Electric Vehicle Range Prediction Using Machine Learning: A Feature-Based Comparative Study
237
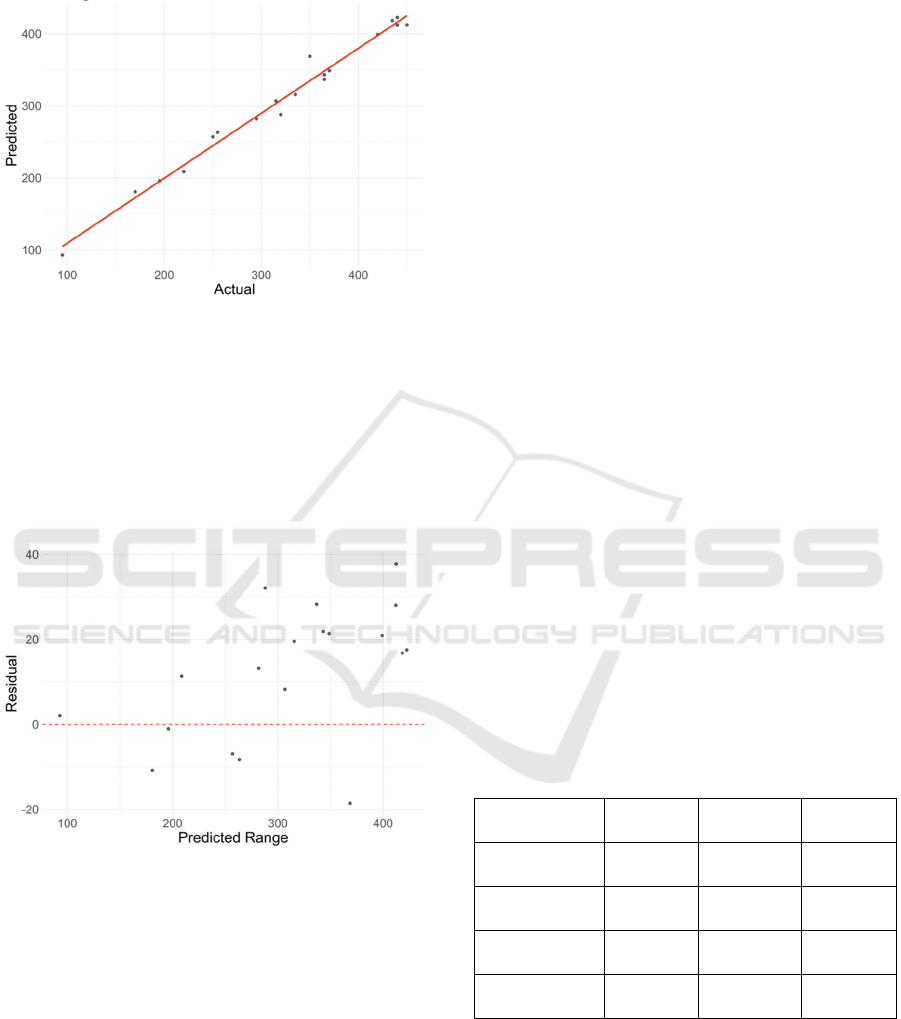
the fitted regression line closely follows the identity
line, indicating reliable predictive performance and
confirming the robustness of the linear model.
Figure 7: Predicted vs Actual EV Range (Picture credit:
Original)
Figure 8 illustrates residuals plotted against predicted
values. The lack of a strong visible pattern or
heteroscedasticity suggests that the model’s error is
relatively consistent across the predicted range.
However, mild fanning at higher predicted values
may suggest slight underestimation or model bias in
those ranges.
F
igure 8: Residuals vs Predicted Values (Picture credit:
Original)
While the linear regression model provides a useful
baseline, more advanced machine learning algorithms
were also evaluated to explore whether they could
deliver improved predictive accuracy and capture
non-linear feature interactions. Overall, these
diagnostic results validate the adequacy of the linear
regression model as a baseline, while providing a
reference for evaluating more advanced machine
learning models.
3.4 Model Comparison
To evaluate the effectiveness of different regression
algorithms for electric vehicle (EV) range prediction,
this study implemented and compared four models:
Linear Regression, Light Gradient Boosting Machine
(LightGBM), Extreme Gradient Boosting
(XGBoost), and Gaussian Process Regression (GPR).
Each model was trained on the same feature set
derived from real-world EV specifications and
battery attributes, ensuring a fair performance
comparison.
Table 2 summarizes the results based on three
evaluation metrics: Mean Absolute Error (MAE),
Root Mean Square Error (RMSE), and the coefficient
of determination (R²). The baseline Linear
Regression model already performed strongly with an
R² of 0.969, demonstrating the value of using
interpretable features such as battery capacity, energy
efficiency, and top speed. However, LightGBM
achieved the best overall performance, with the
lowest MAE (13.42 km) and the highest R² (0.981),
indicating superior generalization capability and
lower average error. XGBoost followed closely, with
comparable accuracy and robustness. Although GPR
exhibited slightly higher error rates, it remained
competitive and is particularly useful in capturing
non-linear feature interactions.
These findings reinforce the conclusion that
ensemble methods-especially gradient boosting
algorithms-are well-suited for EV range prediction
when trained on curated, feature-rich datasets.
Furthermore, the consistent ranking of models across
all three metrics adds validity to the comparative
analysis.
T
able 2: Model Comparison
Model MAE_km RMSE_km R2_Score
Linear
Regression
17.08 19.64 0.969
LightGBM 13.42 16.24 0.981
XGBoost 13.86 16.47 0.979
GPR 15.45 17.68 0.973
3.5 Interpretation and Discussion
Overall, the results confirm that range prediction can
be effectively achieved using technical features and
regression-based modelling. The comparative
evaluation shows that while linear regression offers
IAMPA 2025 - The International Conference on Innovations in Applied Mathematics, Physics, and Astronomy
238

strong interpretability, ensemble models such as
LightGBM and XGBoost provide enhanced
predictive accuracy, especially in capturing complex
patterns. The high correlation of battery-related
variables supports findings in prior literature (Li et
al., 2018; Zhang et al., 2021; Ullah et al., 2021), and
residual diagnostics suggest that linear regression,
despite its simplicity, can yield interpretable and
reasonably accurate results.
While advanced models like LightGBM and
XGBoost often achieve better generalization on
larger datasets, this initial modelling phase via R
validates the use of feature-based range estimation
and highlights the potential for deeper ensemble
learning comparison in future work.
Moreover, the visual diagnostics, especially
residual and Q-Q plots, reinforce that the model errors
follow a predictable and statistically acceptable
distribution. These findings can guide policy
planning (e.g., EV incentives based on predicted
usability) and inform consumers about the expected
range under standard conditions.
4 CONCLUSION
This study presents a feature-driven approach to
predicting electric vehicle (EV) ranges using multiple
machine-learning models. By integrating a real-world
dataset of 102 EV models with the core battery and
technical attributes, this paper conducted a
comparative analysis of LightGBM, XGBoost, and
Gaussian Process Regression (GPR). Correlation
analysis and model-driven feature importance both
identified Battery_Pack_Kwh, Efficiency_WhKm,
and TopSpeed_KmH as key variables influencing the
range.
Among the evaluated models, the baseline linear
regression already achieved strong predictive
performance, evidenced by an R² score of 0.969.
Visual diagnostics-including residual distributions,
Q-Q plots, and prediction scatterplots, confirmed the
model's validity and generalization strength. These
findings validate the potential of interpretable,
feature-based modelling in addressing the challenge
of range anxiety.
While advanced models like LightGBM and GPR
are expected to further improve generalization in
larger and more heterogeneous datasets, the current
study demonstrates that even simple regression
frameworks-when paired with thoughtful feature
engineering-can deliver reliable predictions. Future
work may extend this approach by incorporating
battery aging metrics, user behaviour data, and real-
time environmental conditions. Ultimately, this study
provides an interpretable and robust modelling
framework for EV range prediction. By improving
estimation reliability, the proposed models contribute
to reducing range anxiety and promoting wider
adoption of electric vehicles.
REFERENCES
Ali, Y. O., Haini, J. E., Errachidi, M., Kabouri, O. 2025.
Enhancing charging station power profiles: a deep
learning approach to predicting electric vehicle
charging demand. Smart Grids and Sustainable Energy,
10(1): 1-13.
Chandran, V., Patil, C. K., Karthick, A., Ganeshaperumal,
D., Rahim, R., Ghosh, A., 2021. State of charge
estimation of lithium-ion battery for electric vehicles
using machine learning algorithms. World Electric
Vehicle Journal, 12(1), 38.
Kumar, M. S., Revankar, S. T., 2017. Development scheme
and key technology of an electric vehicle: An overview.
Renewable and Sustainable Energy Reviews, 70, 1266-
1285.
Li, Y., Zou, C., Berecibar, M., Nanini-Maury, E., Chan, J.
C. W., van den Bossche, P., Van Mierlo, J., Omar, N.,
2018. Random forest regression for online capacity
estimation of lithium-ion batteries. Applied Energy,
232, 197-210.
McManus, M. C., 2012. Environmental consequences of
the use of batteries in low carbon systems: The impact
of battery production. Applied Energy, 93, 288-295.
Neubauer, J., Wood, E., 2014. Thru-life impacts of driver
aggression, climate, cabin thermal management, and
battery thermal management on battery electric vehicle
utility. Journal of Power Sources, 259, 262–275.
Ullah, I., Liu, K., Yamamoto, T., Al Mamlook, R. E., Jamal,
A., 2021. A comparative performance of machine
learning algorithm to predict electric vehicles energy
consumption: A path towards sustainability. Energy &
Environment, 33(8), 1583-1612.
Varga, B. O., Sagoian, A., Mariasiu, F., 2019. Prediction of
electric vehicle range: A comprehensive review of
current issues and challenges. Energies, 12(5), 946.
Zhang, J., Xia, Y., Cheng, Z. 2025, Electric vehicle
charging scheduling for multi-microgrids load
balancing using lstm load forecasting. IOP Publishing
Ltd.
Zhang, X., Zhang, C., Sun, J., Ge, S., 2021. A
comprehensive review on lithium-ion battery
modelling: From empirical to artificial intelligence.
Renewable and Sustainable Energy Reviews, 146,
111010.
Optimizing Electric Vehicle Range Prediction Using Machine Learning: A Feature-Based Comparative Study
239
