
Assessment of the Market Value of Football Player in the European
League
Yao Liu
a
Shanghai Normal University, school of mathematics and science, Shanghai, 200000, China
Keywords: Market Value, Multi Linear Regression, Random Forest.
Abstract: In recent years, more and more money has been spent on the football transfer market. To utilize funds
efficiently, assessment of the market value is indispensable. After collecting the performance of the top 5
European Leagues (Premier League, Ligue 1, Bundesliga, Serie A and La Liga) football players in 2022-2023
season from Kaggle and Market Value from the transfer-market, this paper uses Multi Linear regression and
Random Forest model to give an insight into the correlation between Market Value and the performance
variables. This paper not only compares the Multi Linear Regression model and Random Forest model to
determine which one is better but investigates the important variables of the Market Value. Based on the
results of this paper, it can be inferred that minutes that player played is the most important variables. In
summary, with assessing the performance of the football player, the article gains insights into market value
of the football player and help the football club utilize the funds more reasonably.
1 INTRODUCTION
With the popularity of the transfer market, the costs
in the transferring market also have seen a significant
increasing. In the past ten years, the general transfer
fees for football player have inflated over 110%
compared to their market value (Poli, 2023).
However, according to Gerhards et al., the high
market value player plays an indispensable role for a
team to win the championship (Gerhards, 2017).
Hence, more and more professional clubs and
scholars started constructing their own assessment
system, aiming to choose the suitable player in a
reasonable price.
The assessment system of football players is
complex with many indexes have taken into
consideration. Therefore, Metelski investigated from
the single football league, Ekstraklasa and used
descriptive statistics and statistical tests. He pointed
out the importance of age. The top football clubs tend
to choose the talented young players as they can
easily adapt to new style and tactics (Metelski 2021).
Rodríguez selected three European Football Leagues
(Premier League, Bundesliga and Serie A) for
comparison. He explored that different Leagues
usually focus on different factors. The Premier
a
https://orcid.org/0009-0000-1860-4695
League pays more attention to experience,
performance in the previous season and assistances
matches. In Germany, people care about goals and
assists. However, in Italy, age and experience and
substitutions are the top priority (Serna, 2021). In
order to simplify and quantify the performance of the
football player, He et al. performed the Least
Absolute Shrinkage and Selection Operator (LASSO)
regression to determine whether the market value of
the player was overrated or underrated. The better a
plyer performed, the higher market value they would
get (He et al., 2015). Majewski utilized ordinary least
square (OLS) and feasible generalized least square
(FGLS) methods to figure out the economic potential
of players. He also emphasized the importance of
econometric modelling in assessing player value
(Majewski, 2021). By using the Chi-square test,
Mario et al. identified six factors (nationality,
chronological age, laterality, playing position,
international player condition and sports training
condition) in the top five European Leagues which
would influence the market value (Sánchez et al.,
2022).
Lots of researchers were devoted to studying the
influencing factors of market values of the football
player and forecasting the market value. Müller et al.
226
Liu, Y.
Assessment of the Market Value of Football Player in the European League.
DOI: 10.5220/0013822600004708
Paper published under CC license (CC BY-NC-ND 4.0)
In Proceedings of the 2nd International Conference on Innovations in Applied Mathematics, Physics, and Astronomy (IAMPA 2025), pages 226-232
ISBN: 978-989-758-774-0
Proceedings Copyright © 2025 by SCITEPRESS – Science and Technology Publications, Lda.

built a multilevel regression model and exploited the
data-driven approach to identify several factors to
estimate the market value. The model provides
accurate prediction for the low-to- medium- priced
player. The study demonstrated the data-driven
estimation of market value has wider application
(Müller et al., 2017). AL-ASADI et al. applied
supervised machine learning to analyze different
variables that reflect the skills and characteristics of
football players. With combined Train and Test Split,
the model contributed to the evaluation of the market
value of players (Al-Asadi et al., 2022). Sun et al.
focused on prediction of Football Players’ Value by
presenting Decision Tree Regression (DTR), Random
Forest Regression (RFR) and Rhizostoma
Optimization Algorithm (ROA). The research
modelled the relationship between the performance
and market value of players across different European
Football Leagues. By employing a robust statistical
methodology, the study improved the accuracy of
market value predictions (Sun et al., 2024). Patnaik et
al. explored the influence of goals and assists to the
market value, by comparing three different models
(Crowd-based Estimation, Multilevel Regression and
Option based). By integrating advanced statistical
methods, the study provided a robust model for
predicting the transfer market value of football
players (Patnaik et al., 2019).
In light of the diverse perspectives and
methodologies employed in previous research, this
research conducted a study of the correlation between
the performance and the market value of the player.
By comparing Multi Linear Regression and Random
Forest Regression, this paper seeks to investigate the
key factors influencing a player’s market value.
2 METHODOLOGY
2.1 Data Source
The dataset used in this study is fetched from the
Kaggle website. The dataset includes 2,451 players
and 124 indicators measuring various aspects of
player performance in the Big Five European Leagues
(Premier League, Ligue 1, Bundesliga, Serie A and
La Liga) throughout the 2022–2023 season, which
was collected by Vinco from the ‘Football Reference’.
Furthermore, the current value on the market of each
player was extracted from Transfer-market, a widely
recognized platform for football valuation.
2.2 Variable Selection
The original dataset consists of over 100 variables,
encompassing technical skills, playing time, passing
accuracy, defensive actions, and more. However, a
substantial portion of these variables contained
missing values, which could adversely affect model
performance and interpretability. To enhance both the
efficiency and effectiveness of modelling process,
this paper applied correlation analysis to identify the
most informative predictors. As a result, this paper
selected the top 12 most relevant variables based on
their statistical significance.
2.3 Method Introduction
This article is going to use the multi linear regression
and Random Forest Regression to analyse the
relationship of the player and their market value. By
applying the log- transformation, this paper will
compare the significance of the two models and the
accuracy of the results. Eventually, it will enable the
selection of the optimized processing of models.
Multiple Linear Regression is a linear regression
model used to reveal the relationship between a
dependent variable and two or more independent
variables. The general form of the multiple linear
regression model is:
𝑦=𝛽
+𝛽
𝑥
+𝛽
𝑥
+⋯+𝛽
𝑥
+𝜀 (1)
In this paper, y represents the market value of the
player and 𝑥
, 𝑥
are independent variables, each
contributing to the linear relationship with 𝑦. The last
term of this formula represents the error term or the
residual, capturing the unobserved factors that affect
𝑦 but are not accounted for by the independent
variables in the model.
Random Forest Regression is a machine learning
algorithm that uses decision trees to predict
continuous outcomes. Through this application, the
article will uncover insights into various player
performance.
3 RESLUTS AND DISCUSSION
3.1 Descriptive Analysis
Before analysing the model, this paper conducts the
descriptive analysis of the dataset.
Assessment of the Market Value of Football Player in the European League
227
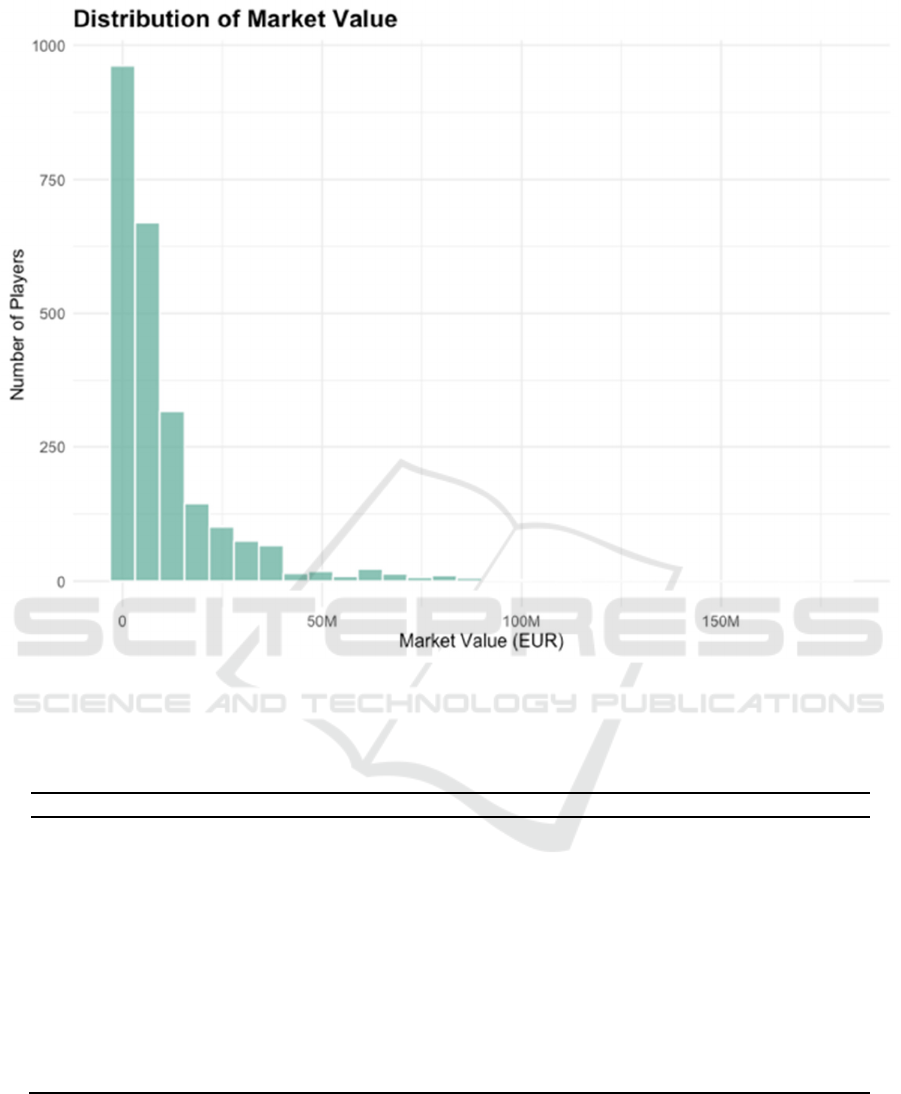
Figure 1: Distribution of Market Value (Picture credit: Original)
Table 1: Top 12 most relevant variables
Variable Coefficient
Goals 0.452
Starts 0.328
Min 0.326
X90s 0.326
MP 0.288
Rec 0.215
PasShoCmp 0.197
PasLonCmp. 0.193
PasShoAtt 0.192
TouAttPen 0.190
CPA 0.184
G.SoT 0.182
The bar chart in Figure 1 presents the distribution of
player market values in euros. It shows that the
majority of players have market values under 10
million. As market values increases, the number of
players has significantly decreased. However, a small
number of players have exceptionally high market
values, creating a long tail stretching towards the right
(up to and beyond 100 million).
IAMPA 2025 - The International Conference on Innovations in Applied Mathematics, Physics, and Astronomy
228
3.2 Correlation Results
The output of the correlation shows in the Table 1.
Therefore, in the following study, there will be 12
variables (Goals, Starts, Min, 90s, MP, Rec,
PasShoCmp, PasLonCmp%, PasShoAtt, TouAttPen,
CPA, G/Sot) and one dependent variable (Market
Value). The specific description of this dataset is
shown in Table 2.
3.3 Multi Linear Regression
The paper started to establish the Multi Linear model.
Based on the results of the model analysis in Table 3,
several variables showed statistically significant
relationships with the dependent variable, which
would be interpreted as follows:
It is indicated in Table 3 that Goals and CPA have
a strong positive impact, with each additional goal
and each carry into the 18-yard box are associated
with an estimated increase of over 3 million units and
almost 2 million units respectively. While the
PasShoCmp also have a significant impact, with each
additional completed pass between 5 and 15 yards can
increase approximately 661290 units in the Market
Value. By contrast, the G.SoT has a large negative
coefficient, over 5 million units. The MP also has an
insignificant impact, each additional match played
lead to 685300 decreasing for the Market Value.
From the above descriptive analysis, the
distribution of the Market Value is heavily right-
skewed. This uneven distribution justifies the use of
log transformation:
𝑦=log 1+𝑀𝑎𝑟𝑘𝑒𝑡 𝑉𝑎𝑙𝑢𝑒 (2)
In the regression model, this transformation helps to
stabilize variance and normalize the data. Hence, a
log-transformed was applied to the dependent
variable (Market Value). To assess the accuracy of
the transform, the article compared the residuals
between the log-transformed and the untransformed
model.
The study would analysis the plots in Figure 2 and
Figure 3:
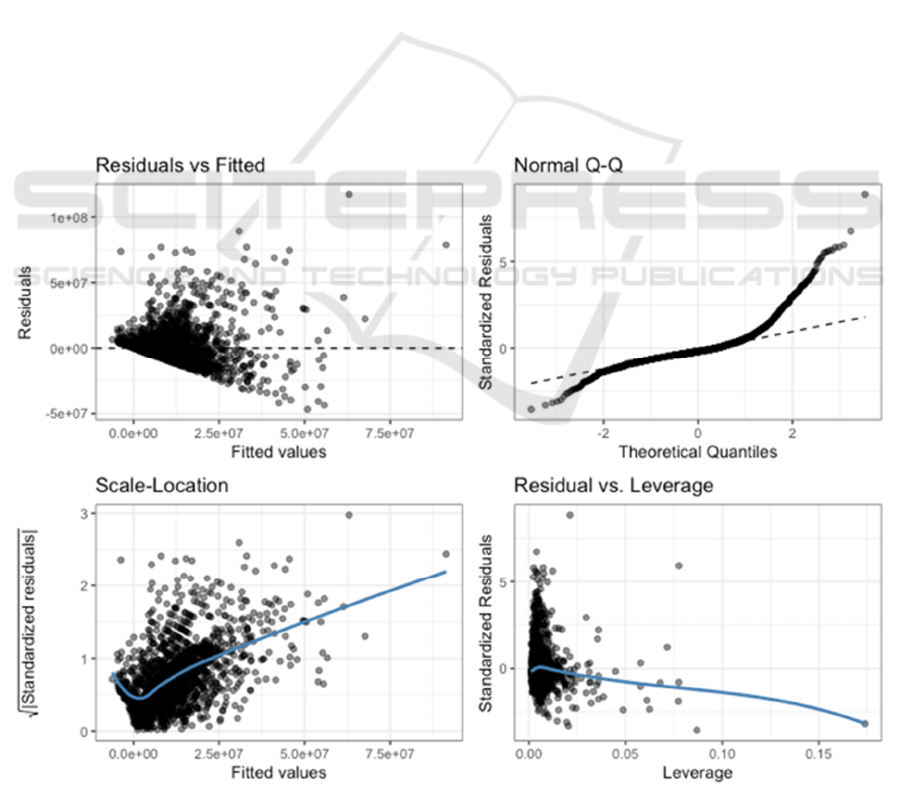
Figure 2: Residuals of untransformed (Picture credit: Original)
Assessment of the Market Value of Football Player in the European League
229
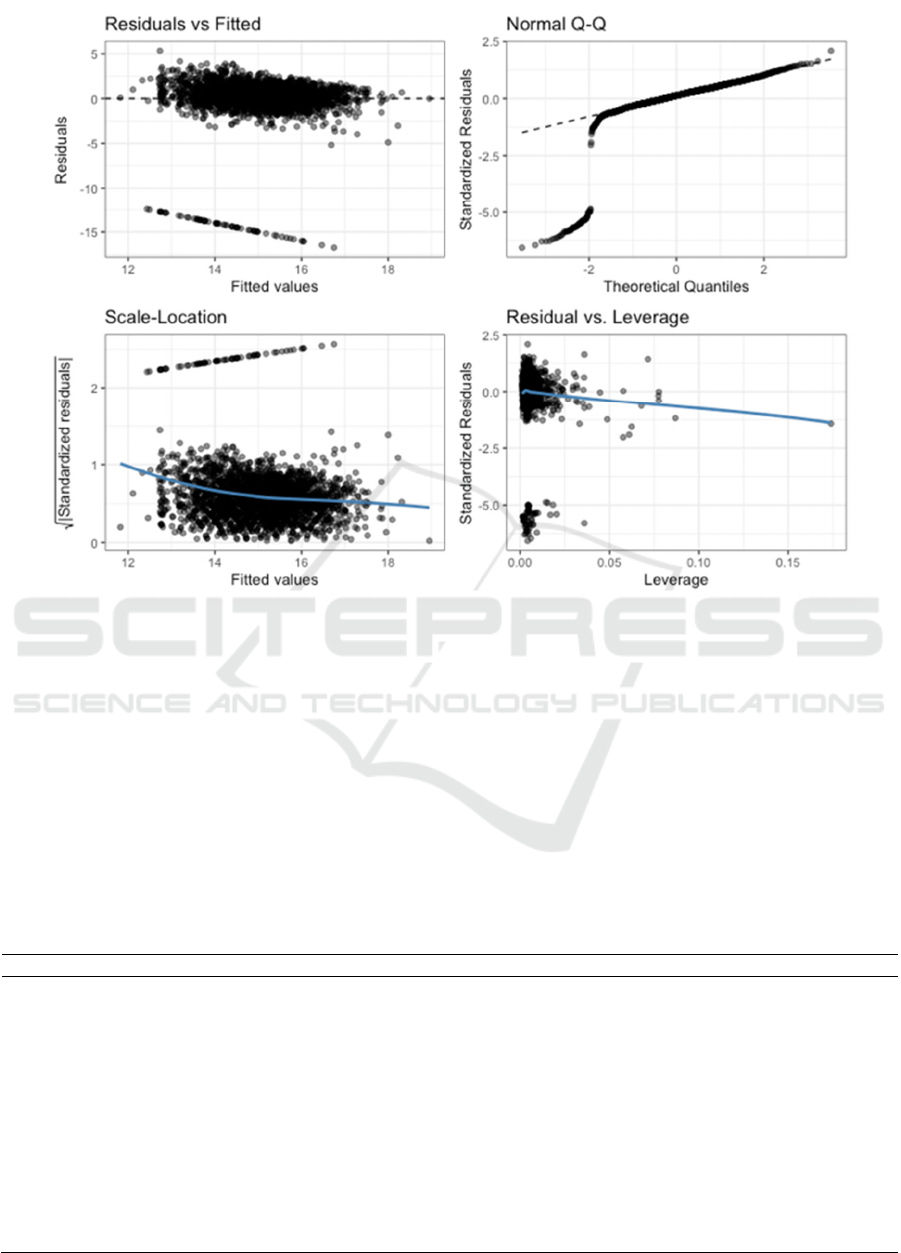
Figure 3: Residuals of Log-transformation (Picture credit: Original)
Residuals vs Fitted: The log-transformation made the
residuals more random which effectively mitigates
heteroscedasticity.
Normal Q-Q plot: Although the log-
transformation has deviation at the tails, most of the
standardized residuals align closer to the diagonal.
But the untransformed indicated non-normality of
both tails.
Scale-Location: The log-transformation has more
random scattering of residual points - but still a
cluster in the middle compared with the
untransformed model.
Residual vs Leverage: The log-transformation has
fewer high-leverage points, while the untransformed
has some high-leverage points with large residuals.
Hence, the log-transformation model significantly
improves the accuracy of the evaluation.
Table 2: List of Variables
Logogram Meaning
Goals
𝑥
Goals scored or allowed
Starts
𝑥
Matches started
Min
𝑥
Minutes played
X90s
𝑥
Minutes played divided by 90
MP
𝑥
Matches playe
d
Rec
𝑥
Number of times a player successfully received a pass
PasShoCmp
𝑥
Passes completed (Passes between 5 and 15 yards)
PasLonCmp.
𝑥
Pass completion percentage (Passes longer than 30 yards)
PasShoAtt
𝑥
Passes attempted (Passes between 5 and 15 yards)
TouAttPen
𝑥
Touches in attacking penalty area
CPA
𝑥
Carries into the 18-yard box
G.SoT
𝑥
Goals per shot on target (Does not include penalty kicks)
Market Value
𝑌
Market Value from Transfermarket
IAMPA 2025 - The International Conference on Innovations in Applied Mathematics, Physics, and Astronomy
230
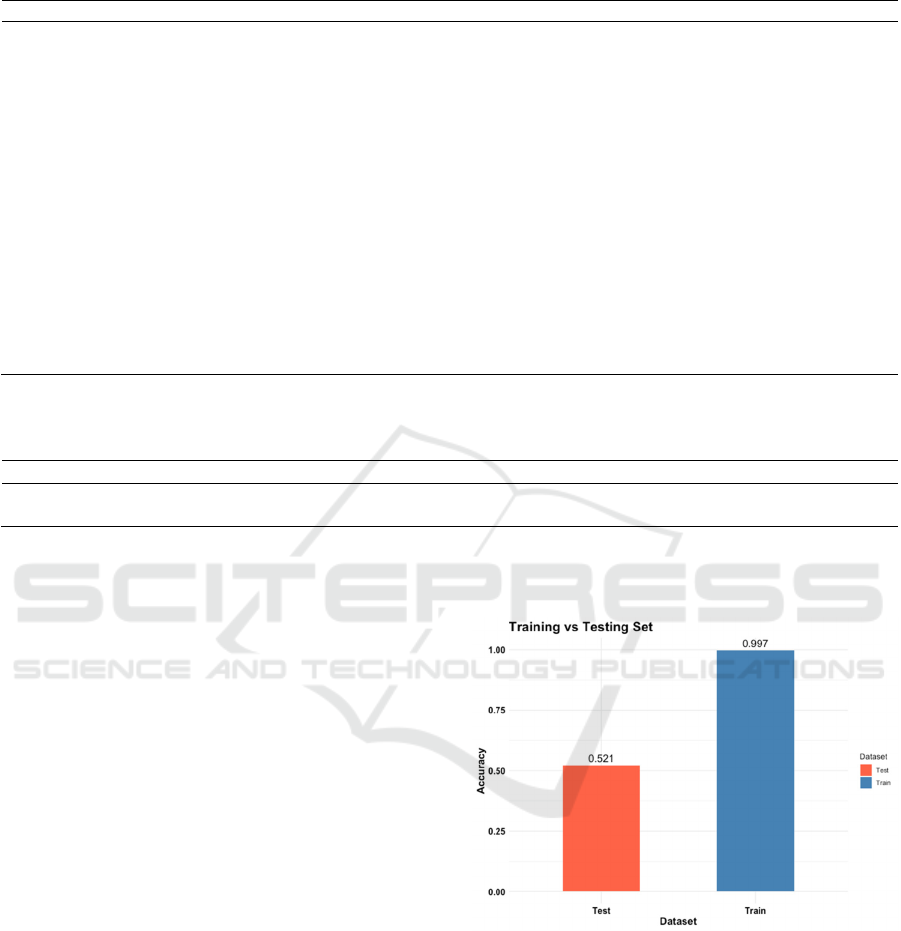
Table 3: Multi Linear Model analysis results
Coefficient SE t
p
Constant -3117942 913976 -3.411 0.000657***
Goals 3201562 176591 18.13 < 0.001***
Starts -587654 312116 -1.883 0.059846
Min -76819 108045 -0.711 0.47716
X90s 8621678 9713056 0.888 0.374823
MP -685300 104864 -6.535 < 0.001***
Rec 66373 34393 1.93 0.053744
PasShoCmp 661290 180829 3.657 0.000261***
PasLonCm
p
. 40551 12903 3.143 0.001694**
PasShoAtt -342529 169739 -2.018 0.043703*
TouAttPen 422413 162880 2.593 0.00956**
CPA 1897253 435146 4.36 < 0.001***
G.SoT -5317837 1217966 -4.366 < 0.001***
R
2
0.3162
Ad
j
ust R² 0.3129
Dependent variable: Market Value
*
p
<0.05 **
p
<0.01***
p
<0.001
Table 4: Regression Model Evaluation Results
MAE RMSE R
2
Multi linear regression
1.365600 2.706930 0.097
Random Forest 1.327004 2.685046 0.111
3.4 Model Comparison
After dealing with the Multi Linear Regression model,
the study started building the Random Forest Model.
The dataset was split into 70% training and 30%
testing to evaluate the model.
The article would compare the Multi Linear
Regression model and the Random Forest model to
determine which model is more accurate. In order to
choose the best model, this paper compared Mean
Absolute Error (MAE), Root Mean Absolute Error
(RMSE) and R-squared(R
2
), where the lower MAE
and RMAE values indicate better predictive accuracy
and the higher R
2
value indicates the higher
interpretation of the variables.
It can be drawn from Table 4 that Random Forest
outperforms the Multiple Linear Regression model
across all three metrics, though the differences are
relatively small. The Random Forest model has lower
MAE and RMSE values and higher R
2
value. Hence,
this paper will choose the Random Forest model to
evaluate the football player market value.
3.5 Model Results
After choosing the best model, the analysis of the
Random Forest model is reckoned, including the
accuracy of the training and testing set and variables
importance.
Figure 4: Training vs Testing Set (Picture credit:
Original)
In Figure 4, the bar chart compares the classification
accuracy of the random forest model on the training
and testing datasets. It can be noticed from Figure 4
that the training accuracy is 0.997, while the test
accuracy is only 0.521. The training accuracy is
nearly perfect, which indicates that the model has
learned the training data extremely well. However,
the testing accuracy drops significantly to around
52%, indicating a substantial decline in performance
when the model is applied to unseen, new data.
Assessment of the Market Value of Football Player in the European League
231
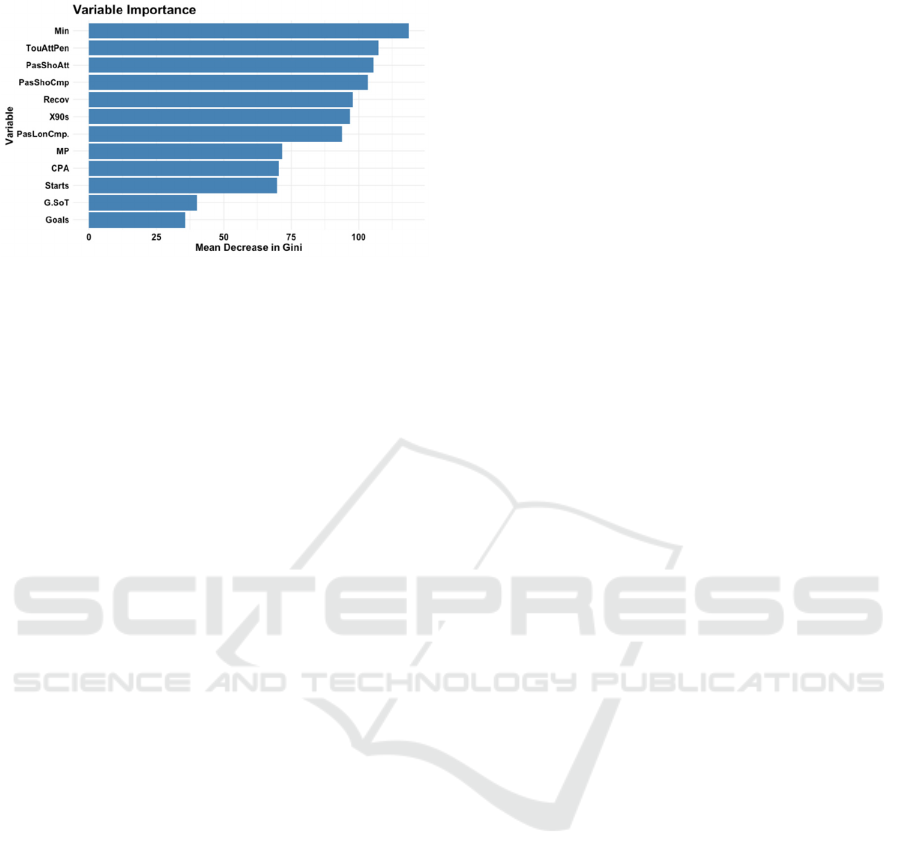
Figure 5: Variable Importance (Picture credit: Original)
The figure 5 used Mean Decrease in Gini, which
measures how much each variable contributes to
reducing the impurity in the decision trees that make
up the model. It is indicated in figure 5 that among all
predictors, Min (minutes played) shows the highest
importance score, exceeding a value of 110. This
suggests that playing time is the most influential
factor in the model’s decision-making process. The
other indispensable variables are the TouAttPen,
PasShoAtt and PasShoCmp with over 100 mean
decreases in Gini. These variables play a critical role
in reducing impurity across decision trees. By
contrast, the Goals and G.SoT appear at the bottom of
the chart, with values below 40.
4 CONCLUSION
Overall, the regression model evaluation results
indicate the Random Forest Regression has better
performance. Although the Random Forest model
slightly outperformed the linear regression model in
terms of predictive accuracy, it also exhibited signs of
overfitting, as evidenced by a high training accuracy
(0.997) and a relatively low testing accuracy (0.521).
By analysing the importance of the variables of the
Random Forest model, the paper identified key
performance metrics that significantly influence
market value. The Min (Minutes played),
TouAttPen(Touches in attacking penalty area) and
PasShoAtt(Passes attempted between 5 and 15 yards)
have a strong positive impact on market value, while
Goals (Goals scored or allowed) and G.SoT (Goals
per Shot on Target) show significant negative effects.
Therefore, the football club may prioritize the key
player who consistently receive substantial playing
time and they can focus on the attack player as they
touch more in attacking penalty area compared with
other player. However, one thing that cannot be
ignored is that the dataset used in this study only
contains one season which means it is difficult to
apply to other time series. Further research could be
implemented in the future, aiming to use different
methods to analyze several seasons to improve the
applicability.
REFERENCES
Al-Asadi, M. A., Tasdemır, S., 2022. Predict the value of
football players using FIFA video game data and
machine learning techniques. IEEE access, 10, 22631-
22645.
Gerhards, J., Mutz, M., 2017. Who wins the championship?
Market value and team composition as predictors of
success in the top European football leagues. European
Societies, 19(3), 223-242.
He, M., Cachucho, R., Knobbe, A. J., 2015. Football
Player's Performance and Market Value. MLSA, 87-95.
Majewski, S., 2021. Football players' brand as a factor in
performance rights valuation. Journal of Physical
Education and Sport, 21(4), 1751-1760.
Metelski, A., 2021. Factors affecting the value of football
players in the transfer market. Journal of Physical
Education and Sport, 21, 1150-1155.
Müller, O., Simons, A., Weinmann, M., 2017. Beyond
crowd judgments: Data-driven estimation of market
value in association football. European Journal of
Operational Research, 263(2), 611-624.
Patnaik, D., Praharaj, H., Prakash, K., Samdani, K., 2019.
A study of Prediction models for football player
valuations by quantifying statistical and economic
attributes for the global transfer market. In 2019 IEEE
International Conference on System, Computation,
Automation and Networking (ICSCAN), 1-7.
Poli, R., Besson, R., Ravenel, L., 2023. Inflation in the
football players’ transfer market. CIES Football
Observatory Monthly Report, 82.
Sánchez, M., Orgaz, B., Ramirez Campillo, R., Nakamura,
F. Y., Luis Pereira, J. M., Carretero, M., Sánchez
Sánchez, J., 2022. Factors associated to the market
value of professional soccer players. CIES.
Serna Rodríguez, M., 2021. Factor analysis of the market
value of high-performance players for three major
European association football leagues. Managing Sport
and Leisure, 26(6), 484-507.
Sun, Y., Gu, K., 2024. Prediction of Football Players’ Value
in the Transfer Market of Well-known European
Leagues based on FIFA 19 and Real-world Data.
International ARAB journal of information technology,
21(4), 723-740.
IAMPA 2025 - The International Conference on Innovations in Applied Mathematics, Physics, and Astronomy
232
