
Sentiment Analysis of Social Media Use in Public Transportation in
Sweden
Azadeh Sarkheyli
1a
and Elnaz Sarkheyli
2b
1
School of Information Technology, Halmstad University, Halmstad, Sweden
2
Institute for Urban Studies, Department of Urban Studies, Malmö University, Malmö, Sweden
Keywords: Social Media, Public Transportation, Sentiment Analysis, Sweden.
Abstract: The increasing impact of social media on public transportation is transforming communication strategies and
user engagement. These platforms offer real-time service updates while allowing users to voice their concerns
and suggestions, fostering trust and enhancing customer satisfaction. This research investigates public
perceptions of the communication methods used by public transportation services in Sweden, highlighting
user preferences for different social media platforms and content types. The study employs a four-step
methodology. First, a literature review examines the advantages and challenges of integrating social media
into public transportation systems. Next, a survey assesses Swedish users’ interactions with social media in
this context. The third phase involves sentiment analysis and text mining of the survey responses to evaluate
public opinion. Finally, the research proposes potential steps for collecting and analyzing social media data.
The findings contribute to a better understanding of effective communication strategies, ultimately improving
the responsiveness of public transportation systems.
1 INTRODUCTION
Sentiment analysis utilizes natural language
processing and machine learning techniques to
identify and extract subjective information from text,
allowing for the classification of sentiments as
positive, negative, or neutral. This method has gained
significant popularity due to its capacity to analyze
vast quantities of unstructured data derived from
sources such as social media (Yue et al., 2019).
Social media analytics encompasses the collection
and examination of data from social media platforms
to derive insights into user behavior and emerging
trends. This process includes monitoring interactions
and evaluating content performance, which can
ultimately influence and shape public perception
(Rodríguez-Ibánez et al., 2023; Chowdhury, 2024).
According to Rodríguez-Ibánez et al. (2023),
sentiment analysis has become a prominent research
area since 2008, as evidenced by the increasing
number of published studies. The research focus has
varied widely, encompassing emergencies, business
intelligence, marketing, and the prediction of
a
https://orcid.org/0000-0002-5390-7509
b
https://orcid.org/0000-0003-2618-8796
electoral outcomes.
Consequently, there are numerous examples of
sentiment analysis within social media, including the
work by Brahami et al. (2025), who developed a
sentiment analysis model using Knowledge Graph
Convolutional Networks (KGCN) to analyze over
410,000 tweets related to the Russia–Ukraine
conflict. This model achieved an accuracy of around
89%, demonstrating that the incorporation of
knowledge graphs significantly enhances sentiment
classification. This method also offers promising
potential for real-time monitoring of public opinion,
with substantial implications for policy. Another
example is the study by Salisu et al. (2024), which
examined sentiments expressed in comments on the
official Instagram account of Universitas
Widyagama. Their findings indicate effective
promotion of a positive image through social media
and highlight the potential of sentiment analysis for
strategic communication in higher education.
In addition, Abeysekera (2024) studies customer
attitudes toward a pop-up tax clinic in Australia that
helps disadvantaged taxpayers. Analysis of feedback
522
Sarkheyli, A. and Sarkheyli, E.
Sentiment Analysis of Social Media Use in Public Transportation in Sweden.
DOI: 10.5220/0013821100004000
Paper published under CC license (CC BY-NC-ND 4.0)
In Proceedings of the 17th International Joint Conference on Knowledge Discovery, Knowledge Engineering and Knowledge Management (IC3K 2025) - Volume 2: KEOD and KMIS, pages
522-528
ISBN: 978-989-758-769-6; ISSN: 2184-3228
Proceedings Copyright © 2025 by SCITEPRESS – Science and Technology Publications, Lda.

from 47 clients showed that free services and good
customer care improved sentiment, while factors like
tax year and location had little impact. The findings
indicate the potential of such clinics to reduce
inequality and offer a new method for evaluating
social enterprises through sentiment analysis.
A pertinent example relevant to this research is the
study conducted by Torres and de Picado-Santos
(2025), which examines 81 open-access research
papers published between 2014 and 2024 that focus
on sentiment analysis and topic modeling within the
field of transportation. It underscores the success of
these techniques, particularly when applied to social
media data, in gaining insights into user attitudes and
fostering sustainable mobility. Significant obstacles
include linguistic variety and the diversity of data
types, prompting the authors to suggest a framework
for selecting studies and performing bibliometric
analysis. The paper points out the opportunities
presented by integrating these methodologies to guide
the development of more intelligent and inclusive
transportation policies.
Therefore, the role of social media in public
transportation is increasingly recognized as vital for
improving communication and user engagement.
These platforms facilitate real-time updates on
service statuses and allow users to voice concerns and
suggestions quickly (Aman & Smith-Colin, 2021; Liu
& Ban, 2017).
Social media creates a dynamic environment for
two-way communication between transit authorities
and the public, fostering trust and enhancing
customer satisfaction by addressing user feedback
directly (Liu & Ben, 2017; Zeng & Gerritsen, 2014;
Kwok & Yu, 2013).
Additionally, engaging users on these platforms
encourages community involvement and a sense of
ownership over services (Han et al., 2020). This study
explores public sentiment toward communication
strategies used by public transportation services in
Sweden, analyzing user preferences for social media
platforms and content types that resonate most.
Understanding these aspects is crucial for enhancing
communication strategies and creating a more
responsive public transportation system (Sarkheyli &
Sarkheyli, 2024; Han et al., 2020; Bergman, 2012).
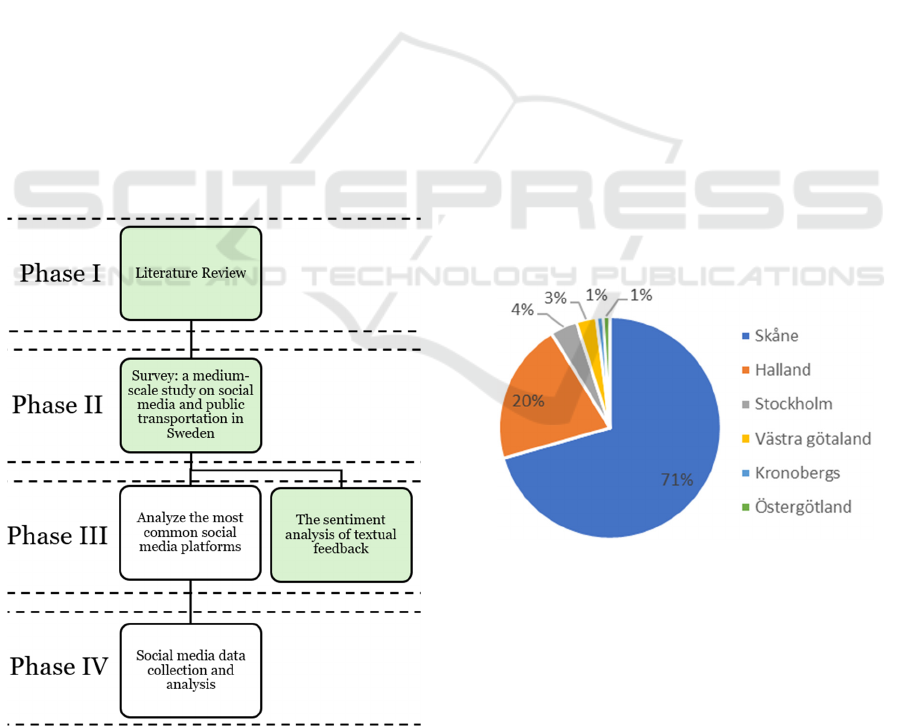
This study is structured into four phases. In the
first phase, we conducted a literature review to
examine insights into social media usage in research,
particularly examining the advantages and
disadvantages of employing social media within the
scope of public transportation. The second phase
involved a survey to understand how individuals in
Sweden utilize social media for public transportation,
serving as a medium-scale study. In the third phase,
we performed sentiment analysis and text mining on
the survey comments to evaluate public sentiment
regarding the use of social media for public
transportation in Sweden. The fourth phase, which is
related to social media data collection and analysis, is
mentioned for the next step of this research. It is
informed by the findings from the preceding phases
(refer to Figure 1).
2 SOCIAL MEDIA AND PUBLIC
TRANSPORTATION IN
SWEDEN
Social media has become an integral tool for public
transportation agencies in Sweden and Europe to
engage with passengers and improve services. Transit
operators primarily use platforms like Facebook and
X for real-time updates, service information, and
addressing customer concerns (Sarkheyli &
Sarkheyli, 2024; Georgiadis et al., 2020). A survey of
European agencies found Twitter (or X as its new
name) most effective for short communications and
service updates. At the same time, Facebook was
valid for announcements and community building
(Georgiadis et al., 2020).
Transit agencies in the United States and Canada
have adopted social media for timely updates, public
service, and citizen engagement (Bregman, 2012).
During unplanned rail disruptions, social media,
particularly Twitter, proves valuable for providing
concise, real-time information to passengers.
However, challenges remain, including staff
resourcing and managing passenger expectations
(Nikolaidou & Papaioannou, 2018). Social media
integration in public transportation offers new
opportunities for improving urban mobility systems
(Sarkheyli & Sarkheyli, 2024).
According to the SWOT analysis of using social
media in public transportation, social media offers
public transportation agencies valuable advantages
such as data access, direct passenger communication,
and cost-effective service promotion, enhancing
customer satisfaction and loyalty.
However, it requires resources and presents
challenges like data privacy issues, negative
feedback, and limited accessibility. Opportunities for
improvement include leveraging passenger feedback
and building community partnerships, while threats
consist of cybersecurity risks, evolving regulations,
and competition from ride-sharing services. Agencies
need to strategically manage these factors to
Sentiment Analysis of Social Media Use in Public Transportation in Sweden
523
maximize benefits (Sarkheyli & Sarkheyli, 2024;
Kaplan & Haenlein, 2010; Mangold & Faulds, 2009;
Munar & Jacobsen, 2014).
3 RESEARCH METHODOLOGY
The research has been organized into four phases. In
Phase I, a literature review was conducted to
understand the main concepts of the study. Phase II
involved distributing an online questionnaire to
gather insights on how individuals in Sweden utilize
social media platforms for public transportation. The
survey targeted a diverse group of respondents,
including students, teachers, researchers, engineers,
doctors, and other professionals living and working in
Sweden, to capture a different range of perspectives.
In Phase III, the data collected from the survey
underwent a thorough analysis using sentiment
analysis and text-mining techniques to uncover
patterns and sentiments expressed in the responses.
Each response was categorized into three sentiment
classes: positive, negative, or neutral. Finally, Phase
IV analyzes social media platforms identified in the
earlier phases. This paper presents results from
Phases I, II, and III, specifically the sentiment
analysis, as illustrated in Figure 1.
Figure 1: The research process.
The sentiment analysis utilized two tools:
VADER (Valence Aware Dictionary and sEntiment
Reasoner), which employs a lexicon-based approach,
and XLSTAT, which incorporates statistical and
machine learning techniques (Yordanova et al.,
2021). VADER is ideal for sentiment analysis as it
effectively handles social media nuances like slang
and emoticons, which traditional methods often miss.
It uses a scoring system to assess positive, negative,
and neutral terms, providing accurate and fast
analyses (Dixit et al., 2025).
The research combines XLSTAT and VADER for
sentiment analysis, enhancing accuracy with user
feedback on public transportation. Key themes were
identified and visualized in charts for clarity and
comparison.
4 RESULTS AND DISCUSSION
An online survey gathered 106 responses, with
approximately 49% females and 46% males, averaging
37 years of age. The educational attainment showed
that 36% held Doctorates or University/College
degrees, 21% had Master's degrees, 4% were High
School graduates, 2% completed Vocational training,
and 1% fell into the other category. In terms of
geographical distribution in Sweden, Skåne accounted
for 71% of the responses, followed by Halland at 20%,
while Stockholm, Västra Götaland, Kronobergs, and
Östergötland represented smaller shares of 4%, 3%,
1%, and 1%, respectively (see Figure 2).
Figure 2: The city/region of the respondents.
Figure 3 illustrates the use of various social media
platforms for communication purposes. Instagram is
the most frequently used platform, with a value
slightly above 60, followed closely by Facebook, also
above 60. LinkedIn is the third most utilized platform,
with usage close to 50. Other types of social media
have moderate use, reaching around 30, while X
(formerly Twitter) is used less, with a value of 20.
TikTok has the lowest usage for communication
purposes, with a value below 10.
KMIS 2025 - 17th International Conference on Knowledge Management and Information Systems
524
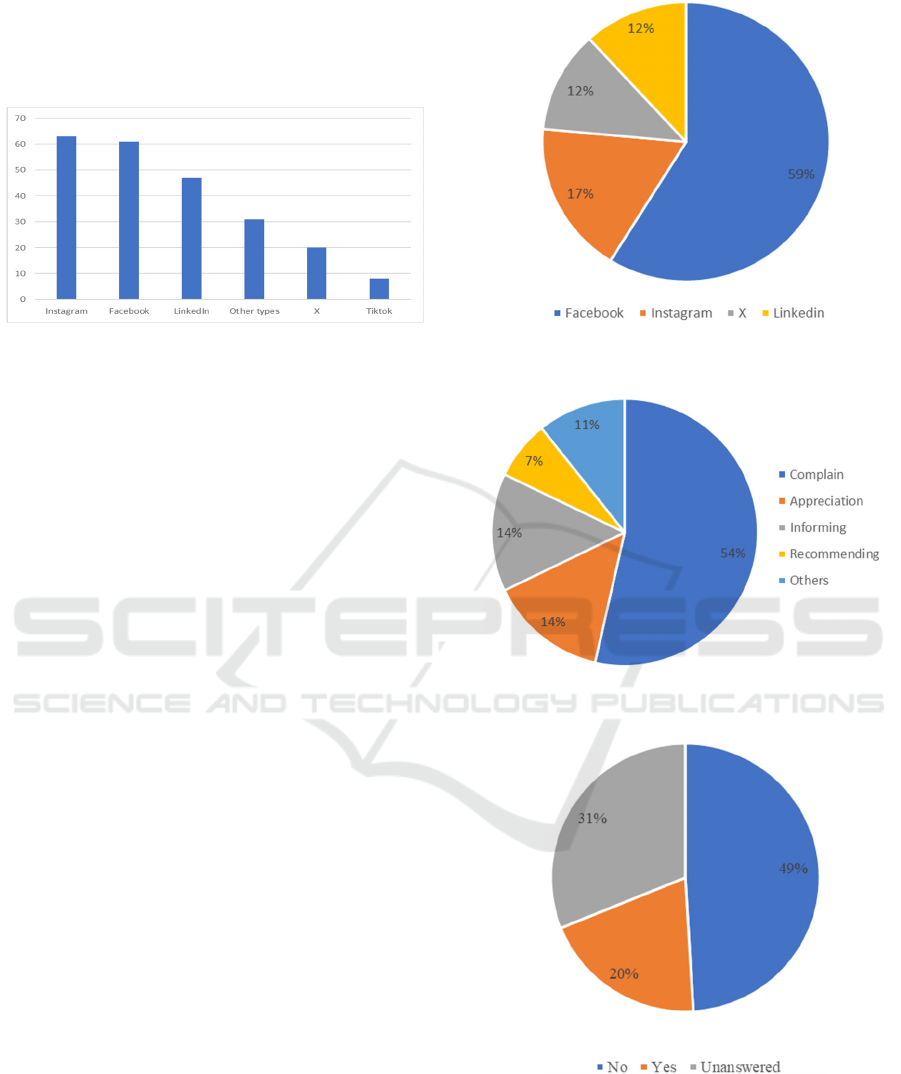
The chart indicates that visual and text-based
platforms like Instagram and Facebook are the most
preferred for communication, while TikTok, known
for short-form videos, is the least used in this context.
Figure 3: Use of social media for communication purposes.
4.1 Social Media Usage for Public
Transport
Figure 4 shows the distribution of social media usage
for public transport-related purposes across different
platforms. Facebook dominates with 59%, indicating
that it is the most used platform for sharing and
accessing public transport information, updates, or
discussions. Instagram follows with 17%, suggesting
moderate engagement, possibly for visual content
related to public transport. Both X (formerly Twitter)
and LinkedIn have equal shares of 12%, indicating a
lower but still notable usage, likely for real-time
updates (X) and professional discussions or policy-
related content (LinkedIn).
The chart highlights that Facebook is the primary
platform for public transport engagement, while other
social media channels have significantly smaller
shares. Regarding social media engagement, the
survey found that 54% of respondents expressed
dissatisfaction with public transportation. In contrast,
14% of posts or comments conveyed appreciation,
another 14% were focused on providing information,
7% were recommendations, and the remaining 11%
encompassed a range of other topics (see Figure 5).
As highlighted by the survey results (refer to
Figure 6), nearly half of the respondents, precisely
49%, reported not participating in posting or
commenting on social media. Conversely, a smaller
percentage, precisely 20% of the respondents,
indicated they were actively engaged on various
social media platforms.
Figure 4: Usage of social media platforms for public
transportation.
Figure 5: Category of social media posts and comments
about public transportation by people.
Figure 6: Engaged in posting and/or commenting on social
media platforms about public transportation.
4.2 Sentiment Analysis
The sentiment analysis performed with XLSTAT
uncovered a spectrum of feedback from respondents
Sentiment Analysis of Social Media Use in Public Transportation in Sweden
525
about their experiences. Significantly, 60% of the
analyzed comments reflected positive sentiments,
with many users expressing appreciation for the
timely information updates and real-time alerts.
Conversely, 30% of respondents reported
dissatisfaction, citing concerns over outdated
information and a perceived lack of responsiveness.
Finally, 10% of the responses were categorized as
neutral, providing general feedback without strong
emotional overtones.
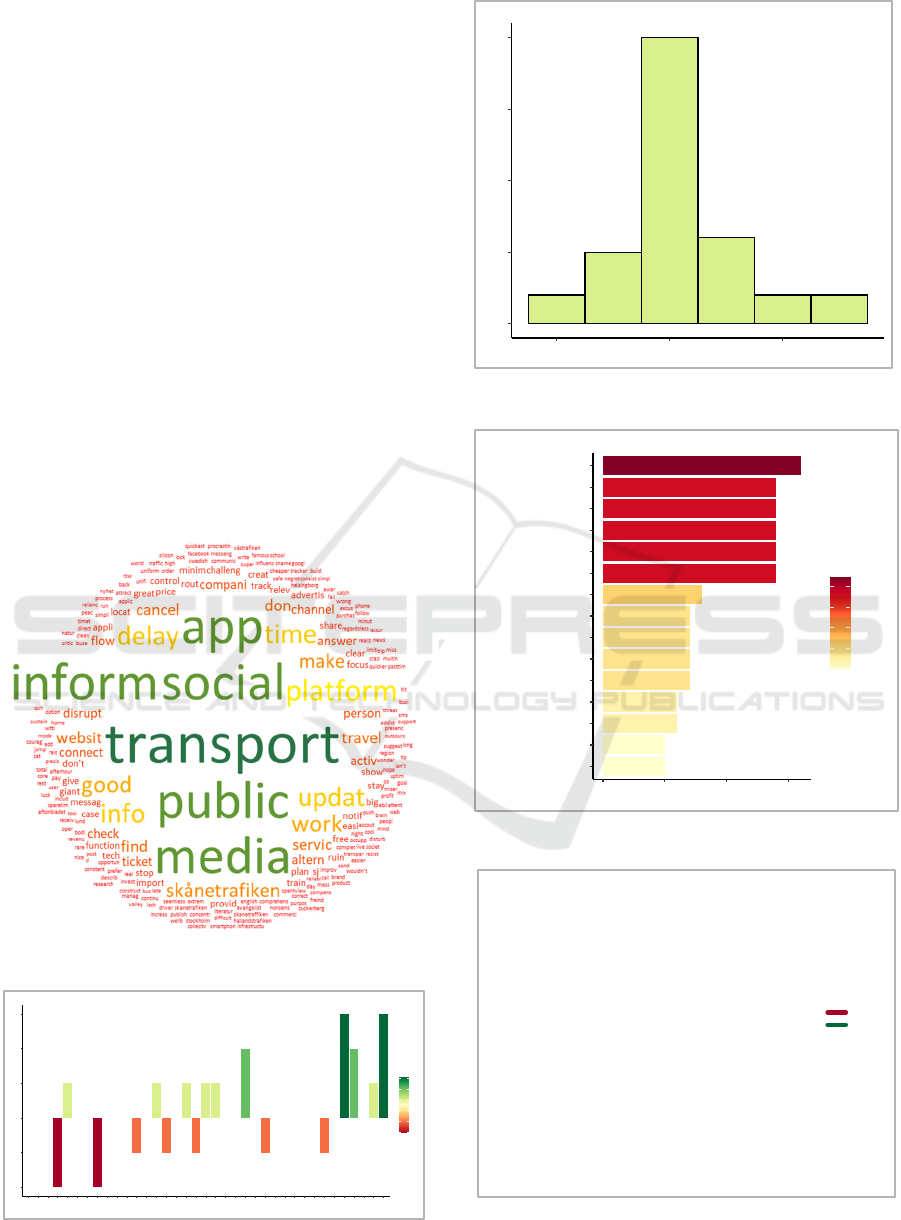
The comment word cloud is illustrated in Figure
7, while Figure 8 displays the document sentiment
scores. Additionally, Figure 9 presents the
distribution of document scores, and Figure 10 shows
term frequencies, indicating that a term's frequency
increases with the number of times it appears in the
documents.
Figure 11 shows the sentiment-based word cloud,
where the larger a term is in the word cloud, the more
frequent the term is in the document. Each color
represents an emotion. In addition, Figure 12 shows
the term scores, showing that the more positive a term
is, the higher its sentiment score will be.
Figure 7: Word cloud of the comments.
Figure 8: Document sentiment scores.
Figure 9: Document scores distribution.
Figure 10: Term frequencies.
Figure 11: Sentiment-based word cloud.
-2
-1
0
1
2
3
X1
X2
X3
X4
X5
X6
X7
X8
X9
X10
X11
X12
X13
X14
X15
X16
X17
X18
X19
X20
X21
X22
X23
X24
X25
X26
X27
X28
X29
X30
X31
X32
X33
X34
X35
X36
X37
Document
Sentiment score
Score
-2
-1
0
1
2
3
Document sentiment scores
0
5
10
15
20
-2 0 2
Document score
Frequency
Document scores distribution
make
sk.netrafiken
good
work
delay
info
time
updat
platform
app
inform
media
public
social
transport
051015
Frequency
Te r m
Frequency
5.0
7.5
10.0
12.5
15.0
Term frequencies
positive
delay
good
work
disrupt
ruin
clear
free
great
addict
critic
difficult
disturb
fail
lack
limit
mess
miser
miss
shame
threat
wrong
cheaper
clean
cool
correct
easier
famous
luck
nice
prefer
quicker
safe
super
support
wonder
negative
positive
KMIS 2025 - 17th International Conference on Knowledge Management and Information Systems
526
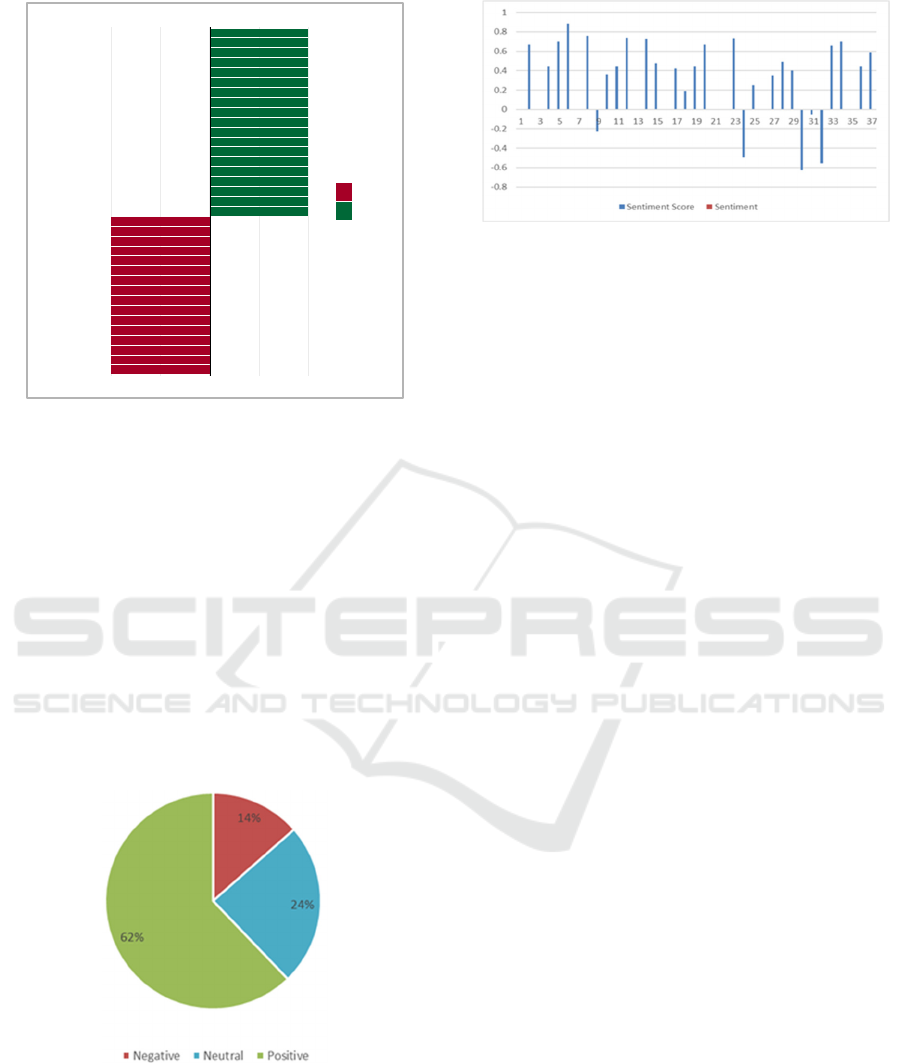
Figure 12: Term scores.
Figures 13 and 14 display the results of the
VADER sentiment analysis conducted on the textual
comments. The pie chart (Figure 13) illustrates the
distribution of comments' sentiment categories.
Positive sentiment comprises 62%, showing a clear
majority, while 24% is classified as neutral,
indicating a lack of strong feelings. Only 14% of the
data reflects negative sentiment, representing a
smaller portion. Overall, the chart highlights the
dominance of positive sentiments, with neutral and
negative sentiments being less prevalent. In addition,
Figure 14 shows that most sentiment scores are
positive, with values predominantly clustering
between 0.4 and 0.8.
Figure 13: VADER sentiment analysis result.
However, a few instances, specifically at indices
around 9, 25, 29, and 31, exhibit negative sentiment
scores, indicating some negative sentiment. The data
reflects fluctuations in sentiment, with occasional
dips into negative values, yet there is a clear overall
trend toward positive sentiment.
Figure 14: VADER sentiment scores.
4.3 Common Themes in Feedback
In analyzing the feedback, several key themes surfaced
prominently. Many respondents underscored the
importance of information accuracy, expressing a
strong desire for more reliable and timely updates
concerning transport services. Additionally, there was a
clear demand for enhanced engagement and interaction,
as users wished for more direct communication from
transport authorities on social media platforms.
Furthermore, the need for real-time alerts was
emphasized, with numerous users noting that instant
notifications regarding delays and disruptions would
greatly improve their overall experience.
The satisfaction levels among respondents were
notably varied. Approximately 40% reported feeling
neutral or having no strong opinion. Meanwhile, 35%
expressed dissatisfaction due to outdated or
inadequate information. On a more positive note,
25% of respondents indicated that they were satisfied
with the current state of social media communication.
5 CONCLUSIONS
Recent advancements in social media have made it
essential for companies to connect with a broader
audience and improve relationships.
This research examines how the public
transportation sector in Sweden uses social media to
enhance communication and services, structured into
four phases (see Figure 1). This paper presents survey
results and conducts sentiment analysis on comments
relevant to Phases I, II, and III.
The first phase involved a literature review on the
use of social media and its regulations in Sweden,
along with relevant studies on its application in public
transport. The second and third phases included a
survey of 106 Swedish residents to evaluate their use
of social media for public transportation.
The results indicated that apps like SJ and
Skånetrafiken are the most popular sources for
addict
critic
delay
difficult
disrupt
disturb
fail
lack
limit
mess
miser
miss
ruin
shame
threat
wrong
cheaper
clean
clear
cool
correct
easier
famous
free
good
great
luck
nice
prefer
quicker
safe
super
support
wonder
work
Sentiment score
Ter m
negative
positive
Te rm s co res
Sentiment Analysis of Social Media Use in Public Transportation in Sweden
527

transportation updates and information. A strong
preference for receiving updates through social media
was noted, particularly concerning service changes
and travel disruptions.
The study emphasizes that while social media
plays a crucial role in communicating about public
transport, there is considerable room for improvement
in terms of information accuracy, user engagement,
and real-time updates. Public transport authorities
should enhance their digital strategies by improving
the responsiveness of their social media channels and
ensuring timely, accurate information. Proactive
engagement with users can also enrich the passenger
experience, fostering a more informed ridership and
increasing overall satisfaction.
ACKNOWLEDGEMENTS
This paper is part of a research project titled
"Exploring Citizen Satisfaction with Public
Transportation through Social Media and Open Text
Surveys." The project is conducted by Malmö
University in collaboration with Halmstad University
and has been supported and funded by K2 (The
Swedish Knowledge Centre for Public Transport).
REFERENCES
Abeysekera, I. (2024). Sentiment analysis of a nomadic tax
social enterprise. Journal of Open Innovation:
Technology, Market, and Complexity, 10(1), 100179.
Aman, J. J., & Smith-Colin, J. (2021). Leveraging social
media to understand public perceptions toward
micromobility policies: The dallas scooter ban case.
Findings.
Bregman, S. (2012). Uses of social media in public
transportation (No. 99). Transportation Research Board.
Chowdhury, R. H. (2024). Sentiment analysis and social
media analytics in brand management: Techniques,
trends, and implications. World Journal of Advanced
Research and Reviews, 23(2), 287-296.
Dixit, M., Bali, M. S., Kour, K., Ioannou, I., Ghantasala, G.
P., & Vassiliou, V. (2025). Video sentiment analysis on
social media using an advanced VADER technique.
International Journal of Data Science and Analytics, 1-33.
Georgiadis, G., Nikolaidou, A., Politis, I., & Papaioannou,
P. (2020). How public transport could benefit from
social media? evidence from european agencies. In
Conference on Sustainable Urban Mobility (pp. 645-
653). Cham: Springer International Publishing.
Han, X., Wang, J., Zhang, M., & Wang, X. (2020). Using
social media to mine and analyze public opinion related
to COVID-19 in China. International journal of
environmental research and public health, 17(8), 2788.
Kaplan, A. M., & Haenlein, M. (2010). Users of the world,
unite! The challenges and opportunities of Social
Media. Business Horizons, 53(1), 59-68.
Kwok, L., & Yu, B. (2013). Spreading social media
messages on Facebook: An analysis of restaurant
business-to-consumer communications. Cornell
Hospitality Quarterly, 54(1), 84-94.
Liu, J. H. I., & Ban, X. J. (2017). Measuring the impacts of
social media on advancing public transit (No. NITC-
RR-654). National Institute for Transportation and
Communities.
Mangold, W. G., & Faulds, D. J. (2009). Social media: The
new hybrid element of the promotion mix. Business
Horizons, 52(4), 357-365.
Menaouer, B., Fairouz, S., Meriem, M. B., Mohammed, S.,
& Nada, M. (2025). A sentiment analysis of the
Ukraine-Russia War tweets using knowledge graph
convolutional networks. International Journal of
Information Technology, 1-18.
Munar, A. M., & Jacobsen, J. K. S. (2014). Motivations for
sharing tourism experiences through social media.
Tourism Management, 43, 46-54.
Nikolaidou, A., & Papaioannou, P. (2018). Utilizing social
media in transport planning and public transit quality:
Survey of literature. Journal of Transportation
Engineering, Part A: Systems, 144(4), 04018007.
Rodríguez-Ibánez, M., Casánez-Ventura, A., Castejón-
Mateos, F., & Cuenca-Jiménez, P. M. (2023). A review
on sentiment analysis from social media platforms.
Expert Systems with Applications, 223, 119862.
Salisu, I. A., Ramadhan, I. R., Matdoan, S., Arifin, Z., &
Praseptiawan, M. (2024). Sentiment Analysis of
Comments on Higher Education Social Media Using
Naïve Bayes Algorithm. Journal of Information
Technology application in Education, Economy, Health
and Agriculture, 1(3), 57-62.
Sarkheyli, A., & Sarkheyli, E. (2024). Social Media
Integration in Public Transportation: A Case Study of
Sweden. In 2024 IEEE International Conferences on
Internet of Things (iThings) and IEEE Green
Computing & Communications (GreenCom) and IEEE
Cyber, Physical & Social Computing (CPSCom) and
IEEE Smart Data (SmartData) and IEEE Congress on
Cybermatics (pp. 595-600). IEEE.
Torres, E. C. M., & de Picado-Santos, L. G. (2025).
Sentiment Analysis and Topic Modeling in
Transportation: A Literature Review. Applied Sciences,
15(12), 6576.
Yordanova, L., Kiryakova, G., Veleva, P., Angelova, N., &
Yordanova, A. (2021). Criteria for selection of
statistical data processing software. In IOP Conference
Series: Materials Science and Engineering (Vol. 1031,
No. 1, p. 012067). IOP Publishing.
Yue, L., Chen, W., Li, X., Zuo, W., & Yin, M. (2019). A
survey of sentiment analysis in social media.
Knowledge and information systems, 60(2), 617-663.
Zeng, B., & Gerritsen, R. (2014). What do we know about
social media in tourism? A review. Tourism
Management Perspectives, 10, 27-36.
KMIS 2025 - 17th International Conference on Knowledge Management and Information Systems
528
