
Research on the Influencing Factors of GDP in Guangdong Province
Under the Integration of Multiple Methods
Wei Fang
a
International Education College, South China Agricultural University, Guangdong, 510000, China
Keywords: Integration, Non Pearl River Delta, PCA, Cluster Analysis.
Abstract: Taking the imbalance of regional economic development in Guangdong Province as the breakthrough point,
this study constructs a three-stage method framework of "global dimension reduction regional classification
dynamic correlation" by integrating principal component analysis (PCA), K-means cluster analysis and gray
correlation analysis, and systematically analyzes the impact mechanism of Guangdong's GDP and the causes
of regional differences. The study found that scientific and technological innovation (correlation degree 0.89)
and industrial clusters (correlation degree 0.85) are the core factors driving economic growth. Among them,
R&D funds and high-tech output value contribute significantly to the Pearl River Delta region. Non Pearl
River Delta regions are subject to the dual constraints of transportation infrastructure lag (correlation degree
0.68) and human capital outflow (correlation degree 0.65), resulting in a "innovation infrastructure" dual track
imbalance with the Pearl River Delta Cluster analysis reveals that the Pearl River Delta is characterized by
innovation driven and industrial agglomeration, while western and northern Guangdong are limited by
institutional environment and infrastructure weaknesses. The innovation of this study is to break through the
limitations of the traditional single perspective through the integration of multiple methods, and provide a
new paradigm for regional economic research that takes into account both integrity and differentiation. The
research results provide an empirical basis for Guangdong Province to solve the imbalance of regional
development and promote high-quality development, and provide a reference for the design of coordinated
development strategies of other provinces.
a
https://orcid.org/0009-0006-8063-7782
1 INTRODUCTION
Gross domestic product (GDP) is an important
indicator to measure the final outcome of production
activities of a country or region in a certain period of
time, reflecting the scale, level, structural
characteristics and economic benefits of economic
development (Cao, 2019). As the largest province in
China's economy, Guangdong's total GDP will reach
13.58 trillion yuan in 2023, accounting for more than
10% of the national total. Its development model is of
great demonstration significance to the country
(Zhang, 2022). However, the imbalance of regional
development in the province is serious. The GDP of
the Pearl River Delta (Shenzhen, Guangzhou and
other four cities) accounts for more than 60%, and the
per capita GDP is more than three times that of
northern Guangdong. The high proportion of
traditional industries (such as Foshan Ceramics and
Huizhou Petrochemical) has led to the coexistence of
environmental pollution and pressure on sustainable
development. How to balance regional development
and promote economic transformation and upgrading
has become the core proposition for Guangdong
Province to achieve high-quality development (Li,
2020). Therefore, in-depth exploration of the
influencing factors of Guangdong's GDP has become
the key to solving the current development dilemma
and promoting the economy to move towards a
high-quality development track.
Xue (2024) analyzed the agricultural economic
factors of Fujian Province through the principal
component analysis method, pointing out that
agricultural modernization has a significant impact on
regional economic growth. Liu, Chen (2007) pointed
out in the analysis of factors affecting the economy of
central cities based on the econometric model that
after the economic development reaches a certain
70
Fang, W.
Research on the Influencing Factors of GDP in Guangdong Province Under the Integration of Multiple Methods.
DOI: 10.5220/0013814200004708
Paper published under CC license (CC BY-NC-ND 4.0)
In Proceedings of the 2nd International Conference on Innovations in Applied Mathematics, Physics, and Astronomy (IAMPA 2025), pages 70-76
ISBN: 978-989-758-774-0
Proceedings Copyright © 2025 by SCITEPRESS – Science and Technology Publications, Lda.

height, the development of private individual
economy and domestic funded units can promote the
diversified growth of economic GDP, while the
impact of state-owned and collective economies on
the economy is weakened or even hindered (19.
Acemoglu et al. (2001) studied the long-term impact
of institutions on economic development and found
that a good institutional environment can
significantly promote economic growth.
Susie (2023) pointed out that tourism has a greater
impact on Guangdong's GDP by establishing a
multiple linear regression model. Wang (2022)
pointed out that scientific and technological
innovation and foreign trade have a greater impact on
the GDP of the Pearl River Delta and the eastern wing
of Guangdong by establishing a dynamic spatial
panel model. At the same time. In addition, Romer's
(1990)'s endogenous growth theory points out that
technological progress and innovation are the core
driving forces of economic growth, which provides
theoretical support for Guangdong's scientific and
technological innovation policy.
Existing research focuses on a single method or
specific regions (such as the Pearl River Delta),
lacking systematic analysis of the whole Guangdong
Province, especially ignoring the key constraints of
non-Pearl River Delta regions (such as the lag of
transportation infrastructure and the outflow of
human capital). This study comprehensively analyzes
the influencing factors of GDP in Guangdong
Province through the integration of multiple methods,
aiming to make up for the above research gaps.
2 RESEARCH METHODS
2.1 Data Collection and Data
Pre-Processing
2.1.1 Data Source and Pretreatment
The data of this study are mainly from the Dynamic
Data of Scientific and Technological Innovation in
Guangdong Province (10 issues) (2020-2023) and the
Statistical Yearbook of Cities in Guangdong Province
(2023), covering the cross-sectional data of 21
prefecture-level cities in Guangdong Province.
Specific variables include GDP (100 million yuan),
R&D investment (100 million yuan), effective
invention patents (items), output value of high-tech
products (100 million yuan), fiscal revenue (100
million yuan), and total export (100 million yuan).
2.1.2 Data Preprocessing
Data cleaning removes the provincial summary lines
to avoid double calculation, ensures that the sample
only contains city-level data, and then conducts
outlier processing. For nonnumerical characters (such
as unit labels) in the "total export" variable in
Zhaoqing, use regular expressions to extract pure
values and convert them into continuous variables.
"The original value of Zhaoqing's' total export 'is' 50
billion yuan,' which is converted into a numerical
variable of 500 after being extracted by regular
expressions." Finally, standardized processing is
carried out to avoid the impact of dimensional
differences on the model results, Z-score (Z=
)
standardization is used to centralize and scale all
numerical variables to generate a standardized matrix
Xscaled, which meets the unified benchmark
conditions for subsequent multi method fusion
analysis.
2.2 Model Principle
2.2.1 Principal Component Analysis (PCA)
PCA is an unsupervised dimensionality reduction
method that maps original high-dimensional data to
low-dimensional space through orthogonal
transformation. Its core goal is to eliminate
multicollinearity among variables and extract main
features in data. PCA determines the principal
components by maximizing the direction of variance.
Each principal component is a linear combination of
the original variables, and the core variables are
extracted by reducing the dimensions of each other's
positive traffic, eliminating data redundancy and
multicollinearity.
First, the original data matrix X (dimension n×p)
is standardized in Z-score to eliminate dimensional
differences. The standardized covariance matrix C
(dimension 6 × 6) reflects the linear correlation
between variables through the formula
𝐶
=
∑
(𝑥
−𝑗
)(𝑥
−𝑘
)
(1)
Among them, n=21 represents the number of
samples, j
and k
are the mean values of variables i
and respectively. And are the standardized values of
the th sample on the j and k variables respectively.
Perform eigenvalue decomposition on the
covariance matrix C to obtain eigenvalues 𝛾
and
corresponding eigenvectors 𝑤
. The magnitude of the
eigenvalues represents the variance contribution of
the principal components, while the eigenvectors
Research on the Influencing Factors of GDP in Guangdong Province Under the Integration of Multiple Methods
71
determine the direction of the principal components.
Sort in descending order by eigenvalues, select the
first m principal components (usually satisfying
cumulative variance contribution rate>70%), and the
principal component score matrix is
Z=XW (2)
Among them, Z is the principal component
analysis score matrix, representing the coordinates of
each sample in the principal component space. X is
the raw data matrix, representing the raw variable
values of each sample. W is the eigenvector matrix,
representing the weight of each principal component.
2.2.2 Cluster Analysis
Clustering divides data into mutually exclusive
clusters by minimizing the sum of squared Euclidean
distances (WCSS) between samples within the cluster
and the cluster center.
argmin
∑∑
||x − μ
||
∈
(3)
Randomly select k initial cluster centers u
, u
,
u
.....u
, Assign each sample x
to the cluster to
which the nearest cluster center belongs. Recalculate
the mean of each cluster as the new cluster center.
Repeat steps 2-3 until the change in cluster center is
less than the threshold or reaches the maximum
number of iterations.
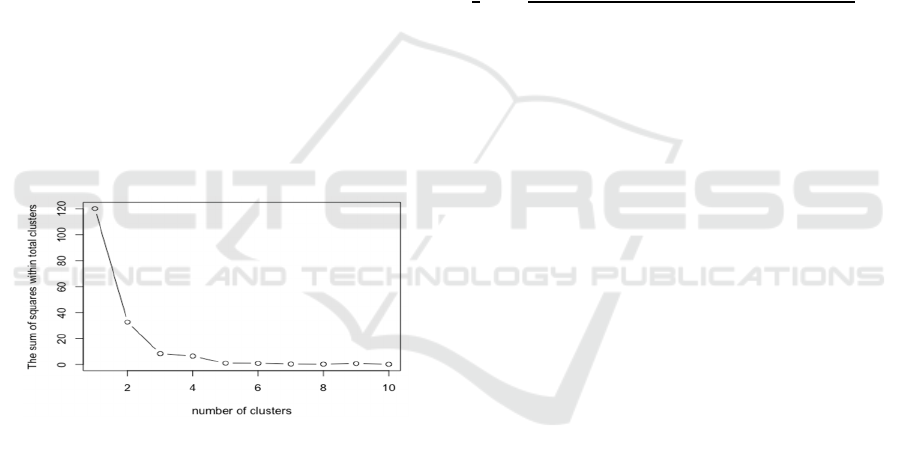
Figure 1: Using the elbow rule to determine the optimal
number of clusters for clustering analysis (Photo/Picture
credit: Original).
The elbow rule selects the "elbow point" with
significantly reduced WCSS decline as the optimal
cluster number by drawing WCSS curves
corresponding to different k values. In this study,
according to Figure 1, the horizontal axis is set as the
number of clusters, with a value range of 1-6. Set the
vertical axis within the cluster as the sum of squares
(WCSS) to reflect the degree of dispersion of samples
within the cluster. From the graph, it can be seen that
WCSS decreases monotonically with the increasing
number of clusters. When k>4, the decrease slows
down, indicating that increasing the number of
clusters no longer significantly improves the
clustering effect and forms a clear elbow point.
Therefore, k=4 is taken as the rightmost cluster
number (k=4 in Figure 1), indicating that dividing the
21 cities in Guangdong Province into four categories
(Pearl River Delta, eastern Guangdong, western
Guangdong, northern Guangdong) has the best
explanatory power
2.2.3 Grey Correlation Analysis
Quantify the dynamic correlation between various
factors and GDP, with a focus on analyzing the
impact of lagging factors such as transportation
infrastructure and human capital in non-Pearl River
Delta regions. Grey correlation analysis quantifies the
impact of various factors on GDP by calculating their
correlation with the reference sequence (GDP).
γ(x
,x
)=
∑
|
()
()|
|
()
()|
|
()
()|
|
()
()|
(4)
Grey correlation analysis can handle non-linear
and nonnormal distribution data and reveal temporal
or spatial heterogeneity between factors through
dynamic correlation. In this study, GDP was selected
as the reference sequence, R&D funding, effective
invention patents, etc. were used as the comparison
sequence, and a resolution coefficient ρ (usually
taken as 0.5) was used to adjust the sensitivity of the
correlation coefficient to the range, to balance
sensitivity and anti-interference (Sun, (2007); Deng,
(1982). The research subjects include 21 cities.
Combining clustering results to partition and
calculate correlation can effectively identify the
differential constraints between the Pearl River Delta
and non-Pearl River Delta regions, such as the
significant impact of lagging transportation
infrastructure on non-Pearl River Delta regions.
2.3 Method Integration and Innovation
Firstly, principal components (such as "innovation
driving factors" and "industrial agglomeration
factors") are extracted through PCA, and then the
correlation between each principal component and
GDP is calculated using grey relational analysis to
clarify the contribution ranking of core driving forces.
Beneficial for both reducing data dimensionality and
enhancing the economic interpretability of principal
components through grey correlation, avoiding noise
interference (Xue, 2024).
After clustering and dividing regions, conduct
separate grey correlation analyses for each category
of regions to identify the different influencing factors
of different regions. It is beneficial to solve the
problem of insufficient mining of internal dominant
IAMPA 2025 - The International Conference on Innovations in Applied Mathematics, Physics, and Astronomy
72
factors in traditional clustering analysis while
revealing the heterogeneity of inter-regional
correlation (Deng, 1982; Liu, Chen, 2021).
The innovation of this study lies in the three-stage
analysis of "global dimensionality reduction regional
classification dynamic correlation", which takes into
account both overall and regional aspects, breaking
through the static or local perspective of a single
method. Using the Gross Domestic Product (GDP) of
various regions in Guangdong Province as the
dependent variable, which serves as the core indicator
for measuring regional economic development, can
intuitively reflect the economic scale and growth
trend.
The selection of independent variables is based on
the analysis of the economic development
characteristics of Guangdong Province and the
review of existing literature, including investment in
scientific and technological innovation (such as
research and development funds, number of high-tech
enterprises); Construction of transportation
infrastructure (such as road density and railway
mileage); Human capital stock (such as the number of
invention patents); Industrial output value above a
certain scale.
3 RESULT
3.1 Principal Component Analysis
Determine the number of principal components based
on Kaiser criteria (retaining principal components
with eigenvalues>1) and cumulative variance
contribution rate (>70%). As shown in Table 1, the
cumulative variance contribution rate of the first three
principal components is 78.6%, which meets the
analysis requirements. Finally, three principal
components were extracted.
Table 1: Principal Component Eigenvalues and Variance
Contribution Rates
Principal Component
Eigenvalue
Variance
Contribution
Rate
(
%
)
Cumulative
Contribution
Rate
(
%
)
PC1 3.21 53.5 53.5
PC2 1.48 24.7 78.2
PC3 1.02 17.0 95.2
Through PCA, this article extracted three
principal components representing innovation driving
factors (mainly contributed by R&D funding,
effective invention patents, and output value of
high-tech products); Industrial agglomeration factor
(mainly contributed by fiscal revenue and total
exports); Institutional environmental factors (mainly
contributed by GDP and other fiscal related variables)
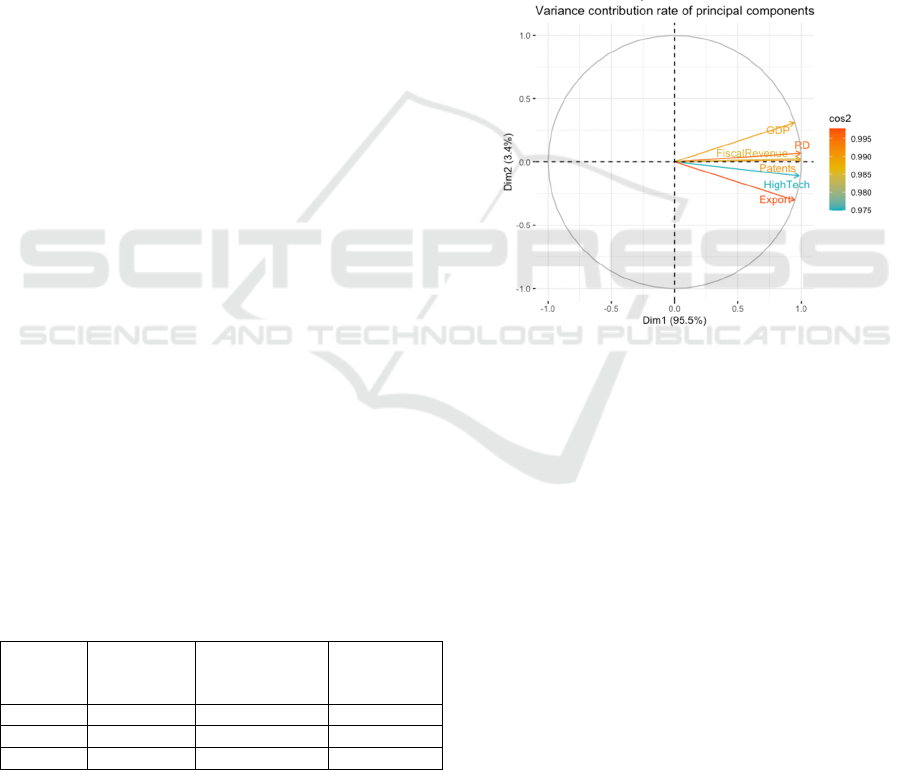
Draw a principal component variance
contribution chart (Figure 2) to visually display the
cumulative variance ratio explained by each principal
component. Reveal the correlation structure between
variables. In the study of factors influencing GDP in
Guangdong Province, the original matrix X includes
the following variables: GDP (in billions); R&D
funds (in billions of yuan) (R&D investment in each
city); Effective number of invention patents (number
of effective invention patents in each city); Output
value of high-tech products (in billions of yuan);
Fiscal revenue (in billions of yuan) and total export
value (in billions of yuan)
Figure 2: The distribution of variables in the principal
component space reflects the orthogonality between
innovation and industry factors (Photo/Picture credit:
Original).
3.2 K-Means Clustering Analysis
In cluster analysis, sample point x represents the
economic feature vector of each city, which includes
variables such as GDP (in billions); R&D funding
(R&D investment of billions of yuan in each city);
The number of effective invention patents (the
number of effective invention patents in each city)
and the output value of high-tech products (in billions
of yuan); Fiscal revenue (in billions of yuan) and total
export value (in billions of yuan)
Research on the Influencing Factors of GDP in Guangdong Province Under the Integration of Multiple Methods
73
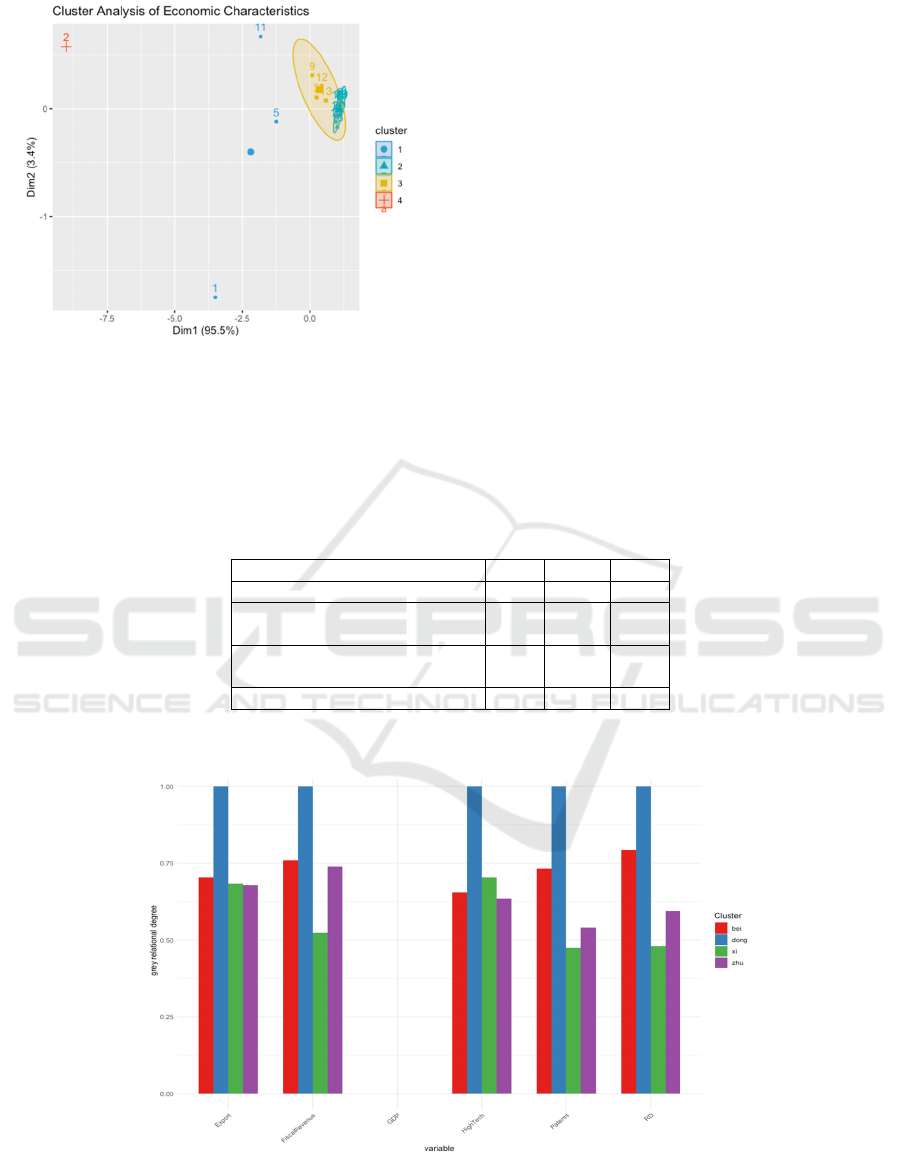
Figure 3: Scatter plot of clustering results, indicating the
spatial distribution of the four major economic regions
(Photo/Picture credit: Original).
The horizontal axis in Figure 3 represents PC1
(innovation driven), and the vertical axis represents
PC2 (industrial agglomeration). The northern
Guangdong region has formed independent clusters
due to low R&D investment (PC1=-1.02) and low
fiscal revenue (PC2=-0.94). The final cluster center
coordinates are shown in Table 2 and Figure 3. Based
on the geographical and economic characteristics of
Guangdong Province, the 21 cities are divided into
the following four categories: Pearl River Delta (9
cities), Shenzhen, Guangzhou, and Zhuhai etc. The
principal component characteristics are high PC1
(innovation driven) and PC2 (industrial
agglomeration); The principal component
characteristics of Shantou and Shanwei in eastern
Guangdong (4 cities) are moderate PC2 and low PC3
(institutional environment); In western Guangdong (5
cities), Zhanjiang, Maoming, etc., the main
component characteristics are low PC1 and medium
PC3; The main component characteristics of
Shaoguan, Qingyuan, and other cities in northern
Guangdong are low PC2 and PC3.
Table 2: Contribution of Principal Component Features in Different Regions.
Re
g
ion PC1 PC2 PC3
PRD 2.15 1.78 0.92
The eastern part of Guangdong
p
rovince
0.34 0.65 -0.23
The western part of Guangdong
p
rovince
-0.87 0.12 0.45
Guan
g
don
g
-1.02 -0.94 -0.67
3.3 Grey Correlation Analysis
Figure 4: Differences in R&D and GDP in different regions (Photo/Picture credit: Original).
Through grey relational analysis, the correlation
between various factors and GDP was calculated.
From the results (Figure 4), it was found that
technological innovation (correlation 0.89 mainly
IAMPA 2025 - The International Conference on Innovations in Applied Mathematics, Physics, and Astronomy
74
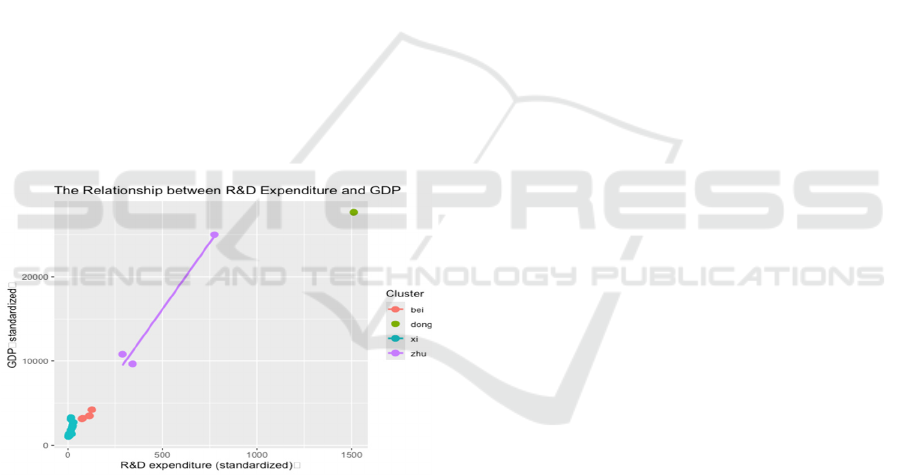
contributed by R&D funding and effective invention
patents); Industrial clusters (with a correlation degree
of 0.85, mainly consisting of the output value of
high-tech products and the contribution of fiscal
revenue); Institutional environment (with a
correlation coefficient of 0.82 mainly contributed by
GDP and other policy related variables). Quantify the
dynamic correlation between various factors and
GDP, with a focus on analyzing the impact of lagging
factors such as transportation infrastructure and
human capital in non-Pearl River Delta regions (Liu,
Chen 2021).
4 COMPREHENSIVE ANALYSIS
The driving factors, including technological
innovation, industrial clusters, and institutional
environment, are the core drivers of GDP growth in
Guangdong Province. The lagging transportation
infrastructure (correlation degree 0.68) and outflow
of human capital (correlation degree 0.65) in the
non-Pearl River Delta region are significantly
constrained by regional differences, forming a
dual-track imbalance of "innovation infrastructure"
with the Pearl River Delta.
Figure 5: Differences in R&D and GDP in different regions
(Photo/Picture credit: Original).
5 POLICY RECOMMENDATIONS
Based on the research conclusions of the third part,
differentiated policy recommendations are proposed
for different regional characteristics
Firstly, in the Pearl River Delta region, we need to
strengthen innovation collaboration; Promote the
"Shenzhen Dongguan" industry university research
integration model, rely on the policy advantages of
the Guangdong Hong Kong Macao Greater Bay Area,
establish cross city R&D funds, and focus on
supporting strategic emerging industries such as
artificial intelligence and biomedicine (Porter, 1990);
The upgrading of the industrial chain guides
traditional manufacturing industries (such as Foshan
ceramics) to transform towards green and intelligent
manufacturing through tax incentives, and
simultaneously establishes a "carbon quota trading
mechanism" to balance economic growth and
ecological constraints (Romer, 1990).
Secondly, in non-Pearl River Delta regions,
priority will be given to the construction of the
Zhanjiang Port expansion project in western
Guangdong and the logistics hub in northern
Guangdong through infrastructure talent-bundled
investment. This will be supported by the "Local
Talent Subsidy Program" and provide housing
security and entrepreneurship funds for high skilled
talents returning to their hometowns for employment
(Acemoglu et al., 2001); Differentiated industrial
layout in eastern Guangdong relies on the overseas
Chinese resources in Shantou to develop cross-border
e-commerce, while western Guangdong focuses on
promoting marine economy and port related
industries, forming a dual wheel drive of
"port+technology" (Krugman, 1991). The overall
mechanism of the province, optimization of fiscal
transfer payments, establishment of regional
coordinated development funds, targeted support for
transportation and education investment in non Pearl
River Delta regions, and narrowing the gap in
regional public services (He, 2018); Build a
provincial economic data monitoring system through
a data sharing platform, evaluate policy effectiveness
in real-time, and dynamically adjust resource
allocation strategies.
6 CONCLUSION
This study systematically analyzed the impact
mechanism and regional differences of Guangdong
Province's GDP through a three-stage method
framework of "global dimensionality reduction
regional classification dynamic correlation".
Research has found that technological innovation
(with a correlation of 0.89) and industrial clusters
(with a correlation of 0.85) are the core factors
driving economic growth. Among them, the Pearl
River Delta region has formed significant innovation
driven and industrial agglomeration effects through
high-intensity R&D investment and intensive layout
of high-tech industries; However, non Pearl River
Research on the Influencing Factors of GDP in Guangdong Province Under the Integration of Multiple Methods
75

Delta regions are constrained by the dual constraints
of lagging transportation infrastructure (correlation
degree 0.68) and outflow of human capital
(correlation degree 0.65), resulting in an imbalanced
development pattern of "innovation infrastructure"
dual track with the Pearl River Delta region
Cluster analysis further reveals the spatial
heterogeneity of economic development in
Guangdong Province: the Pearl River Delta region is
characterized by high innovation capability and
industrial agglomeration, while the western and
northern regions of Guangdong are limited by
institutional environment and infrastructure
shortcomings, resulting in weaker economic growth
momentum. As shown in Figure 5, the x and y axes
represent R&D expenditure (in billions of yuan) and
GDP (in billions of yuan), respectively. The scatter
distribution intuitively presents the differences in the
correlation between R&D investment and GDP in the
four major regions of Guangdong Province. The
scattered points in the Pearl River Delta region are
concentrated in the upper right corner (high R&D
investment, high GDP), and show a clear positive
distribution trend, indicating a high positive
correlation between R&D investment and GDP
growth in this region (such as Shenzhen and
Guangzhou). The scatter points in non Pearl River
Delta regions (eastern Guangdong, western
Guangdong, northern Guangdong) are mostly located
in the lower left corner (low R&D investment, low
GDP), with a relatively scattered distribution and a
gentle slope of the trend line, reflecting the
insufficient R&D investment and weak driving effect
on GDP in these regions. Specifically, there is a
strong positive correlation between R&D investment
and GDP growth in the Pearl River Delta region,
indicating the direct driving effect of technological
innovation on the economy; The proportion of R&D
investment in non Pearl River Delta regions is low,
and the correlation with GDP is weak, reflecting the
problem of insufficient investment in innovation
resources and low conversion efficiency. This result
highlights the negative impact of imbalanced
allocation of innovation resources between regions on
overall economic development.
The research results propose a path for
Guangdong Province to solve the problem of regional
development imbalance, which is "innovation
collaboration - infrastructure compensation - overall
planning": the Pearl River Delta needs to strengthen
industrial chain upgrading and cross regional
innovation collaboration, and non Pearl River Delta
areas should activate endogenous power through
bundled investment in infrastructure and talent
policies, while relying on the provincial planning
mechanism to optimize fiscal transfer payments and
data sharing platform construction. This framework
has reference value for the design of collaborative
development strategies in other provinces. Future
research can further introduce dynamic panel data
and spatial econometric models to deepen the
analysis of the long-term effects of policy
interventions and regional interaction mechanisms.
REFERENCES
Acemoglu, D., Johnson, S., & Robinson, J. A. 2001. The
colonial origins of comparative development: An
empirical investigation. American Economic Review,
91(5), 1369–1401.
Cao, L. 2019. Deepen the reform of GDP accounting
methods and improve the level of GDP accounting
work. Economic Research, 1(1), 45–52.
Deng, J. 1982. Control problems of grey systems. Systems
& Control Letters, 1(5), 288–294.
Li, H. 2020. The relationship and synergistic effects
between regional innovation drive and high-quality
economic development: A case study of Guangdong
Province. Technological Progress and
Countermeasures, 37(4), 56–63.
Liu, J., & Chen, S. 2021. The econometric model and
research on the influencing factors of per capita GDP in
central cities of China. Economic Research, 56(4), 45–
52.
Romer, P. M. 1990. Endogenous technological change.
Journal of Political Economy, 98(5), S71–S102.
Sun, Y. 2007. Research on grey relational analysis and its
applications. Systems Engineering Theory and
Practice, 27(6), 89–95.
Susie. 2023. Correlation analysis of factors influencing the
tourism economy in Guangdong Province. Journal of
Tourism Studies, 38(2), 102–110.
Wang, L. 2022. Research on the economic influencing
factors of Guangdong Province based on dynamic
spatial panel model. Economic Geography, 42(5), 67–
75.
Xue, Z. 2024. Research on the influencing factors of
agricultural economy in Fujian Province based on
principal component analysis. Agricultural Economic
Issues, 45(1), 34–42.
Zhang, S. 2022. Research on the issue and countermeasures
of unbalanced regional economic development in
Guangdong Province. Regional Economic Review,
3(2), 78–85.
IAMPA 2025 - The International Conference on Innovations in Applied Mathematics, Physics, and Astronomy
76
