
Prediction of Diabetes Incidence Based on the Grey Prediction Model
Fangming Xu
a
School of Mathematical Sciences, Nanjing Normal University, Nanjing, Jiangsu, 210023, China
Keywords: Diabetes, Incidence Prediction, Grey Prediction Model, Correlation Analysis, Correlation Analysis.
Abstract: In recent years, the incidence of diabetes mellitus (DM) has been increasing and becoming one of the main
causes of death worldwide. To effectively predict the incidence of DM, this study adopts a grey prediction
model, combined with the incidence data of type 2 DM in the Liangxi District of Wuxi City from 2012 to
2019, to predict and analyze the incidence rate from 2020 to 2026. Through data preprocessing, chi-square
test, and correlation analysis, factors such as age, Body Mass Index, exercise status, hypertension, and
hyperlipidemia were selected as the main influencing factors. The posterior difference ratio of the gray
prediction model is C=0.238, with a small error probability P=1.000, and the prediction accuracy is good.
The model can better capture the changing trend of diabetes incidence, but there are certain deficiencies in
prediction accuracy in years with high incidence. In order to improve the accuracy of the model,
optimization measures such as introducing external variables, multi-model fusion, and cross-validation were
proposed to further improve the prediction effect. The results showed that the incidence of diabetes was
closely related to many factors. It was suggested to strengthen personal health management and monitoring
to reduce the incidence of diabetes and its complications.
a
https://orcid.org/0009-0002-5896-6994
1 INTRODUCTION
Diabetes has been on the rise in recent years.
According to the World Health Organization, there
are about 460 million people with diabetes
worldwide, and this number is expected to continue
to increase in the coming decades. Diabetes has
become one of the leading causes of death. (World
Health Organization, 2021). Diabetes is closely
related to many factors, such as genetics, poor diet,
lack of exercise, and obesity. These factors are
increasingly common in modern society, making
diabetes prevention and treatment more complex and
challenging (Zhang et al., 2017).
Machine learning can process large amounts of
complex clinical data, discover potential association
features, and make effective predictions, especially
for diabetes, a disease prediction task involving
multiple factors. Machine learning methods, such as
support vector machines, random forests, decision
trees, and neural networks, have achieved
remarkable results in the early diagnosis and risk
assessment of diabetes. (Ahmed et al., 2020). Zhang
et al. (2024) used logistic regression to analyze the
independent influencing factors that affect the
prevalence of diabetes. The study concluded that not
exercising, high blood pressure, high blood lipids,
and high body weight will increase the risk of the
disease. Yang et al. (2021) predicted the incidence of
type 2 diabetes by establishing a gray prediction
model. The results showed that the incidence of type
2 diabetes showed an upward trend, and the risk of
males was higher than that of females, and the
incidence of low age group increased rapidly. Liu et
al. (2023) predicted the incidence of type 1 diabetes
in Beijing by Poisson regression and Joinpoint
methods. The results showed that the incidence of
type 1 diabetes increased rapidly in both males and
females and was more significant in females.
Existing diabetes prediction models vary
significantly across specific datasets, with traditional
models (e.g., logistic regression, AUC=0.70-0.85)
relying on interpretability risk factors, while
machine learning methods (e.g., XGBoost, Random
Forest) can boost the Area Under the Curve (AUC)
above 0.90 through feature interaction optimization.
Although some achievements have been made in the
above studies, many of them rely on small-scale or
incomplete data sets, and the data quality and
diversity are poor. At the same time, it is difficult to
Xu, F.
Prediction of Diabetes Incidence Based on the Grey Prediction Model.
DOI: 10.5220/0013813900004708
Paper published under CC license (CC BY-NC-ND 4.0)
In Proceedings of the 2nd International Conference on Innovations in Applied Mathematics, Physics, and Astronomy (IAMPA 2025), pages 53-58
ISBN: 978-989-758-774-0
Proceedings Copyright © 2025 by SCITEPRESS – Science and Technology Publications, Lda.
53

transfer models across hospitals or regions, and it is
difficult to achieve widespread application.
Therefore, how to improve the generalization ability
and accuracy of models is still an urgent problem to
be solved. In addition, there are many factors
involved in diabetes prediction, but how to
effectively select the most relevant factors in
high-dimensional data remains a difficult problem
(Chaurasia et al., 2017).
Early prediction and diagnosis of diabetes is of
great significance to reduce the disease burden and
social and economic costs of patients. Based on the
grey prediction model, this study constructs an
accurate and efficient prediction model of diabetes
incidence through system design and optimization
algorithm. The model and optimization method
established in this study aim to provide a theoretical
basis for early screening and prevention of diabetes,
improve prevention and control efficiency, and
reduce incidence.
2 DATASET SOURCE
The case data were collected from the Wuxi City
Chronic Disease Network Management Information
System. The system is based on advanced
information technology architecture and integrates
big data analysis, cloud computing, and other
cutting-edge technologies. It can efficiently process
massive data of chronic disease patients and
accurately monitor disease dynamics. Therefore, the
data sources are authentic and reliable. Table 1
shows the incidence and incidence rate (/100,000) of
type 2 diabetes in men and women in the Liangxi
District of Wuxi City from 2012 to 2019, as well as
the total number of cases. According to the data,
there were 9747 cases of type 2 diabetes mellitus in
Wuxi City from 2012 to 2019, including 5551 males
and 4196 females, with a sex ratio of nearly 3:2.
Table 1: 2012-2019 Number of Type 2 Diabetes Cases in Liangxi District, Wuxi City
Number of cases 2012 2013 2014 2015 2016 2017 2018 2019
Gender
Male 444 542 610 663 760 778 806 948
Morbidity
(/100,000)
81.45 96.37 106.95 110.93 130.39 132.90 140.26 161.97
Femele 352 447 480 528 545 597 572 675
Morbidity
(/100,000)
63.92 77.52 81.53 87.56 89.31 96.91 91.82 103.67
Total cases 796 989 1090 1191 1305 1375 1378 1623
3 GREY PREDICTION MODEL
AND ALGORITHM
3.1 An Overview of the Grey
Forecasting Model
The grey prediction model adopted in this study, GM
(GrayModel), is a model used for time series
analysis and prediction. It is especially suitable for
situations where the data sample is not large enough
or the information is incomplete (Wei, 2016). The
grey system theory aims to analyze uncertain,
incomplete, and missing data and predict them by
establishing models. GM (1,1) model is a basic
model in grey system theory, which is widely used
in data prediction in various fields, especially in the
fields of economy, medicine, and environment. GM
(1,1) model is suitable for trend analysis and
prediction of short time series data and can reveal
the variation law of the system through a small
amount of original data. The basic steps include
original data processing, accumulation generation,
adjacent mean calculation, establishment of
differential equations, model solution, and
prediction.
3.2 The Establishment of the Model
To establish a raw data sequence x
on the
incidence of type 2 diabetes from 2012 to 2019, the
original data sequence x
is generated by
first-order accumulation to obtain a new sequence.
The resulting new data sequence is smoother than
the original data sequence. Finding the neighbor
mean of the accumulated data series improves data
stability. Establish the first order linear differential
equation based on accumulation sequence x
k
:
+ax
k
=u. (1)
Where a is a development factor that represents
the trend of data growth or decay; u is a grey action
quantity, reflecting the effect of external factors on
the system. By solving the first-order linear
differential equation, the prediction formula of the
cumulative series is obtained. Finally, by restoring
IAMPA 2025 - The International Conference on Innovations in Applied Mathematics, Physics, and Astronomy
54
the cumulative series, the predicted value of the
original series is obtained, namely:
x
k+1
=x
k+1
−x
k
=x
1
−
1−e
e
. (2)
4 RESULTS ANALYSIS AND
MODEL OPTIMIZATION
4.1 Experimental Results and Analysis
In this study, the grey prediction model was applied
to the actual data in the dataset to obtain the
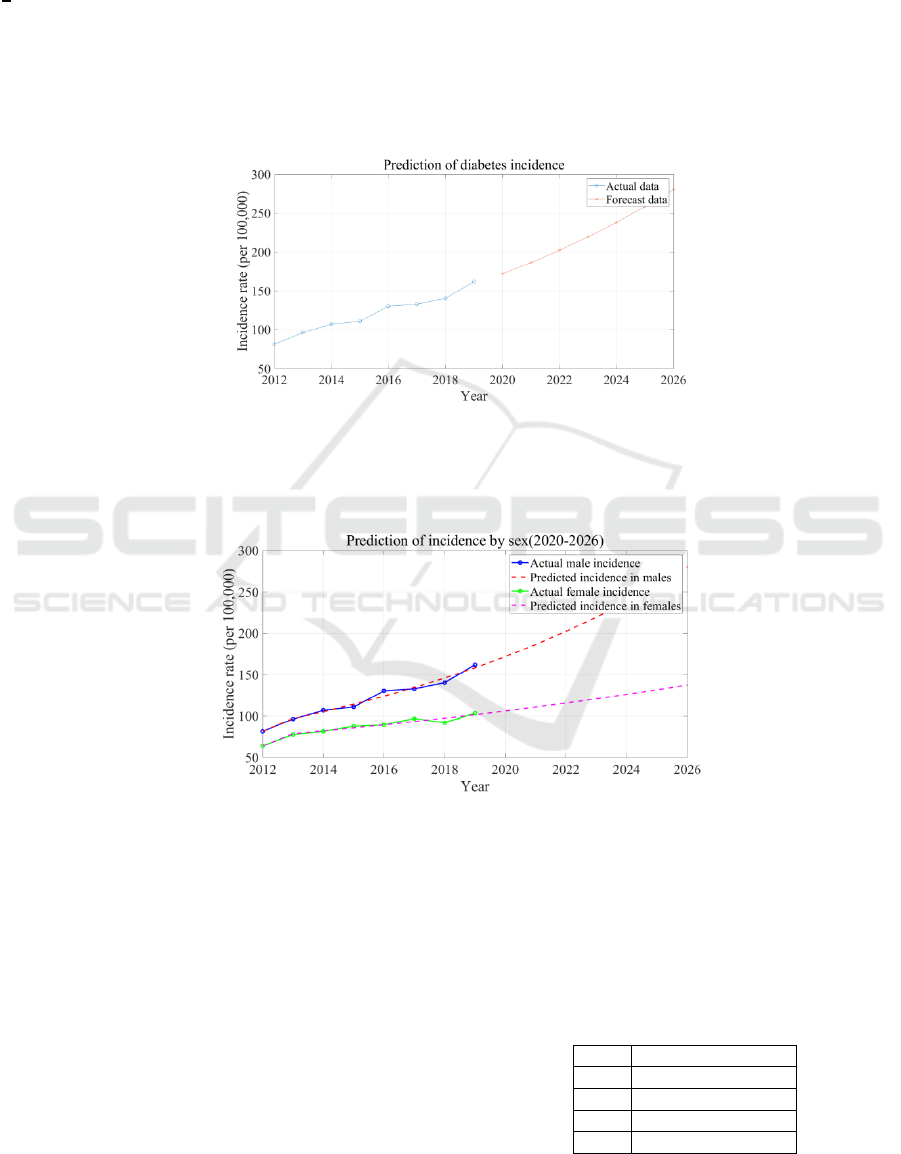
predicted incidence data. Figure 1 shows the broken
line graph of diabetes incidence with years. The
incidence rate of ordinate in 2012-2019 is the actual
value, and the incidence rate of ordinate in
2020-2026 is the predicted value. It can be seen that
after 2015, the incidence rate presents a more
obvious growth trend.
Figure 1: Prediction of diabetes incidence (Photo/Picture credit: Original).
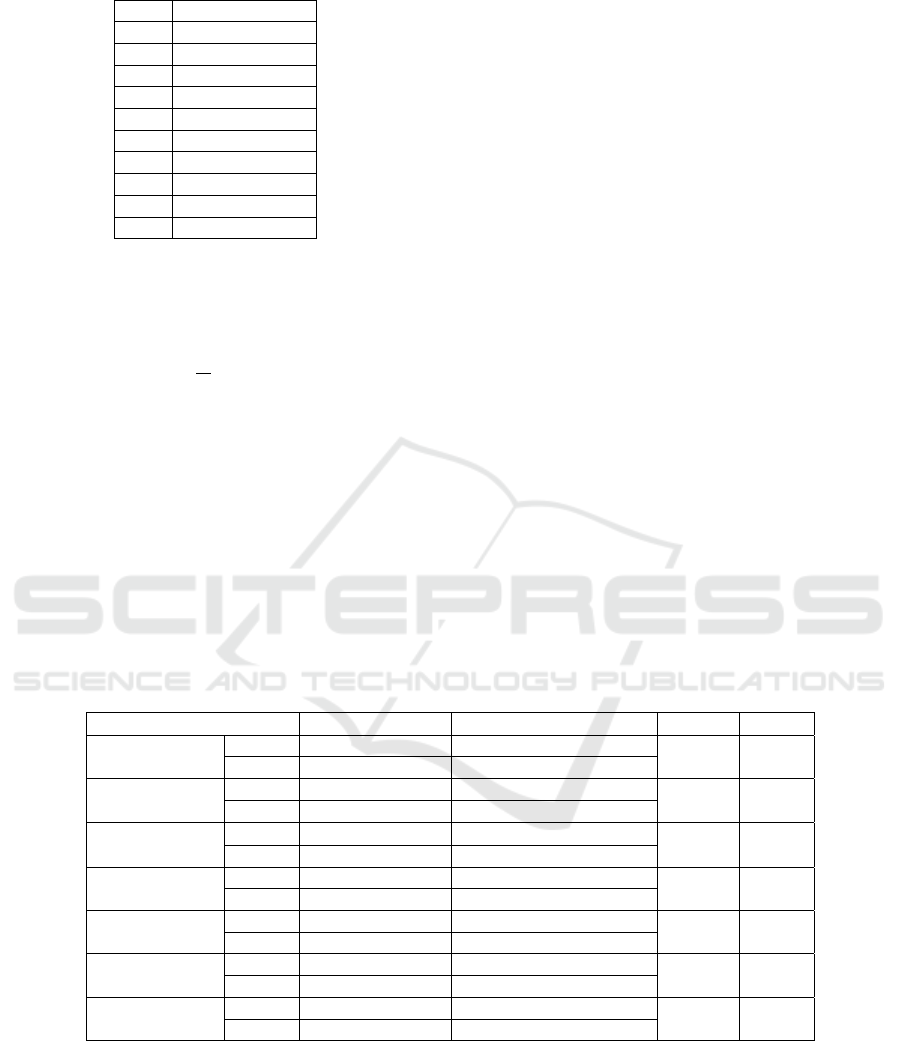
Figure 2 is a line graph showing the incidence of
diabetes by gender over time, with 2020-2026 as the
predicted data. Figure 2 shows that the incidence of
diabetes increases at different speeds in different
genders, and the incidence of type 2 diabetes
increases more significantly in men than in women.
Figure 2: Prediction of incidence by sex (2020-2026) (Photo/Picture credit: Original).
Table 2 shows the specific predicted values of
the incidence rate from 2020 to 2026. Compared
with the specific predicted data from 2020 to 2024 in
Table 2 and the actual recorded data, the error
between the two is small, indicating that the grey
prediction model can better capture the trend of the
incidence rate of type 2 diabetes. Comparing the
actual data with the predicted data, it can be found
that the model can accurately predict the change of
diabetes incidence to a large extent, especially in the
years with low incidence, such as 2012 and 2013, the
prediction error is relatively small, while in the years
with high incidence, such as 2017 and 2018, the
prediction error of the model increases. This
indicates that the grey prediction model has a good
prediction effect on the trend of diabetes incidence in
the short term, but the prediction ability of the model
is slightly insufficient for sudden fluctuations or
changes.
Table 2: 2020-2026 Predicted annual incidence
Yea
r
Morbidit
y(
/100000
)
2012 81.45
2013 92.35
2014 104.02
2015 118.67
Prediction of Diabetes Incidence Based on the Grey Prediction Model
55
Continue Table 2.
2016 132.56
2017 145.39
2018 158.04
2019 171.47
2020 171.77
2021 186.38
2022 202.24
2023 219.44
2024 238.10
2025 253.35
2026 266.37
4.2 Model Accuracy Test
Model accuracy was tested using posterior error ratio
C and small error probability P (Liu et al, 2017).
C=
(3)
Where S
is the standard deviation of the
residual sequence,S
is the standard deviation of the
original sequence.
P=P
|
ε
t
− ε
|
< 0.6745S
(4)
Where ε
t
is residual, ε
is the residual
mean.
By calculating the absolute error and relative
error between the actual value and the predicted
value of the incidence rate from 2012 to 2019, the
prediction accuracy of each year is greater than
95.00%, and the average relative accuracy is 97.40%.
After the fitting accuracy test, the C value is 0.238,
the P value is 1.000, the prediction accuracy grade is
1, and the model is excellent.
4.3 Model Optimization and
Improvement
4.3.1 Factor Selection
To explore the influencing factors of DM, this paper
selects the data of permanent residents in four central
Urban area communities under the jurisdiction of
Beijing Shijitan Hospital affiliated with Capital
Medical University, from January 2021 to March
2022 (Liu et al., 2023). This community covers
different socio-economic strata, age strata (20-79
years old), and metabolic characteristics in the urban
core area, which can effectively balance the
influence of urban-rural differences and occupational
uniformity on the results. Moreover, the whole
process of data collection is quality controlled, and
the data are true and reliable. The specific
information is shown in Table 3. The number of
people in different types of population and the
number of diabetes cases were counted according to
seven items: gender, age, Body Mass Index,
exercise, hypertension, hyperlipidemia and alcohol
consumption, χ2 value and P value.
Table 3: Statistical Survey on Basic Information of Resident Residents
Varia bl es Number of people Number of diabetes cases
χ
value
P value
Gender
Male 232 22
1.22
>0.05
Female 292 20
Age
≤40
401 23
12.04
<0.05
>40
123 19
BMI(kg/m
)
<25
287 15
6.69
<0.05
≥25
237 27
Exercise
Yes 441 24
25.00
<0.05
No 83 18
Hypertension
Yes 104 27
56.68
<0.05
No 420 15
Hyperlipidemia
Yes 136 22
16.49
<0.05
No 388 20
Drink
Yes 78 9
1.54
>0.05
No 446 33
When the P value is less than 0.05, the difference
has statistical significance. As shown in Table 2,
age, Body Mass Index (BMI), exercise, blood lipid,
and blood pressure have smaller P values and
stronger correlation intensity, belonging to the
factors with greater influence; while gender and
whether drinking have larger P values and weaker
correlation intensity, belonging to the factors with
smaller influence. Therefore, it can be judged that
age, BMI, exercise, blood lipids, and blood pressure
are independent risk factors affecting diabetes. It can
be seen from Table 2 that individuals with high age,
high BMI, no exercise habit, hypertension, and
hyperlipidemia have a greater proportion of diabetes.
The estimated incidence rate of diabetes in this
community is 8%, which is less than the overall
IAMPA 2025 - The International Conference on Innovations in Applied Mathematics, Physics, and Astronomy
56

prevalence rate of diabetes in China at the same
time. It is speculated that most residents in this
community have exercise habits. Therefore, the
influencing factors finally selected for this study are
age, BMI, exercise, blood lipids, and blood pressure.
4.3.2 Recommendations for Improvement
Further analysis shows that the prediction accuracy
of the grey prediction model for diabetes incidence is
mainly affected by the following factors: one is the
quality and completeness of the data. Because the
model depends on historical data, the accuracy and
completeness of the data are very important to the
prediction result. If the data are missing or
inaccurate, the prediction result may be biased. The
other is the assumptions of the model. The grey
prediction model assumes that the trend of the data is
stable, but in some years, unexpected events or other
external factors may cause large fluctuations in the
incidence rate, affecting the accuracy of the model.
Therefore, to cope with the violent fluctuations
and abrupt changes that may occur in the prediction
process, it is necessary to further improve the model
(Xie et al., 2009). Based on the grey prediction
model, age, BMI, exercise condition, blood pressure,
and blood lipid factors closely related to diabetes
incidence are introduced to carry out joint modeling
and establish a multivariate grey prediction model.
The second is model fusion and ensemble learning.
Combined with random forest, support vector
machine, and other machine learning models,
prediction is carried out by the ensemble learning
method (Zhang et al., 2020). Thus, the possible
overfitting problem of a single model can be
reduced, and the accuracy and robustness of
prediction can be improved. Third, cross-validation
and model optimization can be carried out. Dividing
the data set into multiple training sets and validation
sets and conducting multiple model training and
testing can effectively avoid the overfitting
phenomenon and selecting the optimal model
parameters to improve the prediction accuracy of the
grey prediction model.
Through the above optimization measures, the
accuracy and stability of the grey prediction model
in predicting the incidence of diabetes can be
effectively improved.
5 CONCLUSION
The results show that the grey prediction model can
capture the trend of diabetes incidence well, but it
has some shortcomings in prediction accuracy in
high-incidence years. This paper proposes some
optimization measures such as introducing external
variables, model fusion, and cross validation to
improve the prediction accuracy and stability of the
model. Further analysis shows that high age, high
Body Mass Index, lack of exercise, hypertension and
hyperlipidemia are the main risk factors for diabetes
incidence. There are differences in prevalence
between men and women. Overall, the incidence of
type 2 diabetes increases faster in men, and the
incidence of type 1 diabetes increases significantly
in women. This gender difference indicates that
gender-specific interventions are needed in diabetes
prevention and control. The results show that a
healthy lifestyle plays a key role in diabetes
prevention. Through regular physical examination,
healthy diet, regular exercise, and avoidance of
smoking, the risk of diabetes can be effectively
reduced, especially for high-risk groups with
hypertension and hyperlipidemia.
Based on the above findings, it is recommended
that individuals reduce the probability of developing
diabetes through regular physical examination and
exercise, especially those with hypertension and
hyperlipidemia, and strengthen prevention.
Communities should strengthen personal health
education and raise awareness of healthy lifestyles
and eating habits. In addition, governments can
strengthen cooperation with medical institutions to
carry out early screening and intervention for
high-risk groups to reduce the prevalence of diabetes
and related complications.
REFERENCES
Ahmed, M. A., El-Medany, W. M. & Fathy, S. M. 2020.
Machine learning algorithms for predicting diabetes
risk: A review. International Journal of Computer
Applications, 175(5), 18-26.
Chaurasia, V. & Pal, S. 2017. Diabetes disease prediction
using data mining techniques. 2nd International
Conference on Communication and Electronics
Systems (ICCES), 283-287.
Liu, C., Guo, M., Yuan, Y., Zheng, J. & Yang, J. 2023.
Gender difference and prediction of type 1 diabetes
incidence in Beijing from 2013 to 2018. Journal of
Capital Medical University, 44(03), 370-374.
Liu, S. & Forrest, J. Y. L. 2007. Advances in grey systems
research. Springer.
Wei, F. 2016. Research on grey prediction model in blood
sugar prediction. Master's Thesis, Zhengzhou
University.
Prediction of Diabetes Incidence Based on the Grey Prediction Model
57

Xie, N. & Liu, S. 2009. Discrete multivariate grey model
based on convolution integral. Applied Mathematical
Modelling, 33(7), 3031–3040.
Yang, F., Zhang, C., Chen, X. & Shen, X. 2021. Trend and
prediction of annual incidence of type 2 diabetes in
Liangxi District Wuxi City. South China Preventive
Medicine, 47(03), 363-366.
Zhang, J., Cai, G., Wang, X., Zhang, H., Yin, B. & Tu, D.
2024. Study on diabetes incidence and its influencing
factors in central Beijing urban area community. China
Medical Herald, 21(18), 34-37.
Zhang, P. & Gregg, E. 2017. Global economic burden of
diabetes and its implications. The Lancet Diabetes &
Endocrinology, 5(6), 404-405.
Zhang, Y., Li, X. & Wang, J. 2020. A hybrid grey-random
forest model for short-term traffic flow forecasting.
IEEE Transactions on Intelligent Transportation
Systems, 21(8), 3259–3271.
IAMPA 2025 - The International Conference on Innovations in Applied Mathematics, Physics, and Astronomy
58
