
Prediction of Urban Population Growth in Zhengzhou City Based on
Time Series Analysis
Yushi Gan
a
Faculty of Science and Technology, Beijing Normal-Hong Kong Baptist University, Zhuhai, Guangdong, China
Keywords: Urban Development, Population Growth, ARIMA Model, Time Series Analysis.
Abstract: Population dynamics represent one of the most critical issues in human society. Population growth
significantly influences economic and social development, impacting employment, innovation, and urban
competitiveness. Consequently, analyzing population trends and forecasting future changes can provide
valuable insights into developmental needs and offer a scientific foundation for economic planning, social
progress, and urban design. This study conducts an in-depth analysis of Zhengzhou City's population data
from 1982 to 2022 using the Autoregressive Integrated Moving Average (ARIMA) model based on annual
statistics released by the Zhengzhou Municipal Bureau of Statistics. It further predicts the population growth
trajectory for the next decade. The Ljung-Box test results indicate that the residuals of the ARIMA (1,2,1)
model exhibit no significant autocorrelation and approximate white noise, demonstrating the model's robust
predictive capability. Projections suggest that Zhengzhou's population will maintain steady growth in the
coming years, with the permanent resident population surpassing 15 million by 2032. However, the long-term
population growth in Zhengzhou faces numerous challenges and uncertainties due to factors such as limited
resource capacity, economic fluctuations, industrial restructuring, regional competition, and policy
adjustments.
a
https://orcid.org/0009-0007-8998-3515
1 INTRODUCTION
Population has consistently been a fundamental,
global, long-term, and strategic factor in national
development. Factors such as population size,
structure, distribution, and quality are critical national
conditions influencing the economic and social
development of a country (Xi, 2020). Accurately
forecasting population growth trends is essential for
formulating scientific population policies, optimizing
resource allocation, and enhancing competitiveness.
Zhengzhou, designated as the core city of the Central
Plains Economic Zone by the State Council, plays a
pivotal role in driving regional development and
exerting significant radiation effects on surrounding
cities. In recent years, the central and western regions
have experienced a notable phenomenon of
population return, injecting new vitality into
Zhengzhou's development and profoundly impacting
its population growth (Zou, 2024). As of the end of
2023, Zhengzhou's permanent population reached
13.008 million (Zhengzhou Bureau of Statistics,
2024). Therefore, predicting population growth in
Zhengzhou holds great significance for studying the
development of Zhengzhou and even the broader
central and western regions.
In the context of accelerating global urbanization,
urban population growth serves as a key indicator
reflecting the vitality and potential of urban
development, attracting considerable attention from
both academic and urban planning fields.
Geographically weighted regression models and
spatial correlation were used by Jia & Guo (2025) to
examine the spatial heterogeneity of influencing
factors in Henan Province's county-level cities in
2010 and 2020. Their study revealed that the floating
population exhibited significant areal bias and
accelerated concentration toward central cities.
Zhang and colleagues (2024) employed logistic
mathematical models to determine the permanent
population growth rate in Henan Province's several
counties (districts). They looked at the features of the
permanent population growth rate's regional
distribution in Henan Province using hotspot and
Gan, Y.
Prediction of Urban Population Growth in Zhengzhou City Based on Time Series Analysis.
DOI: 10.5220/0013813800004708
Paper published under CC license (CC BY-NC-ND 4.0)
In Proceedings of the 2nd International Conference on Innovations in Applied Mathematics, Physics, and Astronomy (IAMPA 2025), pages 47-52
ISBN: 978-989-758-774-0
Proceedings Copyright © 2025 by SCITEPRESS – Science and Technology Publications, Lda.
47
spatial semivariance function analysis. According to
the findings, the north and center of Henan Province
had greater regional permanent population growth
rates than the south and surrounding areas. There is a
significant correlation between the degree of
economic growth and the siphon impact that urban
built-up regions, especially newly developed zones,
have on the local people. Feng (2024) proposed
constructing an evaluation index system for
Zhengzhou's competitiveness as a national central
city, emphasizing technological innovation,
industrial transformation, opening up to external
influences, and management services. A relevant
official from the Henan Provincial Bureau of
Statistics noted that Zhengzhou's population size
changes exhibited two primary characteristics: strong
absorption capacity and high agglomeration levels
(Zhengzhou Daily, 2021).
Previous studies by scholars have predominantly
focused on existing data to explore the
spatiotemporal characteristics of Zhengzhou's
population. However, few predictive planning
suggestions have been proposed to enhance
Zhengzhou's economic development and urban
influence. This study aims to employ time series
analysis methods to conduct in-depth research on
Zhengzhou City's population growth over the years,
make more precise predictions regarding future
population growth trends, provide a scientific basis
for urban development, and support Zhengzhou's
sustainable and healthy development.
2 RESEARCH METHODS
2.1 Data Source and Explanation
The data utilized in this study were sourced from the
official website of the Zhengzhou Municipal Bureau
of Statistics, specifically the dataset titled "Annual
Population" (Zhengzhou Municipal Bureau of
Statistics, 2023). This dataset has been adjusted
according to the results of China's seventh national
population census, ensuring its high reliability,
accuracy, broad survey scope, extensive sample size,
and authoritative nature, all of which align with
international standards.
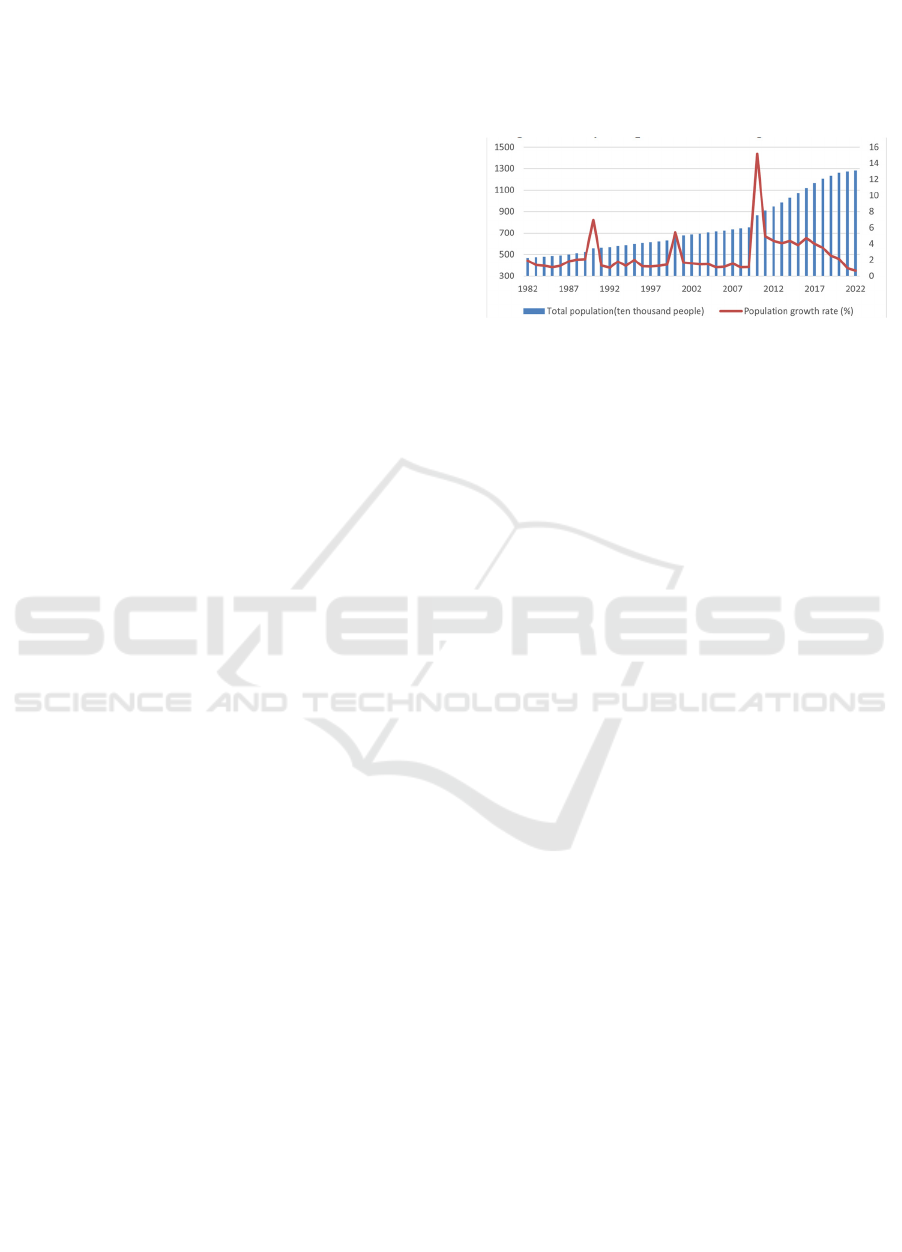
This research collected population data for
Zhengzhou City spanning from 1982 to 2022,
resulting in a total of 41 observed data points. The
annual population growth rate was subsequently
calculated, yielding an additional 41 derived data
points. By employing time (year) as the horizontal
axis and total population (in units of 10,000 people)
and population growth rate (%) as the left and right
vertical axes, respectively, the aforementioned data
were visualized as time series graphs depicting the
historical population numbers and growth rates of
Zhengzhou City, as presented in Figure 1.
Figure 1: Historical Population and Population Growth
Rate of Zhengzhou (Photo/Picture credit: Original).
As illustrated in Figure 1, the population of
Zhengzhou City has exhibited a steady increase over
time, demonstrating a gradually stabilizing trend.
Notably, the population growth rate fluctuates
significantly across different years, with certain
periods experiencing notably higher growth rates
compared to others. Furthermore, the growth rate has
shown a downward trend in recent years.
2.2 Introduction to Research Methods
The Autoregressive Integrated Moving Average
model (ARIMA) is a classical time series forecasting
model renowned for its ability to manage time series
data that is not stationary. It offers flexible parameter
adjustments, a robust statistical theoretical
foundation, high computational efficiency, and
excellent interpretability. The ARIMA model is
particularly suited for stationary or nearly stationary
time series data and comprises three key components:
autoregression (AR), differencing (I), and moving
average (MA). Autoregression captures the linear
relationship between current observations and past
observations, differencing involves transforming the
original time series into a stationary one through
differentiation, and the linear connection between
present and historical observation error is shown in
the moving average. The standard notation for the
ARIMA model is ARIMA(p, d, q), where p stands for
the autoregressive order (the quantity of lag items in
AR), d denotes the differencing order (the number of
differencing operations), and q signifies the moving
average order (the number of lagged items in MA).
The modeling process of the ARIMA model includes
selecting appropriate values for p, d, and q, fitting the
model, and conducting residual analysis.
IAMPA 2025 - The International Conference on Innovations in Applied Mathematics, Physics, and Astronomy
48
3 STATISTICAL ANALYSIS
3.1 Stability Test
The ARIMA model requires that the time series be
stationary, meaning that its statistical characteristics,
such as mean, variance, and autocorrelation, remain
constant over time. This requirement ensures the
reliability of parameter estimation and the accuracy
of model predictions while avoiding spurious
regression and enhancing prediction precision. The
ADF test determines whether a sequence is stationary
by checking for the presence of unit roots within the
sequence.
In this study, the null hypothesis of the ADF test
posits that the time series contains a unit root and is,
therefore, non-stationary. The Dickey-Fuller statistic
obtained from the test results was -1.4026, having a
matching p-value of 0.8085. The null hypothesis
cannot be rejected since the p-value is greater than the
often-used significance level of 0.05, suggesting that
the population sequence being studied may not be
non-stationary, indicating that the population
sequence under investigation may be non-stationary.
Consequently, directly applying ARIMA modeling
would result in inaccurate predictions. To ensure the
reliability of the results, it is necessary to perform
differential processing on the original population
series, thereby removing the linear growth trend over
time, eliminating periodic fluctuations, and
transforming the series into a stationary one.
3.2 Differential Processing
The principle of differencing involves utilizing the
difference between consecutive time points (t and t-1)
in the time series to render a non-stationary sequence
stationary. In this study, first-order and second-order
differencing were applied to the original population
series of Zhengzhou, followed by stationarity testing
of the results. After first-order differencing, the
p-value stayed at 0.5381, which is much higher than
the generally accepted significance level of 0.05,
indicating that the sequence is still non-stationary and
necessitates second-order differencing. Following
second-order differencing, the p-value decreased to
0.0304, which is below 0.05, confirming that the
original sequence has been successfully transformed
into a stationary sequence through second-order
differencing. The corresponding stationarity test
results for the differencing orders are summarized in
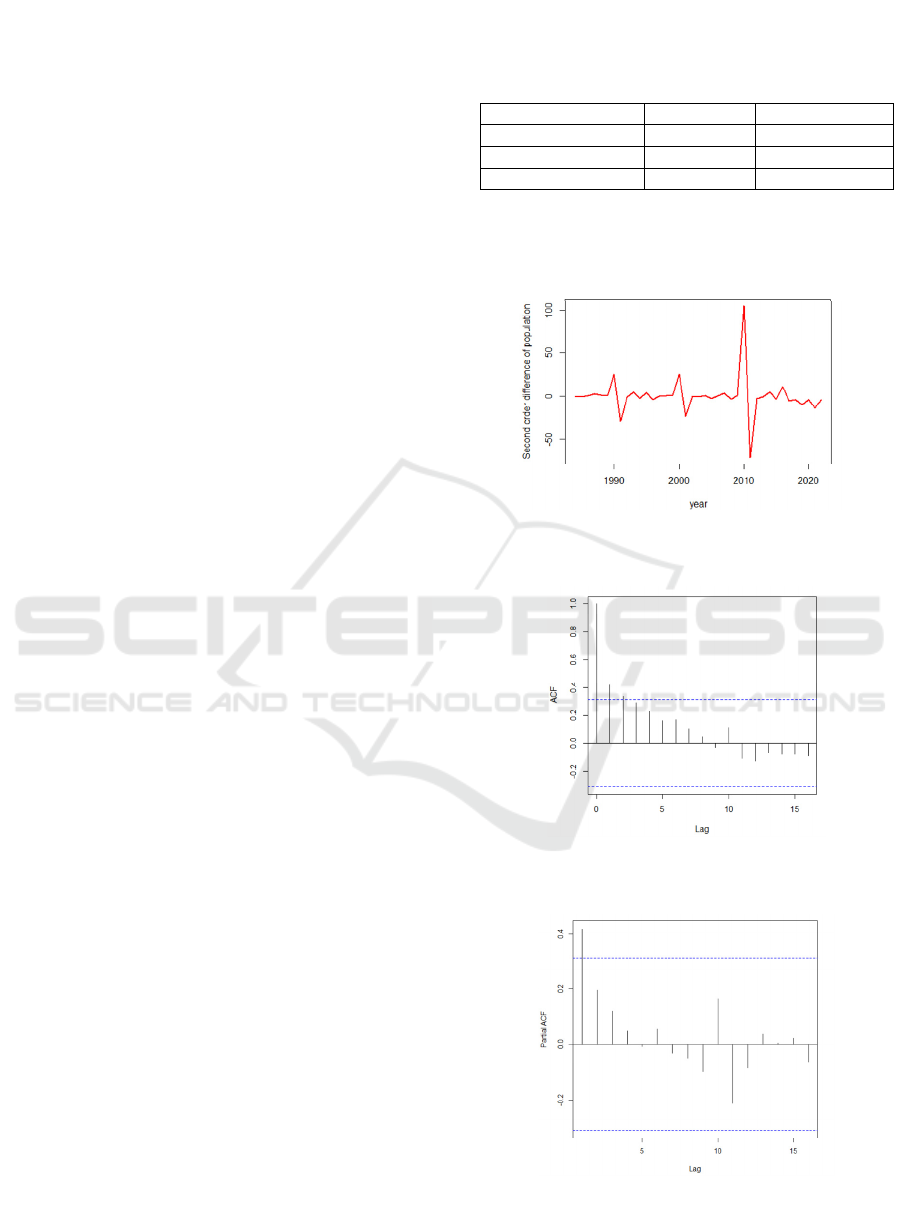
Table 1. The time series chart of Zhengzhou's
population after second-order differencing is
depicted in Figure 2.
Table 1: Results of Stability Test.
Difference orde
r
t-value
p
-value
0 -1.4026 0.8085
1 -2.0901 0.5381
2 -3.8016 0.0304
3.3 Model Establishment and
Parameter Estimation
Figure 2: Time Series Diagram After Second-Order
Differencing (Photo/Picture credit: Original).
Figure 3: Autocorrelation Function Diagram (Photo/Picture
credit: Original).
Figure 4: Partial Autocorrelation Function Diagram
(Photo/Picture credit: Original).
Prediction of Urban Population Growth in Zhengzhou City Based on Time Series Analysis
49

In this study, three primary parameters were
established based on the ARIMA model: the order of
autoregressive (AR) terms is denoted by parameter p,
the number of differences (I) by parameter d, and the
order of moving average (MA) terms by parameter q.
The degree of differencing d has been processed for
the original sequence in the previous text, resulting in
a value of 2. Subsequently, autocorrelation function
(ACF) and partial autocorrelation function (PACF)
are used to fit p and q. The ACF is typically
determined by observing the rate at which the
autocorrelation coefficient decreases as the lag period
increases, while the PACF is determined by assessing
the correlation between the sequence and the current
value after removing the influence of previous lag
periods.
The autocorrelation and partial autocorrelation
graphs are presented in Figures 3 and 4.
From Figure 3, it is evident that after two
differencing processes, the first lag period
significantly exceeds the significance threshold (blue
dashed line), followed by a gradual decrease in
subsequent lag periods. This suggests that the MA
component of the model may exhibit significant
autocorrelation with shorter lag periods. Generally
speaking, autocorrelation graphs quickly approach
zero after a lag period, usually indicating a low
q-value. In Figure 3, ACF demonstrates significant
autocorrelation at a lag period of 1, which
subsequently diminishes. Therefore, this study
determines the q value to be 1.
From Figure 4, the first lag period (Lag 1) exceeds
the significance threshold (blue dashed line) by a
significant margin. However, starting from the
second lag period, the PACF values quickly approach
zero, with no significant partial autocorrelation
observed. Given that only Lag 1 is significant and
subsequent lags contribute minimally to the model,
this study assumes a p-value of 1.
3.4 Model Fitting and Verification
Through the analysis of autocorrelation and partial
autocorrelation graphs, this study determined the
appropriate parameters for the ARIMA model. The
parameters of the model were determined to be based
on the characteristics of the secondary differential
processing and ACF and PACF graphs as p=1, d=2,
and q=1. Therefore, the final model is ARIMA (1, 2,
1).
This study fitted the ARIMA(1, 2, 1) model to the
data after second-order differencing. The estimated
results indicate that the AR(1) coefficient is 0.1248,
which is less than its standard error of 0.3078, and the
MA(1) coefficient is -0.7470, which exceeds its
standard error of 0.2613. This implies that the
autoregressive component of the model has a weaker
impact, whereas the moving average component
exhibits a more substantial influence.
To achieve more accurate and reliable model
fitting, residual testing is essential. In this study, the
Ljung-Box test was employed. According to the
Ljung-Box test, the X-squared value is 11.451, the
degrees of freedom is 20, and the p-value is 0.9337,
which exceeds 0.05. This indicates that the residuals
approximate white noise and there is no significant
autocorrelation in the residual sequence. Thus, it can
be concluded that the model does not omit critical
information. Furthermore, the autocorrelation plot of
the residuals shows that the first-lag autocorrelation
coefficient of the residuals is -0.0281, which is very
close to zero. This confirms that the residuals of the
model approximate white noise.
3.5 Predicting the Population for the
next Decade
Based on the established ARIMA(1, 2, 1) model, the
population of Zhengzhou City over the next ten years
was predicted, with the results presented in Table 2
9 )
.
According
to
the
point
prediction
population
values
Table 2: Population Growth Forecast of Zhengzhou City from 2023 to 2032 (Unit: ten thousand people)
Yea
r
Point forecast
p
o
p
ulation 80% confidence interval 95% confidence interval
2023 1304.748 1280.482 - 1329.015 1267.636 - 1341.861
2024 1328.363 1287.050 - 1369.676 1265.180 - 1391.546
2025 1352.186 1294.179 - 1410.193 1263.472 - 1440.900
2026 1376.035 1300.892 - 1451.178 1261.113 - 1490.956
2027 1399.887 1306.892 - 1492.881 1257.664 - 1542.109
2028 1423.739 1312.082 - 1535.396 1252.974 - 1594.504
2029 1447.591 1316.431 - 1578.751 1247.000 - 1648.183
2030 1471.444 1319.941 - 1622.947 1239.740 - 1703.147
2031 1495.296 1322.622 - 1667.970 1231.213 - 1759.379
2032 1519.148 1324.492 - 1713.805 1221.447 - 1816.850
IAMPA 2025 - The International Conference on Innovations in Applied Mathematics, Physics, and Astronomy
50

values of the model, the population of Zhengzhou
City will steadily increase over the next decade.
The predicted values for each year in Table 2
include corresponding confidence intervals. The 95%
confidence interval provides a conservative estimate
for population forecasting, while the 80% confidence
interval offers a relatively compact and reasonable
prediction range to complement the uncertainty of the
forecast results.
According to the latest statistical bulletin issued
by the Zhengzhou Municipal Bureau of Statistics, the
actual permanent resident population in Zhengzhou
in 2023 was 13.008 million, while the
model-predicted value was 13.04748 million. The
absolute error between the two values is 0.03948
million, and the relative error is approximately 0.30%.
The actual value falls within the 95% confidence
interval of the predicted population, indicating that
the model's quantification of uncertainty is
reasonable. Due to the limited availability of
single-year data for 2023, the calculation and
interpretation of statistical indicators, such as mean
square error and coefficient of determination, are
constrained. In the future, multi-year data should be
integrated to further validate the reliability of the
model.
This study established an ARIMA (1,2,1) model
with a good fitting effect based on historical
population data from Zhengzhou. However,
population growth is influenced by various factors,
including urban construction, industrial development,
and public budget expenditures (Fang, 2021). This
study only considered historical population data for
Zhengzhou and did not incorporate external variables.
If there is a structural mutation in the data, it may not
be possible to capture the new trend after the
mutation point. Therefore, methods such as the
Bai-Perron test could be introduced to detect jumps
and mutations in time series by observing and
capturing them, enabling segmented modeling or the
introduction of dummy variables for improvement
(Zhu, 2024). The fitting and prediction performance
of the ARIMA model depends on parameter selection
through manual intervention, and its ability to process
nonlinear data is limited. Long-term prediction errors
may accumulate. In practical applications, the
ARIMA model is often combined with machine
learning models for compensation, such as stepwise
regression prediction, which can optimize the model
through data-driven methods and exhibits strong
flexibility and adaptability (Huang, 2025).
4 CONCLUSION
In recent years, Zhengzhou has experienced
significant population growth, primarily driven by
national policy support, geographical advantages,
industrial transformation and upgrading, and
economic development. This study employed time
series analysis methods and conducted rigorous
fitting analysis based on population data from the
Zhengzhou Bureau of Statistics spanning 1982 to
2022. An ARIMA (1,2,1) model with a good fitting
effect was constructed, predicting that Zhengzhou's
population will continue to maintain stable growth
over the next few years, with the resident population
expected to exceed 15 million by 2032. Based on the
results of this study, it can be inferred that
Zhengzhou's population growth trend will remain
relatively stable over the next decade, with promising
potential for continued growth. However, while the
model provides relatively reliable predictions, actual
population growth in Zhengzhou may still be
influenced by various factors. In the long term, with
the expansion of population size, limitations in
resource carrying capacity, as well as the impact of
economic fluctuations, industrial transformation,
regional competition, policy changes, and other
factors, the future long-term population growth in
Zhengzhou is fraught with challenges and
uncertainties. In future research, we can continue to
monitor the accuracy of the model and make
adjustments and revisions based on new data to
conduct in-depth analyses of Zhengzhou's future
population growth trends.
REFERENCES
Fei, J. 2024. Analysis of the fluctuation characteristics and
regional impact of RMB exchange rates on three
currencies: based on MSAR model and Bai-Perron test.
Chinese Business Theory, 15, 31-36.
Fang, W. L. 2021. Analysis of factors influencing the
growth of permanent resident population in Hangzhou
City. Statistical Science and Practice, 10, 29-32.
Feng, Y. J. 2024. Construction of the competitiveness
evaluation model and indicator system for Zhengzhou
national central city. China's Strategic Emerging
Industries, 30, 146-148.
Huang, Q. 2025. Analysis of crop yield prediction in
Qinghai Province based on stepwise regression and
ARIMA model. Southern Agricultural Machinery, 04,
173-176.
Jia, W. M. & Guo, X. M. 2025. Spatial heterogeneity
analysis and driving forces exploring of floating
population in China's central and western regions: a
Prediction of Urban Population Growth in Zhengzhou City Based on Time Series Analysis
51

case of Henan Province, China. Applied Geography,
176, 103516-103516.
Xi, J. 2020, November 2. Speech at the 7th national census
registration. People's Daily.
Zhang, K. G., Meng, H. L., Ba, M. T. & Wen, D. H. 2024.
The spatial distribution characteristics of resident
population growth rate in Henan Province, China.
Journal of Geoscience and Environment Protection,
11, 191-206.
Zhengzhou Daily. 2023. The relevant person in charge of
the Provincial Bureau of Statistics interpreted the
economic performance of the province from January to
April, and the gathering capacity of the Zhengzhou
metropolitan area has significantly improved.
Zhengzhou Municipal People's Government.
https://www.zhengzhou.gov.cn/news1/5013122.jhtml
Zhengzhou Municipal Bureau of Statistics. 2023. Annual
population. Zhengzhou Municipal Bureau of Statistics.
Zhengzhou Municipal Bureau of Statistics & Zhengzhou
Investigation Team of National Bureau of Statistics.
2024. Statistical bulletin on national economic and
social development of Zhengzhou City in 2023.
Zhengzhou Municipal Bureau of Statistics.
https://tjj.zhengzhou.gov.cn/tjgb/8324080.jhtml
Zou, H. 2024. Analysis of the phenomenon of population
return and economic development opportunities in the
central and western regions. China Economic and
Trade Journal, 18, 73-75.
IAMPA 2025 - The International Conference on Innovations in Applied Mathematics, Physics, and Astronomy
52
