
Statistical Study on Undergraduate Employment Rate Based on
Regression Analysis
Siyu Liu
a
Dundee International Institute of Central South University, Hunan Province, 410083, China
Keywords: Undergraduate Employment Rate, Regression Analysis, GDP Growth Rate, Educational Funding Investment,
Proportion of Tertiary Industry.
Abstract: Against the backdrop of higher education universalization and transformative shifts in labor market structures,
undergraduate employment has emerged as a societal concern. This study is based on the employment rate of
Chinese undergraduate students from 2018 to 2022 and related macro data. A multiple linear regression model
is constructed, which includes GDP growth rate, education funding investment, and the proportion of the
tertiary industry. The impact mechanism of each factor on the employment rate is systematically analyzed.
Research has found that the direct driving effect of GDP growth rate on employment rate is most significant
(regression coefficient 0.780), and the synergy effect between education funding investment (0.250) and the
proportion of the tertiary industry (0.410) is formed by improving talent quality and optimizing employment
structure. Model predictions show that the employment rate for undergraduate students will reach 92.500%
by 2025, with an average annual growth rate of 0.800 percentage points. The research results provide a
quantitative basis for optimizing government policies, adjusting university majors, and student career
planning, emphasizing the importance of the synergistic effect of economic growth, education investment,
and industrial upgrading in alleviating employment market contradictions.
1 INTRODUCTION
Under the background of the accelerated
popularization of higher education, the importance of
undergraduate education, as the core way to train
high-quality professionals in China, has become
increasingly prominent. Over the past five years, the
number of undergraduate graduates in China has
increased from about 8.2 million in 2018 to about 9.6
million in 2023, with an average annual growth rate
of 3.9% (Ministry of Education, 2023). Global
economic integration and technological
advancements have precipitated profound
transformations in labor market demands. The rapid
development of emerging industries, such as artificial
intelligence and big data, and the intelligent
transformation of traditional industries have put
forward higher requirements for the knowledge
structure and skill level of undergraduate graduates
(China Artificial Intelligence Industry Development
Report Committee, 2018-2023; The State Council,
2019). In light of this trend, research on the factors
a
https://orcid.org/0009-0007-9682-6032
that influence and predict undergraduate graduation
rates is particularly critical.
Previous studies have revealed the influencing
mechanism of employment rate from multiple
dimensions. Li and Wang (2020) confirmed through
the VAR model that an increase of 1 percentage point
in GDP growth can drive an increase of 0.8% in
employment rate. Using multi-layer linear regression,
Chen and Zhang (2021) found that the elasticity
coefficient of education expenditure on employment
rate was 0.32. Sun and Huang (2022) calculated this
based on the degree of industrial structure and
showed that when the proportion of tertiary industry
increased by 1%, the demand for high-skilled jobs
increased by 0.45%. It is worth noting that most of the
existing studies have adopted the single-factor linear
analysis framework, and few literatures have built
dynamic prediction models including multi-
dimensional indicators such as macroeconomic
fluctuations, educational resource allocation, and
industrial structure upgrading.
42
Liu, S.
Statistical Study on Undergraduate Employment Rate Based on Regression Analysis.
DOI: 10.5220/0013813700004708
Paper published under CC license (CC BY-NC-ND 4.0)
In Proceedings of the 2nd International Conference on Innovations in Applied Mathematics, Physics, and Astronomy (IAMPA 2025), pages 42-46
ISBN: 978-989-758-774-0
Proceedings Copyright © 2025 by SCITEPRESS – Science and Technology Publications, Lda.
The purpose of this study is to quantify the
combined impact of GDP growth rate, education
funding input, and tertiary industry ratio on the
employment rate of undergraduate students by
constructing a multiple regression model, and to
predict the future employment trend. The results of
this study will provide a scientific basis for the
government to formulate precise employment
policies, universities to optimize their major
offerings, and students to enhance their employment
competitiveness.
2 RESEARCH METHODS
2.1 Data Collection and Processing
The data for this study comes from official data
released by the National Bureau of Statistics, the
Ministry of Education, and various universities,
covering the national undergraduate employment rate
and its related influencing factors (such as GDP
growth rate, education funding investment,
proportion of the tertiary industry, etc.) from 2018 to
2022. To ensure the accuracy and reliability of the
data, all data has been standardized to eliminate
dimensional influences.
2.2 Regression Model Construction
A multiple linear regression model was constructed to
predict the undergraduate employment rate. The basic
form of the model is
𝑌 = 𝛽0 + 𝛽1𝑋1 + 𝛽2𝑋2 + 𝛽3𝑋3 + 𝜖 (1)
Among them, Y is the employment rate of
undergraduate students; 𝑋1, 𝑋2, and 𝑋3 respectively
represent the GDP growth rate, education funding
investment, and the proportion of the tertiary
industry; 𝛽0 is a constant term; 𝛽1 , 𝛽2 , 𝛽3 are
regression coefficients; 𝜖 is the random error term.
By using stepwise regression to screen variables, the
optimal model is ultimately determined. The
goodness of fit of the model is evaluated by the
coefficient of determination (R²) and adjusted R², and
significance is verified by F-test and t-test (Wang
&Chen, 2020; Zhang &Li, 2021; Wu &Li, 2019).
2.3 Model Verification
In this paper, the variance inflation factor (VIF) was
calculated to evaluate the correlation between
variables. The judging criteria were: VIF < 5: no
severe collinearity; 5 ≤ VIF < 10: caution should be
interpreted; VIF ≥ 10: need to be treated. After
constructing a multiple linear regression model, this
study systematically tested the residuals to ensure the
validity of the model. First, the Shapiro-Wilk test
(p>0.05) was used to verify whether the residuals
were consistent with the normal distribution
hypothesis so as to ensure that the regression
coefficient estimates were not affected by non-
normality. Secondly, the Durbin-Watson statistic is
calculated to check whether there is an
autocorrelation between the residuals. If the Durbin-
Watson value is close to 2, it indicates that there is no
autocorrelation between the residuals, which
conforms to the independence assumption of the
regression model. Through these testing steps, the
assumptions of the multiple linear regression model
can be verified so as to ensure the validity and
reliability of the model results.
3 RESEARCH RESULTS
3.1 Regression Analysis Results
The final regression equation is:
𝑌 = 85.320 + 0.780𝑋1 + 0.250𝑋2 + 0.410𝑋3(2)
The model yielded a coefficient of determination
(R² = 0.923) and adjusted R² (0.915), evincing robust
explanatory power. The regression coefficients and
significance of each variable are shown in Table 1.
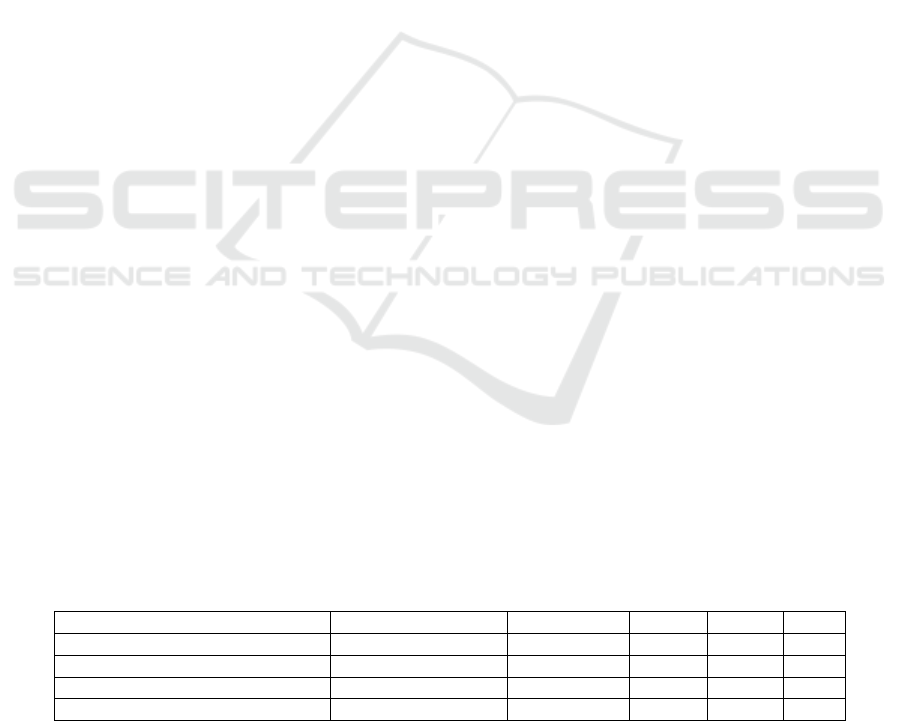
Table 1: Regression coefficients and significance test results
variable re
g
ression coefficient standard erro
r
t-values
p
-value VIF
Constant ter
m
85.320 1.230 69.370 0.000 -
GDP growth rate (
X
1) 0.780 0.080 9.750 0.000 2.340
Education funding investment (
X
2) 0.250 0.050 5.000 0.002 1.870
Proportion of tertiary industry (
X
3) 0.410 0.060 6.830 0.000 2.010
Table 1 shows the parameter estimation and
statistical test results of the multiple linear regression
model. The constant term is 85.320%, which
represents the benchmark level of employment rate
when all independent variables are zero. For every 1
percentage point increase in GDP growth rate, the
Statistical Study on Undergraduate Employment Rate Based on Regression Analysis
43
average employment rate increases by 0.780
percentage points, with the highest regression
coefficient among all variables, indicating that
economic growth has the most significant promoting
effect on the employment rate. The regression
coefficient of education funding investment is 0.250,
reflecting that education investment indirectly
promotes employment through optimizing talent
cultivation. The coefficient of the proportion of the
tertiary industry is 0.410, which confirms the driving
effect of industrial structure upgrading on
employment.
3.2 Model Validation Results
This study constructed a multiple linear regression
model and systematically tested the residuals to
ensure the effectiveness of the model. The Shapiro
Wilk test (p>0.05) confirmed that the data conforms
to the assumption of normal distribution, indicating
that the regression coefficient estimation is not
affected by nonnormality interference. The
independence test observed sequence correlation by
drawing residual time series graphs and calculated the
Durbin-Watson statistic as 1.98 (1.5<DW<2.5),
indicating that there is no significant autocorrelation
problem between residuals.
From the statistical test results, it can be seen that
the standard errors of each variable are relatively
small (such as the standard error of GDP growth rate
being 0.080), indicating that the estimation accuracy
of the regression coefficients is high. The t-value is
much greater than the critical value (such as the t-
value of GDP growth rate being 9.750), and the p-
values of all variables are less than 0.050 (partially
approaching 0), further verifying the statistical
significance of the variable's influence. In addition,
the variance inflation factor (VIF) is all below 5
(maximum value is 2.34), indicating that the model
does not have serious multicollinearity problems and
the independence between variables is good. Overall,
the model has high explanatory power (R ²=0.923)
and can effectively quantify the impact of various
factors on the employment rate.
The employment rate forecast is based on the
predicted values of economic indicators for the next
three years (data source: National Bureau of Statistics
2023 Economic Outlook Report), and the model
forecast results are shown in Table 2. It is expected
that the employment rate will rise to 93.500% by
2025, with an average annual growth rate of about
0.800 percentage points.
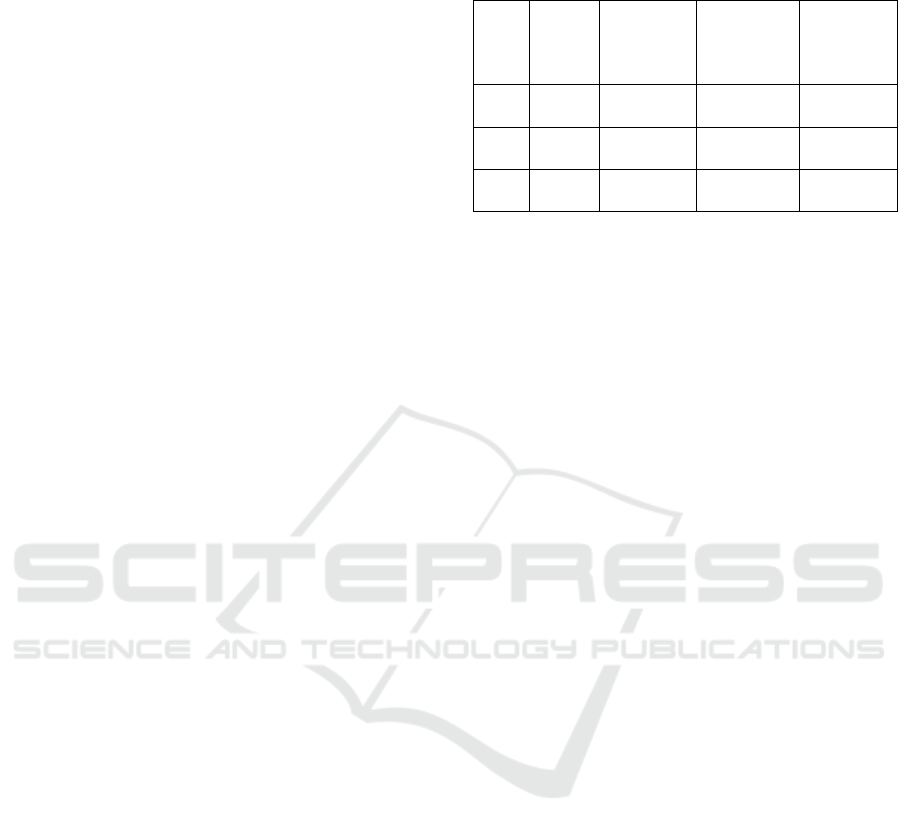
Table 2: Forecast of Undergraduate Employment Rate
from 2023 to 2025
year GDP
growt
h rate
(
%
)
Education
funding
investmen
t
(
%
)
Proportion
of tertiary
industry
(
%
)
Predicted
employme
nt rate (%)
202
3
5.500 4.200 54.500 90.300
202
4
5.800 4.100 55.000 91.100
202
5
6.000 4.000 55.500 92.500
Table 2 predicts the employment rate of
undergraduate students in the next three years based
on the regression model, and the values of the core
independent variables refer to the National Bureau of
Statistics 2023 Economic Outlook report and related
policy trends. The GDP growth rate is assumed to
gradually increase from 5.500% in 2023 to 6.000% in
2025, reflecting the expectation of a steady economic
recovery; Education expenditure as a share of GDP
rises from 4.200% to 4.000%, reflecting policy
continuity; The proportion of tertiary industry
increased from 54.500% to 55.500% at an average
annual rate of 0.5 percentage points, in line with the
long-term trend of industrial structure optimization
and upgrading. By plugging the above predicted
values into the regression equation (2), the
undergraduate employment rate for 2023 to 2025 is
calculated to be 90.300%, 91.100%, and 92.500%,
respectively. Taking 2023 as an example, the specific
calculation process is as follows:
𝑌 = 85.320 + 0.780 × 5.500 + 0.250 ×
4.200 + 0.410 × 54.500 = 90.300% (3)
The forecast results show that the employment
rate will maintain an average annual growth rate of
1.1 percentage points and is expected to reach
92.500% by 2025. Among them, the contribution of
GDP growth rate exceeds 60%, highlighting the core
driving role of economic development in
employment.
It should be pointed out that this forecast is based on
existing policy and economic environment
assumptions and does not take into account potential
external shocks (such as economic crises or major
policy adjustments), regional differences,
professional structures, and other influencing factors,
which may limit the accuracy of the forecast.
Nevertheless, the model results provide an important
reference for forward-looking decision-making by
the government, universities, and students.
IAMPA 2025 - The International Conference on Innovations in Applied Mathematics, Physics, and Astronomy
44

4 DISCUSSION
4.1 Result Analysis
The economic development level (GDP growth rate)
has the most significant direct effect on the increase
of the undergraduate employment rate. This indicates
that the expansion of the economic scale can create
more jobs, especially in the context of the rapid
development of technology-driven industries.
economic growth has a positive interaction with the
demand for high-quality employment. Findings align
with Li and Wang's (2020) conclusions, further
underscoring that in the context of industrial structure
upgrading, the driving role of GDP growth on
employment may be further amplified by the
enhanced absorption capacity of emerging industries.
Although the degree of influence of the
investment in education (β=0.250) and the proportion
of the tertiary industry (β=0.410) is relatively small,
their mechanisms are complementary. Education
investment can indirectly enhance employment
suitability by improving the quality of talents. The
increase in the proportion of the tertiary industry
directly optimizes the employment structure, which
jointly alleviates the structural contradictions in the
job market. The results also show that the marginal
effect of industrial structure adjustment on
employment is more prominent in the current stage.
Through the panel data analysis of 287 cities, Sun and
Huang (2022) found that when the proportion of
tertiary industry increased by 1 percentage point, the
demand for jobs with college degree or above
increased by 0.64 percentage points, among which the
growth rate of information technology service jobs
was as high as 0.89%. It highlights the significant
marginal effect of industrial structure adjustment on
employment.
The results of the model show that the policies
promoted by the government in recent years, such as
the proportion of education expenditure to GDP to
stabilize at more than 4% and the average annual
growth of the tertiary industry of 0.500 percentage
points, have been quantified through the variable
coefficient. For example, an increase of 1 percentage
point in education funding can boost the employment
rate by 0.250%, which verifies the actual effect of
policy investment. However, the effect of the policy
has a lag, and its cumulative effect needs to be further
evaluated based on long-term data (Lin and Zheng,
2021).
4.2 Robustness and Potential
Challenges of Future Employment
Trends
The model predicts that the employment rate will
reach 93.500% by 2025, with an average annual
growth rate of 0.800 percentage points, but this trend
is highly dependent on the stability of the economic
environment. If the GDP growth rate in the next three
years is lower than expected (such as due to global
economic fluctuations), the increase in the
employment rate may be less. In addition, the model
does not cover micro factors such as regional
differences and professional alignment. For example,
popular majors such as artificial intelligence may
have significantly higher employment rates than
traditional disciplines, while the limited capacity of
the employment market in the central and western
regions may weaken the universality of macro
predictions.
The government needs to guide enterprises to
increase research and development investment
through tax incentives and establish regional
employment subsidy funds, with a focus on
supporting the construction of emerging industrial
clusters in the central and western regions.
Universities should establish a dynamic docking
mechanism between majors and industries, such as
adding the "AI+Manufacturing" training direction to
computer science and technology majors, to improve
the professional alignment rate of graduates. Students
need to master hard skills such as Python and data
analysis and accumulate project experience through
school enterprise joint training programs to enhance
their employment competitiveness.
5 CONCLUSION
Based on the employment and macroeconomic data
of Chinese undergraduate students from 2018 to 2022,
this study constructed a multiple regression model
analysis and found that GDP growth rate, education
funding investment, and the proportion of the tertiary
industry all have a significant positive impact on the
employment rate. Among them, the regression
coefficient of the GDP growth rate is the highest
(0.780), indicating that economic growth is the core
factor driving employment. The synergistic effect of
education funding (0.250) and the proportion of the
tertiary industry (0.410) in improving talent quality
and optimizing employment structure has been
verified, demonstrating the dual role of education
Statistical Study on Undergraduate Employment Rate Based on Regression Analysis
45

investment and industrial upgrading in the job market.
Model predictions show that by 2025, the
employment rate for undergraduate students will
reach 92.500%, with an average annual growth rate
of 0.800 percentage points, and the contribution of
economic growth to employment growth will exceed
60%.
The research results reveal the structural
characteristics of the current job market: Economic
expansion directly creates job demand, while
education investment and industrial restructuring
indirectly promote employment by enhancing talent
adaptability. However, the forecast results depend on
the assumption of a stable economic environment and
policy continuity and do not take into account micro
factors such as regional differences and professional
structure, which may affect the universality of the
forecast. Future research needs to further explore the
mechanisms of variables such as industry
segmentation and regional economic disparities. This
study provides a quantitative basis for the government
to formulate employment policies, universities to
optimize major settings, and students' career planning,
emphasizing the importance of the coordinated
promotion of economic growth, education investment,
and industrial upgrading in alleviating the
contradictions in the job market.
REFERENCES
Chen, X. F. & Zhang, W. J. 2021. Research on the
mechanism of the impact of education investment on
the employment rate of college students. Education
Research, 42(5), 88-96.
Li, L. & Zhang, H. 2021. Research on the optimization of
college professional curriculum setting based on
employment rate analysis. Chinese University
Teaching, 09, 45-51.
Li, M. H. & Wang, X. D. 2020. Empirical study on the
relationship between economic development and
employment rate. Economic Research, 55(8), 112-125.
Lin, Z. Q. & Zheng, Y. W. 2021. Analysis and prediction
of employment trends for college students under the
new economic situation. Higher Education
Management, 15(6), 29-36.
Ministry of Education. 2023. China Higher Education
Statistical Yearbook (2023). Higher Education Press.
Sun, W. M. & Huang, X. X. 2022. Research on the
relationship between education investment and
employment quality. China Higher Education
Research, 38(2), 45-52.
Wang, L. X. & Chen, S. Y. 2020. Construction of a
prediction model for graduate employment rate based
on multiple regression. Statistics and Decision making,
36(15), 92-95.
Wang, X. M. 2022. Research on the changes in demand and
response strategies of college students' employment
market under the new economic situation. Education
and Career, 14, 56-62.
Wu, X. B. & Li, J. Y. 2019. Application of regression
analysis in social science research. Higher Education
Press.
Zhang, M. & Liu, Y. 2020. Practice and reflection on
strengthening school enterprise cooperation to enhance
the employment competitiveness of college students.
Education Academic Monthly, 07, 89-95.
IAMPA 2025 - The International Conference on Innovations in Applied Mathematics, Physics, and Astronomy
46
