
Analysis of Influencing Factors of Medical Health Insurance Based
on the Multiple Linear Regression Method
Zihan Xu
a
Beijing Normal-Hong Kong Baptist University Faculty of Science and Technology Statistics,
Guang Dong, Zhu Hai, 519000, China
Keywords: Multiple Linear Regression, Medical and Health Insurance, Consumer Demand.
Abstract: With the rapid development of the insurance industry and people's increasing attention to health, the insurance
market has ushered in a good development space. However, the habits and needs of consumers directly affect
the medical and health insurance industry. Exploring the control of influencing factors of health insurance
can better allocate health care services to improve the efficiency of the health care system. Therefore, this
paper selects variables and data related to personal medical consumption from the Kaggle website, takes the
personal medical expenses charged by health insurance as the explanatory variable, and takes the age, gender,
BMI index, number of children raised by the insured, whether the insured has smoking habits, and region as
the explanatory variable to establish a multiple linear regression model and test it. The empirical results show
that the age of the insured, the BMI index, the number of children raised, and whether the insured smokes
have a significant impact on the personal medical expenses issued by the health insurance.
1 INTRODUCTION
Commercial insurance markets around the world are
developing at a high speed, and the total premium
income is growing continuously. Since 2020, its total
revenue has increased from US $3.96 trillion to US
$4.17 trillion, up 3.7% year on year (Guo, 2024). With
the rapid development of Internet finance-related
technologies, the income level of residents is
constantly improving, with higher requirements for
the quality of life, and people are paying more and
more attention to health issues. At present, the number
of people with various chronic diseases and sub-
health conditions has surged, and the number of
malignant tumors has increased. In addition to the
outbreak of the COVID-19 epidemic, the public's
demand for health insurance has become more urgent
(Chen et al., 2023). The total number of health
insurance products that consumers are willing to
purchase in a specific period and have the ability to
purchase is insurance demand (Feng, Xu, Zou, 2023).
Therefore, the customer demand of the health
insurance market is composed of the purchase
intention and actual purchasing ability of the
a
https://orcid.org/0009-0004-8897-7226
applicant. By improving the coverage of medical
insurance, medical and health services can be
efficiently used to control the medical and health costs
of patients, and medical insurance can also effectively
share the disease risk of residents (Qi, 2023).
Fulton et al. (2018) studied the health expenditure
in California, and the results showed that factors such
as population aging, per capita real income, and
medical industry inflation were closely related to the
increase in health expenditure. At the same time,
technological innovations such as risk-sharing
systems, value-based payments, and practice
adjustments could potentially constrain the growth of
health spending. The research on whether economic
incentives should be implemented in Australia's
health insurance shows that the target group of health
insurance is mainly high-income people (Kettlewell
& Zhang, 2024). There is a clear trend of financial
inequality in the insurance industry, and the reason
behind it is that the poor have far fewer opportunities
to purchase insurance for various risks than the rich
or the middle class (Tsvetkova et al., 2022).
Therefore, the level of income has become one of the
key research objects of the factors affecting medical
insurance. A study on the driver allocation of
Xu, Z.
Analysis of Influencing Factors of Medical Health Insurance Based on the Multiple Linear Regression Method.
DOI: 10.5220/0013813500004708
Paper published under CC license (CC BY-NC-ND 4.0)
In Proceedings of the 2nd International Conference on Innovations in Applied Mathematics, Physics, and Astronomy (IAMPA 2025), pages 31-36
ISBN: 978-989-758-774-0
Proceedings Copyright © 2025 by SCITEPRESS – Science and Technology Publications, Lda.
31

commercial health insurance in China highlights the
current research on the impact of aging on insurance
purchase intention and believes that participation of
middle-aged and elderly people in health insurance
plans has a positive impact on their physical condition
(Huang et al., 2022). Bhawani analyzed its impact on
the health service industry from the aspects of
enterprise competition and the supply of production
factors and proposed to increase the financial support
for the industry and the guidance function of the
government to avoid vicious competition (Bhawani,
2010). Zhao & Li (2024) believe that consumers'
participation in commercial medical insurance is
mainly influenced by subjective factors such as
gender, job category, and economic status and
objective factors such as the management and
operation of insurance companies.
According to Davilla & Jones (2025), forward-
looking policies aimed at improving the efficiency of
healthcare systems through better control and
distribution of healthcare services require information
from the general population. Existing research has not
distinguished the impact of various factors on
insurance demand among different insured
individuals. This study established four linear
regression models and screened for the optimal
model, examining key factors and characteristics that
influence the insurance purchasing decisions of
insured individuals or their family members.
2 PRINCIPLES OF MULTIPLE
LINEAR REGRESSION AND
MODEL SELECTION
CRITERIA
The main principle of multiple linear regression is to
build a regression equation containing multiple
independent variables and a dependent variable and
interpret and infer the value of the dependent variable
according to the value of multiple independent
variables. Therefore, using the optimal set of multiple
independent variables to predict the dependent
variables is more accurate than using a single
independent variable to predict. The core of the
multiple linear regression model is to build a function
that can minimize the square value of the difference
between the predicted value and the true value. The
multiple linear regression model is usually used to
describe the random linear relationship between the
dependent variable 𝑌 and the independent variable
𝑋. The use of multiple linear regression also requires
the following three conditions: first, there must be a
random linear relationship between 𝑌 and 𝑋 .
Second, each observation value 𝑌 is independent of
each other. Third, the residual should be subject to the
normal distribution with the mean value of 0 and the
variance of 𝛿
, that is, for any group of observations
of the independent variable, the dependent variable 𝑌
has the same variance and is subject to the normal
distribution (Lu et al., 2025).
The purchase factor prediction model of medical
health insurance studied in this paper is aimed at a
regression problem, and the adjustment coefficient of
determination R²_adj, coefficient of prediction value
of determination R² _pred, root mean square error
Root Mean Square Error (RMSE), sum of prediction
error of Prediction Residual Error Sum of Squares
(PRESS), and Cp statistics are used to evaluate the
prediction model. The above evaluation indicators of
the original model and the new model were calculated
and compared one by one, and the optimal model was
finally selected (Qin, 2024).
Adjusted R-squared is an adjustment based on R-
squared, which is used to measure the degree of
interpretation of independent variables to dependent
variables. R-squared predict value is an indicator used
to measure the degree of fitting and prediction ability
of linear regression models to new data not used for
model training. In practical applications, their values
are usually between 0 and 1, and the closer to 1, the
better the model fits the data; The closer to 0, the
worse the fitting effect of the model. RMSE quantifies
the average error range of model prediction. The
smaller the value, the higher the prediction accuracy
of the model. PRESS value can evaluate the
generalization ability of the model and reflect the
prediction error of the model to new data. The smaller
the value, the stronger the prediction ability of the
model, and the lower the risk of overfitting. The Cp
value is used to measure the comprehensive impact of
model deviation and variance. The closer the number
of independent variables p is, the better the model will
be.
3 EMPIRICAL ANALYSIS
3.1 Data Collection and Processing
In view of the fact that this paper is going to study the
factors affecting medical and health insurance, this
paper collects and collates the statistical data set of
relevant factors affecting personal medical expenses
charged by health insurance from the Kaggle website
for empirical analysis. This data set is the first-hand
IAMPA 2025 - The International Conference on Innovations in Applied Mathematics, Physics, and Astronomy
32
real data collected by Klymentiev (2018) from the
area where he lives on the Kaggle website, and more
than 60000 people have browsed and downloaded this
data before this. Therefore, this data set is reliable and
has research value. This data set contains 1338
samples and 7 variables, namely age, sex (male,
female), BMI, children, smoker, region, and charges.
After understanding the basic structure and
information of the data, the data set was cleaned, the
outliers and duplicate values were eliminated, and the
missing values were filled with average values. Then,
the data was converted into a format suitable for
analysis and standardized, and the data that could be
used for subsequent statistical analysis were obtained.
3.2 Basic Data Analysis
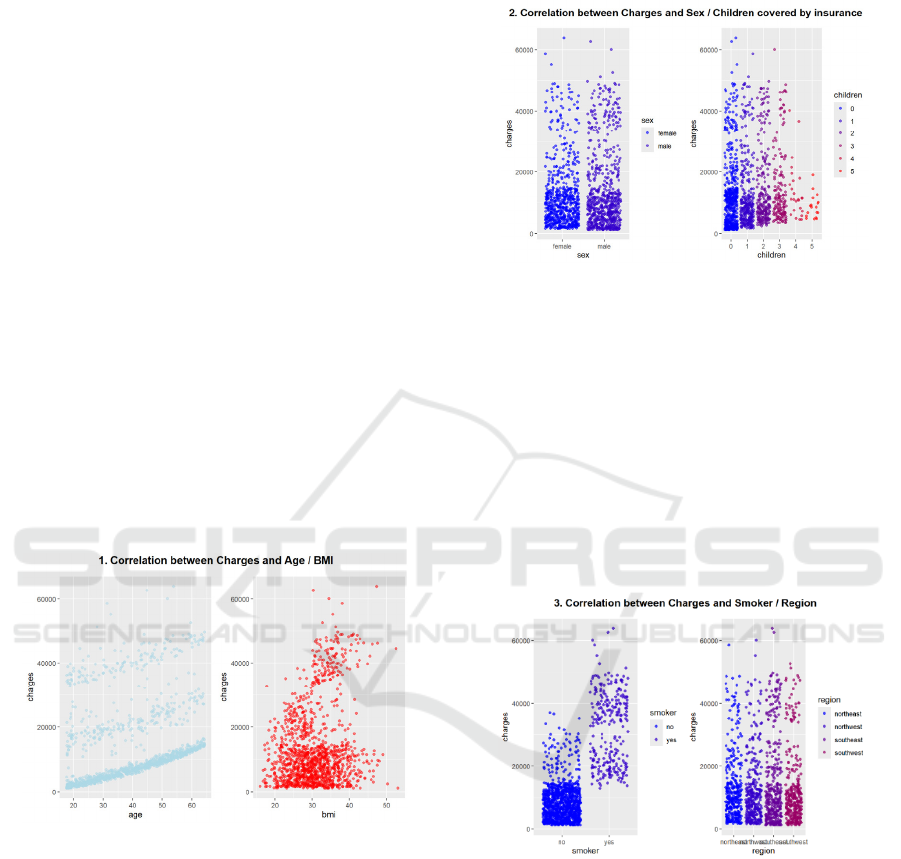
In this paper, scatter plots are drawn for six variables
in the data that affect the cost of health insurance. As
shown in Figure 1, the cost of health insurance
increases with the age of the insured and the increase
of the insured's body mass index. Moreover, in all age
groups and BMI ranges, the vast majority of people
who buy medical and health insurance spend less than
20,000, and the number of people who buy medical
and health insurance whose BMI is greater than 20
and less than 40 is large and concentrated.
Figure 1: Scatter plot of the relationship between Medicare
billing and the age and BMI of the policyholder
(Photo/Picture credit: Original).
The scatter plot in Figure 2 shows that the
distribution of costs for purchasing health insurance
is roughly similar for men and women. For both men
and women, most investments fall between 0 and
20,000, with the number of people decreasing as
investment increases. Therefore, the gender of the
insured does not seem to have a significant impact on
individual medical expenses. In contrast, the number
of children an insured person has is the opposite; as
shown in Figure 2, there is a positive correlation
between health insurance costs and the number of
children an insured person has, meaning the more
children they have, the higher their health insurance
expenses.
Figure 2: Scatter plot of the relationship between health
insurance billing and the gender of the insured and the
number of children raised (Photo/Picture credit: Original).
Similarly, Figure 3 shows that whether or not an
insured person smokes has a significant impact on
personal health care costs - smokers pay significantly
more for health insurance than non-smokers. Similar
to the gender variable, the distribution of health
insurance investment in the northeast, northwest,
southeast, and southwest are identical, including the
growth trend, so the region where the insured lives
does not have a significant impact on health insurance
costs.
Figure 3: Scatter plot of the relationship between health
insurance billing and whether the insured person smokes
and where they live (Photo/Picture credit: Original).
3.3 Model Construction
According to the selected data, this paper takes the
personal medical expenses charged by the health
insurance as the explanatory variables, and takes the
age, gender, BMI - body mass index of the applicant,
that is, the ratio of height to weight, the number of
children covered by the health insurance, that is, the
number of children supported by the applicant,
whether the applicant smokes, and the residential area
Analysis of Influencing Factors of Medical Health Insurance Based on the Multiple Linear Regression Method
33

of the applicant as the explanatory variables.
Therefore, 𝑌𝑖 represents the personal medical
expenses issued by the health insurance,
𝑋1 represents the age of the applicant 𝑋2 represents
the gender of the applicant, 𝑋3 represents the BMI
of the applicant, 𝑋4 represents the number of
children covered by health insurance, 𝑋5 represents
whether the applicant smokes, and 𝑋6 represents the
residential area of the applicant. Therefore, set the
original model:
𝑌𝑖 = 𝛽0 + 𝛽1 𝑋1 + 𝛽2 𝑋2 + 𝛽3 𝑋3 + 𝛽4 𝑋4 +
𝛽5 𝑋5 + 𝛽6 𝑋6 + εi (1)
Where the random error term 𝜀𝑖 is a random
variable that follows a normal distribution.
Table 1: Regression coefficient of the original model
Estimate Std.Erro
r
T value Signif. codes
(Intercept) -12269.71 1251.90 -9.80 ***
X1 263.84 14.99 17.60 ***
X2male -53.05 414.01 -0.12
X3 353.03 35.69 9.89 ***
X4 343.54 169.46 2.02 *
X5yes 23350.20 527.93 44.22 ***
X6northwest -574.30 590.85 -0.97
X6southeast -817.24 595.69 -1.37
X6southwest -1441.10 593.34 -2.42 *
Then, this paper conducts linear regression
analysis on the original model (Model_0) and obtains
the regression coefficient as shown in Table 1.
Estimate represents the estimated regression
coefficient of each variable. In the table, except for
the intercept, only the variables representing gender
and region are negative, which means that the average
change of the insured's gender and region is opposite
to the average change of the dependent variable -
personal medical expenses. According to Figure 2 and
Figure 3 in the basic data analysis and the linear
regression analysis of the original model as shown in
Table 1, individual variables are not important, such
as the gender and the region of the insured. Therefore,
on the basis of the original model, the variable 𝑋6
representing the insured area is deleted, and model I
is established:
𝑌𝑖 = 𝛽0 + 𝛽1 𝑋1 + 𝛽2 𝑋2 + 𝛽3 𝑋3 + 𝛽4 𝑋4 +
𝛽5 𝑋5 (2)
Delete the variable 𝑋2 representing the gender of
the insured and establish model II:
𝑌𝑖 = 𝛽0 + 𝛽1 𝑋1 + 𝛽3 𝑋3 + 𝛽4 𝑋4 + 𝛽5 𝑋5 +
𝛽6 𝑋6 (3)
At the same time, delete the variable 𝑋2
representing the gender of the applicant and the
variable 𝑋6 representing the region of the applicant,
and establish model Ⅲ:
𝑌𝑖 = 𝛽0 + 𝛽1 𝑋1 + 𝛽3 𝑋3 + 𝛽4 𝑋4 + 𝛽5 𝑋5(4)
3.4 Screening and Determination of
Regression Models
Table 2: Comparison of four model indicators
Prediction result R²-adj R²_pre
d
RMSE PRESS Cp
Model_0 0.7341 0.7808 5848.0110 34845147347
—
Model
_
Ⅰ 0.7301 0.7820 5831.7990 34768109782 2.9577
Model
_
Ⅱ 0.7326 0.7807 5848.5640 34845548436 6.9868
Model
_
Ⅲ 0.7342 0.7821 5831.3000 34767737117 3.9467
It can be seen from Table 2 that the RMSE value
of model Ⅲ is smaller, indicating that the average
difference between the predicted value of the model
and the actual observed value is smaller, which means
that the prediction effect of the model is better, the
degree of data fitting is higher, and the rule in the data
can be more accurately captured and predicted.
Table 3: Three regression coefficients of the model
Estimate Std.Error
T
value
Signif.
codes
(Interce
p
t
)
-12749.12 1189.57 -10.71 ***
X1 264.40 15.00 17.62 ***
X3 343.94 34.57 9.95 ***
X4 333.84 169.47 1.97 *
X5
y
es 23374.05 523.77 44.62 ***
IAMPA 2025 - The International Conference on Innovations in Applied Mathematics, Physics, and Astronomy
34
By observing Table 3, it can be concluded that the
estimations of regression coefficients in model Ⅲ
are all greater than 0 except for the intercept, and it
can also be intuitively observed through the
significance code that the four variables in model Ⅲ
have significant impacts on 𝑌𝑖 . In summary, this
paper chooses model Ⅲ:
𝑦
= 12749.17 + 264.40𝑋
+ 343.94𝑋
+
333.84𝑋
+ 23374.05𝑋
(5)
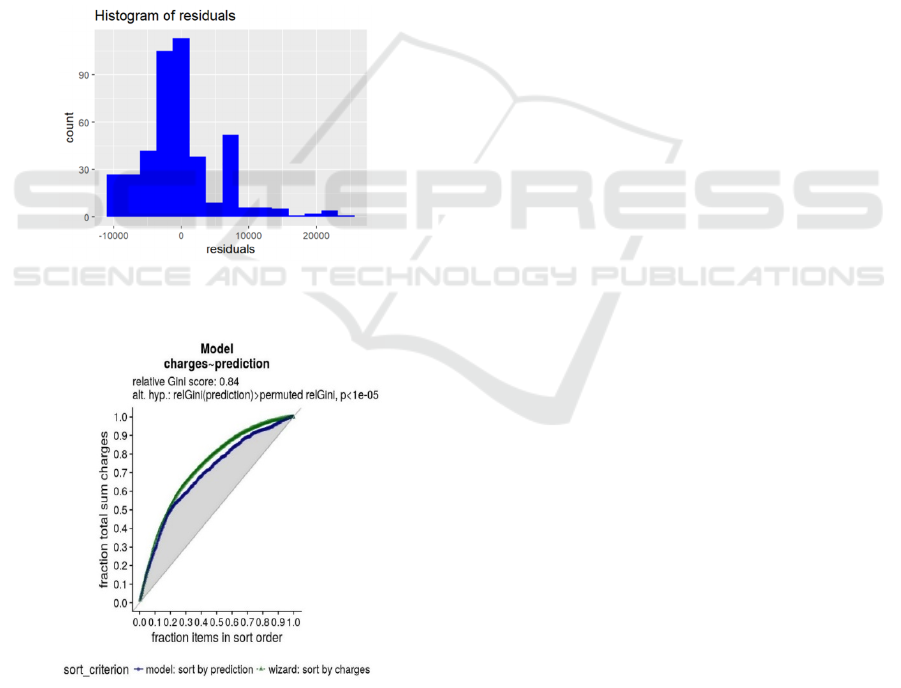
3.5 Residual Analysis
Figure 4 The distribution of the residual histogram is
roughly high in the middle and low on both sides. The
number of residuals near 0 is the largest, and the
number on both sides gradually decreases, which is
similar to the characteristics of normal distribution.
Figure 4: Histogram of residual error (Photo/Picture credit:
Original).
Figure 5: Model performance graph of the proportion of
total costs versus the proportion of items in order of ranking
(Photo/Picture credit: Original).
Figure 5 shows that the performance of the model
in Gini score = 0.84, an indicator to measure the
differentiation ability of the model, which indicates
that the model selected in this paper has a strong
ability to distinguish different categories or values. In
addition, the relative Gini score of the predictor is
significantly higher than that after replacement, and
the P-value is less than 0.00001, indicating a very
high level of significance. The two curves showing
the relationship between the proportion of the total
cost and the proportion of the items in order are close
and far away from the diagonal line. In addition, the
model error is close to zero, indicating that the model
has a good performance in predicting the cost, which
further indicates that the model has statistical
significance.
4 CONCLUSION
To sum up, this study systematically analyzed the key
factors affecting personal medical and health
insurance expenses through the multiple linear
regression method, built four prediction models based
on the Kaggle dataset, and conducted comprehensive
verification. Through a large number of calculations
and comparisons, this paper finally determined that
Model 3 was the optimal model among the four
candidate models, and its adjusted R ² reached
0.7342, and the predicted R² was 0.7821, indicating
that the model has good explanatory power and
prediction accuracy. In addition, residual analysis
shows that the error term of the model is
approximately a normal distribution, and the model
has excellent discrimination ability. Therefore, this
paper can determine that the age of the insured, its
BMI index, the number of children raised and whether
there is smoking habit are the main factors affecting
the personal medical expenses issued by the health
insurance, and these four variables are positively
correlated with the dependent variables, of which the
influence of smoking habit is the most prominent. It
is worth emphasizing that, different from the existing
research conclusions, this study finds that gender and
regional factors have no significant impact on health
insurance costs, which may reflect the specific
medical pricing policies or cultural factors in the
sample region.
REFERENCES
Bhawani, X. 2010. The determination of agglomeration in
health care sector employment in US metropolitan
areas. Paper Presented on 41st Annual and Conference
Analysis of Influencing Factors of Medical Health Insurance Based on the Multiple Linear Regression Method
35

Mid-Continent Regional Science Association, 12(7), 1-
23.
Chen, S., Lin, Z., Wang, X., & Xu, X. 2023. Pandemic and
insurance purchase: How do people respond to
unprecedented risk and uncertainty. China Economic
Review, 79, 61-62.
Feng, J., Xu, X., & Zou, H. 2023. Risk communication
clarity and insurance demand: The case of the COVID-
19 pandemic. Journal of Economic Dynamics and
Control, 146, 3-32.
Fulton, B., Scheffler, R., Keolanui, B., & Shortell, S. 2018.
Forecasts and drivers of health expenditure growth in
California. California Journal of Politics & Policy,
7(2), 177-178.
Guo, W. 2024. Income volatility and household commercial
insurance allocation. Finance Research Letters, 66, 5-
7.
Huang, X., Tung, C., Wang, X., Xu, X., Lam, F., & Zhang,
T. 2022. Configurations of the driving factors
promoting China's commercial health insurance: A
comparative qualitative analysis based on the
Technology – Organization – Environment framework.
Heliyon, 8(11), 6-35.
Kettlewell, N., & Zhang, Y. 2024. Financial incentives and
private health insurance demand on the extensive and
intensive margins. Journal of Health Economics, 94, 2-
14.
Klymentiev, R. 2018. Health care cost prediction with linear
regression models.
https://www.kaggle.com/code/ruslankl/health-care-
cost-prediction-w-linear-regression/report
Lu, X., Teh, S., Tay, C., Kassim, N., Fam, P., & Soewono,
E. 2025. Application of multiple linear regression
model and long short-term memory with compartmental
model to forecast dengue cases in Selangor, Malaysia
based on climate variables. Infectious Disease
Modelling, 10(1), 240-256.
Qi, B. 2023. Property insurance company short-term
medical health insurance marketing strategy
optimization research. Master's thesis, Guizhou
University of Finance and Economics.
Qin, Y. 2024. A comparative study of housing price
forecasting models based on multiple linear regression
and random forest algorithm. Modern Information
Technology, 8(22), 127-131.
Tsvetkova, L., Okhrimenko, I., Belousova, T., &
Khuzhamov, L. 2022. Relationship and mutual
influence between poverty and insurance in a
developing insurance market. Journal of Behavioral
and Experimental Finance, 36, 66-67.
Zhao, J., & Li, F. 2024. Analysis of factors influencing
participation intention of inclusive commercial medical
insurance: Based on logistic regression and CHAID
decision tree model. Chinese Health Service
Management, 41(05), 523-528.
IAMPA 2025 - The International Conference on Innovations in Applied Mathematics, Physics, and Astronomy
36
