
Analysis of Factors Influencing Electric Vehicle Sales Based on the
Multiple Linear Regression Model
Yangjian Xiao
*
a
Faculty of Mathematics, University of Waterloo, Waterloo, ON N2L 3G1, Canada
Keywords: Electric Vehicle, EV Stock, EV Sales Share, EV Stock Share.
Abstract: As electric vehicles are at the core of the global automotive industry's transformation and significantly reduce
greenhouse gas emissions, understanding the owners of electric vehicle sales is important for policymakers
and corporate partners. The main objective of this study is to examine the key drivers of electric vehicle (EV)
sales, with a particular focus on market penetration and stock dynamics. To achieve this, the study employs
multiple linear regression (MLR) analysis, a statistical technique that models the relationship between a
dependent variable and multiple independent variables using a linear equation. Utilizing detailed information
from 2010 to 2024 and predictions that extend to 2035, this research examines how combined EV stock, EV
sales share, and EV stock share affect regular EV sales across different areas. The results indicate that
combined EV stock and EV stock share are important indicators of EV sales, addressing the importance of
boosting EV market presence to drive adoption. By measuring these associations, this study provides valuable
insights for governments, businesses, and owners who want to encourage EV implementation through
appropriate legislation changes. These results support more extensive efforts to promote responsible travel
and decrease global carbon emissions.
1 INTRODUCTION
Electric vehicles (EVs) are receiving increased
attention for their capacity to curb air pollution and
decrease dependency on fossil fuels (Li & Ouyang,
2021). According to Ford (2023), large-scale datasets
of global EV trends indicate a sharp rise in both EV
stock and charging infrastructure from 2010 onward,
underscoring how supportive conditions can
powerfully shape market trajectories. The analysis of
factors affecting electric vehicles sales is of great
significance. In European contexts, Zhou and Li
(2022) argue that income levels and shifting fuel costs
substantially influence EV purchase decisions,
highlighting how financial considerations can differ
by region. Meanwhile, Kang and Park (2020)
emphasize the role of social dynamics and
environmental awareness, showing that broader
public support can accelerate EV adoption.
Zhang and Lu (2020) illustrate that in China, the
presence of robust charging networks corresponds
a
https://orcid.org/0009-0008-9741-3763
*
Corresponding author
directly to higher EV uptake, suggesting that
accessible infrastructure stands out as a key
determinant. Chen and Chou (2022) find that in the
United States, range anxiety remains a core consumer
concern, although lower operating costs still motivate
a growing segment of buyers. Wu and Zhao (2021)
contend that battery innovations, particularly those
improving driving range and energy density, have
steadily reduced technological barriers, making EVs
more palatable to mainstream markets.
Beyond these early adoption drivers, recent
analyses shine a fresh light on how EV sales, EV
stock, and market share metrics shape overall growth.
The International Energy Agency (IEA) (2022)
reports that total EV sales have been climbing
steadily, driven by a combination of cost reductions
and growing infrastructure investment. According to
BloombergNEF (2023), forecasts through the early
2030s suggest that EVs will likely dominate new car
registrations in several leading markets, pushing EV
stock share upward even in regions currently
dominated by internal combustion engines. Jin and
Xiao, Y.
Analysis of Factors Influencing Electric Vehicle Sales Based on the Multiple Linear Regression Model.
DOI: 10.5220/0013813400004708
Paper published under CC license (CC BY-NC-ND 4.0)
In Proceedings of the 2nd International Conference on Innovations in Applied Mathematics, Physics, and Astronomy (IAMPA 2025), pages 25-30
ISBN: 978-989-758-774-0
Proceedings Copyright © 2025 by SCITEPRESS – Science and Technology Publications, Lda.
25

Slowik (2021) find that such expansions in EV
market share often track closely with government
incentive programs, underscoring the importance of
strategic policy intervention. In parallel, Yang, Liao,
and van Wee (2020) confirm that subsidies and tax
rebates can significantly boost local EV sales,
influencing both consumer decisions and automaker
production choices. Sakti, Jaller, and Lee (2021) note
that as EV sales share rises, reinforcing charging
infrastructure and supply chains becomes critical to
sustaining the momentum.
In light of this global perspective, the adoption of
electric vehicles differs considerably. It is influenced
by several regional factors, including promoting
relationships, marketing trends, and charging
infrastructure. This research uses a multiple linear
regression approach to identify and analyze the main
factors that affect EV sales. We use robust standard
errors (HC3) and log transformations to increase
model reliability and address non-linearity and
heteroscedasticity. To aid the transition to sustainable
transportation systems, this study uses quantitative
measures like EV sales, EV sales share, EV stock, EV
stock share, and charging station size to provide
helpful insights to stakeholders, including urban
planners, automobile manufacturers, and
governments. Manufacturers and urban planners are
looking to accelerate the transition to sustainable
transportation systems.
2 METHODOLOGY
2.1 Data Source and Description
This study uses the IEA Global EV Data dataset from
Kaggle and the comprehensive data on electric
vehicle (EV) adoption across various regions between
2010 and 2024. Also, the database includes
projections for 2035. Along with EV sales, EV stock
prices, EV sales share, and EV stock share, analytical
variables like having details are included in the
database. The data covers a range of geographical
regions and years and thoroughly examines how
significant factors driving car implementation are.
According to uniformity, the factors measured on
several scales, such as the range of vehicles versus the
percentages, are standardized and similar across
several years and regions. The key features and
information from this study are summarized in Table
1.
Table 1: Definition of variables.
Variable Descri
p
tion Ran
g
e
EV Sales (𝑦)
Total number of EVs sold in the region (annual) [0.001, 62000000]
EV Charging points (𝑥
)
Total publicly accessible EV charging points in the region [0.1, 15000000]
EV Sales Share (𝑥
)
Percentage of EV sales in the total vehicle market [0.0000320, 93]
EV Stoc
k
(𝑥
)
Cumulative stock of EVs in the region. [1, 44000000]
EV Stock Share (𝑥
)
Percentage of EVs in the total vehicle stock. [0.0000150, 58]
2.2 Method Introduction
Given the continuous nature of EV sales, this study
employs Multiple Linear Regression (MLR) as the
primary method to assess the key factors influencing
electric vehicle (EV) sales. Multiple linear regression
can be used to model a regiment variable's
relationship to several separate parameters. This
technique is especially useful for examining how
variations in EV sales are influenced by charging
infrastructure, combined EV stock, EV sales share,
and EV stock share. The dependent variable (EV
Sales) is represented by a linear combination of
independent variables in multiple linear regression
models expressed as:
𝑦=𝛽
+𝛽
𝑥
+𝛽
𝑥
+⋯+𝛽
𝑥
+𝜀
(1)
Where 𝑦 represents the total EV sales, 𝑥
are the
independent variables that capture key economic and
infrastructural factors, 𝛽
are the regression
coefficients measuring the strength and direction of
influence, and 𝜀 is the error term, accounting for
variations not explained by the model. To estimate the
coefficients, this study employs the Ordinary Least
Squares (OLS) method, which minimizes the
discrepancy between actual and predicted sales
values. The objective function for optimization is
given by:
β
=argmin
𝑦
−𝑦
(2)
Which represents the estimation of regression
coefficients using the Ordinary Least Squares (OLS)
method. Here, β
denotes the estimated coefficients
that minimize the sum of squared residuals, where
IAMPA 2025 - The International Conference on Innovations in Applied Mathematics, Physics, and Astronomy
26
each residual is the difference between the observed
value 𝑦
and the predicted value 𝑦
. The term β
represents the set of regression coefficients being
optimized. The important work ensures that the
chosen coefficients provide the best possible right
match by reducing the regiment variable's common
error. The characteristics that best capture the contact
between the different and answer guidelines are
created in multiple linear regression. The research
software enables a deeper understanding of the
impact of each indicator on EV sales while avoiding
forecast error.
Given the continuous nature of EV sales and the
potential for non-linearity in the relationships
between predictors and the response variable, this
study employs a log-linear multiple regression model
as an extension of multiple linear regression. By
applying logarithmic transformations to both the
dependent variable and key predictors, the model
effectively captures proportional relationships and
reduces heteroscedasticity. The log-linear model
takes the following form:
𝑙𝑜𝑔𝑦 = 𝛽
+𝛽
𝑙𝑜𝑔𝑥
+𝛽
𝑙𝑜𝑔𝑥
+⋯
+𝛽
𝑙𝑜𝑔
𝑥
+𝜀
(3)
Applying this transformation allows us to
interpret the coefficients in terms of elasticity,
meaning that a 1% increase in a predictor corresponds
to an approximate β
% change in EV sales, holding
all other factors constant.
3 RESULTS AND DISCUSSION
3.1 Visualization Analysis
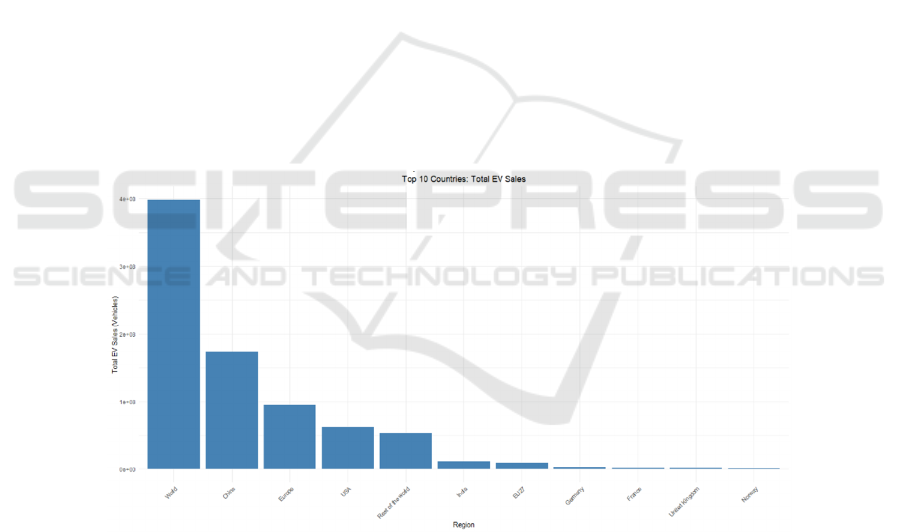
To gain insights into the distribution of electric
vehicle (EV) sales across different regions, we first
conducted a preliminary data quality assessment,
which included checking for missing values and
ensuring the dataset’s integrity. After confirming the
dataset’s completeness and reliability, we proceeded
with data visualization to better understand the
regional disparities in EV sales. The bar chart (Figure
1) presented below provides a comparative analysis
of total EV sales worldwide, with a focused
examination of the top ten countries contributing
most significantly to global EV adoption. This
approach ensures clarity and highlights the dominant
regions in the EV market.
Figure 1: Total EV Sales Worldwide and in the Top 10 Countries (Photo/Picture credit: Original).
3.2 Model Result
Understanding the factors influencing EV sales is
crucial for policymaking, infrastructure development,
and market forecasting in an electric vehicle (EV)
market analysis. To achieve this, a log-linear
regression model was developed to measure the
relationship between EV sales and its essential factors,
including EV stock share, EV sales share, EV stock,
and EV charging points. With the aid of the log-linear
regression model, it can be determined whether or not
each indicator impacts the growth of EV sales and
whether these correlations are statistically significant.
The log-linear regression model is expressed as
follows:
log
𝑦
= −0.559 + 0.055log
𝑥
+0.194log
x
+0.905log
𝑥
−0.396log
𝑥
(4)
Analysis of Factors Influencing Electric Vehicle Sales Based on the Multiple Linear Regression Model
27

Table 2 presents the ordinary least squares (OLS)
regression results with heteroscedasticity-responsive
(HC3) standard errors to understand EV sales' main
determinants. For each indicator, the columns report
the estimated factor, strong common mistake, t-
statistics, p-value, and 95 percent trust period (CI),
and each row represents a model-independent
variable.
Table 2: OLS Regression Results table.
Feature Coefficient Robust SE t
p
-value [0.025 0.975]
const -0.559 0.118 -4.725 0.000*** -0.791 -0.327
Lo
g
EV char
g
in
g
p
oints 0.055 0.025 2.209 0.027** 0.006 0.104
Lo
g
EV sales share 0.194 0.031 6.308 0.000*** 0.134 0.254
Log EV stoc
k
0.905 0.025 35.413 0.000*** 0.855 0.955
Log EV stock share -0.396 0.045 -8.745 0.000*** -0.485 -0.307
Note: ***, **, and * represent significance levels of 1%, 5%, and 10%, respectively. The Standard Errors are
heteroscedasticity robust (HC3).
The intercept of the model is negative and
significant, meaning that when all predictors are zero,
the expected dependent variable value is negative. A
1% increase in EV charging points is associated with
a 0.055% increase in the dependent variable. The
effect is statistically significant at the 5% level.
Similarly, a 1% increase in the share of EV sales
correlates with a 0.194% increase in the dependent
variable. This relationship is strongly significant. A
1% increase in EV stock is associated with a 0.905%
increase in the dependent variable. This has the
largest effect and is highly significant. A 1% increase
in EV stock share correlates with a 0.396% decrease
in the dependent variable, suggesting a negative
effect.
Table 3 shows the VIF.
Table 3: Variance Inflation Factor (VIF) Analysis.
Feature VIF
const 20.036037
Log EV charging points 3.869944
Lo
g
EV sales share 3.275625
Log EV stoc
k
4.786732
Log EV stock share 2.909117
Table 4 shows the model fit.
Table 4: Model Fitness.
R-squared
Adj. R-
square
d
F-statistic
Prob (F-
statistic)
0.958 0.958 2591 2.20e-281
The variance inflation factor (VIF) analysis in
Table 3 indicates that multicollinearity is
manageable, ensuring the model's stability. These
findings reinforce the status of EV market penetration
and infrastructure expansion in generating potential
EV sales adjustments. Table 4 shows the model fit.
The R-squared is 0.958, which shows that the data fits
the regression model well. The F-statistics (2591)
indicate that the model is highly statistically
significant in explaining log (EV sales).
4 DISCUSSION
The Breusch-Pagan test confirms the presence of
heteroscedasticity in the model (LM Statistic =
21.1939, p-value = 0.0002898), necessitating the use
of heteroscedasticity-robust standard errors (HC3) for
valid statistical inference. The results from Table 2
show that all features are statistically significant,
highlighting the importance of EV stock, EV stock
share, and EV sales share in predicting EV sales.
Despite having a statistically significant impact, the
fairly minimal index of EV charging points suggests
that market penetration interactions play a secondary
part in EV implementation.
This research mainly analyzes the IEA Global EV
Data. Although this dataset contains information on
EV sales and ownership in many regions around the
world, it may still have limitations in terms of
geographical coverage or data segmentation. For
example, the real situation of some emerging markets
or countries with large regional differences may not
be fully reflected. To further improve external
validity, consider multi-source data integration:
Integrate public databases (such as IEA (2022),
BloombergNEF (2023), etc.) with official statistics
released by transportation departments and
automobile associations of various countries/regions
to obtain more detailed and representative data.
Supplement key segmentation indicators: For
example, quantitative indicators such as
supplementary fiscal subsidies, regional income
levels, and consumer environmental awareness
IAMPA 2025 - The International Conference on Innovations in Applied Mathematics, Physics, and Astronomy
28

indexes can help explain possible unobserved
heterogeneity in the model.
Although charging infrastructure exerts a
statistically significant positive impact, it shows a
smaller elasticity compared to EV stock and market
share. This may be partly explained by the fact that
consumers weigh other factors (e.g., policy
incentives, vehicle cost, perceived reliability) even
more heavily when deciding on an EV purchase
(Coffman, Jaller, and Wee, 2017). Past studies in
Norway have demonstrated that targeted incentives
like free parking, road toll exemptions, and tax
benefits can greatly stimulate EV uptake, particularly
in the early stages of market development (Bjerkan,
Nørbech and Nordtømme, 2016). Therefore, a
balanced approach that combines infrastructure
deployment with well-designed demand-side policies
(e.g., tax rebates, direct subsidies) is essential for
sustaining or boosting EV sales across different
market maturity phases (Narassimhan and Johnson,
2018).
This research uses a (logarithmic) multiple linear
regression model, which can effectively reveal the
linear relationship between EV sales and core
variables but may be insufficient when exploring
more complex dynamic processes or interactive
effects. Despite offering valuable insights, the current
research omits certain variables like consumer
preference evolution, oil price fluctuations, and
vehicle resale values that could further elucidate EV
adoption dynamics. Existing studies indicate that
such factors, along with regional socio-economic
conditions, strongly mediate EV growth trajectories
(Figenbaum, 2017). Future work could broaden the
dataset to include these additional covariates, employ
panel or longitudinal models to capture time-lag
effects, and integrate qualitative methods (e.g.,
consumer surveys) for a deeper understanding of
behavioral nuances. This expanded scope may yield a
more holistic view of how public policy, consumer
sentiment, and infrastructure co-evolve in shaping the
global EV landscape.
5 CONCLUSION
In summary, this research uses a multiple linear
regression model with logarithmic transformation to
analyze and underscores that cumulative EV stock,
EV stock share, and EV sales share exert the strongest
influence on annual EV sales. The paper also
performs data visualization and checks for
multicollinearity. Notably, the positive and
significant effect of EV stock highlights how a
growing fleet fuels further market growth by
enhancing consumer awareness and confidence.
However, the negative coefficient associated with EV
stock share suggests that higher saturation levels can
dampen new sales, indicating the possibility of a
diminishing return once EVs become more
mainstream. Although charging infrastructure plays
an important role, its comparatively smaller impact
points to the complexity of consumer decisions—
where vehicle availability, supportive policies, and
market maturity can outweigh charging accessibility.
For policymakers and industry stakeholders, these
findings emphasize the importance of strategically
expanding EV stocks and aligning infrastructure
investments with demand. Doing so will help sustain
healthy sales trajectories as electric vehicles continue
evolving from an emerging segment into a well-
established cornerstone of global transportation
systems.
REFERENCES
Bjerkan, K. Y., Nørbech, T. E., & Nordtømme, M. E. 2016.
Incentives for promoting battery electric vehicle BEV
adoption in Norway. Transportation Research Part D:
Transport and Environment, 43, 169–180.
BloombergNEF. 2023. Electric vehicle outlook 2023.
about.bnef.com. https://about.bnef.com/electric-
vehicle-outlook
Chen, Z., & Chou, A. 2022. Consumer preferences range
anxiety and the adoption of electric vehicles in the
United States. Resource and Energy Economics, 67,
101266.
Coffman, M., Bernstein, P., & Wee, S. 2017. Electric
vehicles revisited costs subsidies and prospects.
Transport Policy, 54, 50–59.
Figenbaum, E. 2017. Perspectives on Norway’s
supercharged electric vehicle policy. Environmental
Innovation and Societal Transitions, 25, 14–34.
Ford, P. L. 2023. Kaggle global EV sales 2010–2024.
kaggle.com.
https://www.kaggle.com/datasets/patricklford/global-
ev-sales-2010-2024
International Energy Agency. 2022. Global EV outlook
2022. iea.org. https://www.iea.org/reports/global-ev-
outlook-2022
Jin, L., & Slowik, P. 2021. Evaluation of electric vehicle
market growth across leading regions. Transportation
Research Part D: Transport and Environment, 96,
102874.
Kang, S., & Park, Y. 2020. Assessing consumer attitudes
toward electric vehicles the role of social influence and
ecological motives. Transportation Research Part D:
Transport and Environment, 82, 102296.
Analysis of Factors Influencing Electric Vehicle Sales Based on the Multiple Linear Regression Model
29

Li, X., & Ouyang, Y. 2021. Consumer concerns about
charging infrastructure and the adoption of electric
mobility. Energy Policy, 157, 112498.
Narassimhan, E., & Johnson, C. 2018. The role of demand-
side incentives and charging infrastructure in fostering
electric vehicle adoption analysis of US States. Journal
of Transport Geography, 72, 177–187.
Sakti, A., Jaller, M., & Lee, Y. 2021. Global patterns in
electric vehicle stock growth and charging
infrastructure development. Renewable and
Sustainable Energy Reviews, 146, 111161.
Wu, T., & Zhao, L. 2021. Advances in battery technology
and the accelerating expansion of electric vehicles.
Journal of Power Sources, 485, 229292.
Yang, J., Liao, F., & van Wee, B. 2020. Analyzing the
effects of financial incentives on electric vehicle sales
and market share. Energy Policy, 145, 111752.
Zhang, X., & Lu, Y. 2020. Infrastructure readiness and EV
adoption in China. Journal of Cleaner Production, 253,
119979.
Zhou, Y., & Li, J. 2022. Economics of electric vehicle
adoption in European countries. Transportation
Research Part D: Transport and Environment, 108,
103298.
IAMPA 2025 - The International Conference on Innovations in Applied Mathematics, Physics, and Astronomy
30
