
Towards Early Detection of Mild Cognitive Impairment: Predictive
Analytics Using the Oculo-Cognitive Addition Test (OCAT)
Gaurav N. Pradhan
1,2 a
, Sarah E. Kingsbury
2b
, Michael J. Cevette
2
, Jan Stepanek
3
and Richard J. Caselli
4
1
Department of Biomedical Informatics, Mayo Clinic, Scottsdale, Arizona, U.S.A.
2
Department of Otolaryngology-Head and Neck Surgery, Division of Audiology, Mayo Clinic, Scottsdale, Arizona, U.S.A.
3
Aerospace Medicine Program, Department of Internal Medicine, Mayo Clinic, Scottsdale, Arizona, U.S.A.
4
Department of Neurology, Mayo Clinic, Scottsdale, Arizona, U.S.A.
Keywords: Mild Cognitive Impairment, Cognitive Decline, Cognitive Performance, Oculometrics, Prediction, Classification.
Abstract: Mild cognitive impairment (MCI) is often challenging to diagnose. The Oculo-Cognitive Addition Test
(OCAT) is a rapid, objective tool that measures eye movement and time-based features during mental addition
tasks in under one minute. This study aims to develop predictive machine learning algorithms for early
detection of those at greater risk for mild cognitive impairment, helping warrant further testing. OCAT testing
with integrated eye tracking was completed by 250 patients. Time-related and eye movement features were
extracted from raw gaze data. Feature selection was performed using machine learning methods, including
random forest and univariate decision trees, to identify predictors of Dementia Rating Scale (DRS) outcomes.
Supervised models—logistic regression (LR) and K-nearest neighbors (KNN)—were trained to classify MCI.
Class imbalance was addressed using the Synthetic Minority Over-sampling Technique. LR models achieved
the highest performance using the combined time and eye movement features, with an accuracy of 0.97, recall
of 0.91, and the area under the precision-recall curve (AUPRC) of 0.95. This study demonstrates that machine
learning models trained on OCAT-derived features can reliably predict DRS outcomes (PASS/FAIL), offering
a promising approach for early identification of MCI.
1 INTRODUCTION
Mild Cognitive Impairment (MCI) is a condition that
represents a transitional state between normal aging
and dementia, particularly Alzheimer’s Disease (AD)
(Anderson, 2019; Chen et al., 2021; Petersen et al.,
1999), though some cases stem from reversible
causes such as concussion, metabolic pathologies,
and psychiatric disorders (Petersen et al., 2018).
According to the 2018 American Academy of
Neurology guidelines, individuals with MCI exhibit
cognitive deficits while maintaining functional
independence in activities of daily living (Petersen et
al., 2018). Diagnostic criteria for MCI have evolved
over time – from initially emphasizing memory loss
(Petersen et al., 1999) to including impairments in
other domains such as language, visuospatial
processing, or executive skills (Chen et al., 2021;
a
https://orcid.org/0000-0002-4040-462X
b
https://orcid.org/0009-0004-3411-242X
Petersen, 2004) – reflecting the heterogeneity of its
clinical presentation.
When cognitive decline or MCI is suspected, a
comprehensive neuropsychological assessment
remains the gold standard for diagnosis (Aarsland et
al., 2009; Matteau et al., 2011). However, due to
testing time, rigor, clinical availability, and insurance
coverage, not all patients can undergo full testing. As
a validated alternative, the Mattis Dementia Rating
Scale (DRS) is frequently used to measure general
cognitive function (Matteau et al., 2011; Porto et al.,
2007). The DRS has also been validated as a short-
form test for MCI screening (Matteau et al., 2011).
Even so, this test can take as few as 15-20 minutes
with an alert, healthy individual, but can take close to
an hour for a person with advanced impairment
(Marson et al., 1997; Matteau et al., 2011).
Pradhan, G. N., Kingsbury, S. E., Cevette, M. J., Stepanek, J. and Caselli, R. J.
Towards Early Detection of Mild Cognitive Impairment: Predictive Analytics Using the Oculo-Cognitive Addition Test (OCAT).
DOI: 10.5220/0013808300004000
Paper published under CC license (CC BY-NC-ND 4.0)
In Proceedings of the 17th International Joint Conference on Knowledge Discovery, Knowledge Engineering and Knowledge Management (IC3K 2025) - Volume 1: KDIR, pages 457-464
Proceedings Copyright © 2025 by SCITEPRESS – Science and Technology Publications, Lda.
457

Given the time and resource demands of
comprehensive neuropsychological assessment, there
is a clinical need for a brief, objective screening tool
to predict a patient’s relative risk for MCI, ensuring
that those at greatest need are prioritized for further
assessment. It has been shown that patients with a
score lower than 140 on the DRS are at greater
likelihood of having MCI (Harvey & Mohs, 2001;
Mattis, 1976; Montgomery, 1982; Schmidt et al.,
1994). Note this cutoff is much higher than the
clinical psychometric threshold of 123 (Mattis, 1988).
Many neurological diseases lead to changes in eye
movements, also termed oculometrics, and these
changes have been identified as early biomarkers of
Alzheimer’s disease and related dementias (Laguna et
al., 2011; Mosimann et al., 2005). Studies have shown
that cognitive impairment can be identified by
quantifying changes in oculometric patterns such as
fixation duration, saccadic velocity, blinks, and
pupillary response (Pradhan et al., 2019; Pradhan et
al., 2018; Pradhan et al., 2022). The Oculo-Cognitive
Addition Test (OCAT) (Pradhan et al., 2024) was
designed to efficiently (< 2 minutes) assess cognitive
function (Pradhan et al., 2022) by capturing eye
movements and associated time parameters during
verbally administered mental addition tasks.
Participants are instructed to complete, as rapidly as
possible, 12 trials of summing three consecutive
numbers shown separately on three consecutive blank
screens in seemingly random positions categorized by
low, medium, and high cognitive workload,
respectively. While the location of the numbers may
appear random to the subject, OCAT consists of a
structured “infinity loop” pattern of 24 symmetrical
positions in which the numbers appear (Figure 1). By
utilizing this “infinity loop” pattern, OCAT is
inherently structured, allowing for measurement and
quantification of eye movements in horizontal,
vertical, and diagonal directions, using integrated
eye-tracking hardware, while modulating cognitive
demand through verbal addition tasks, to engage
brain areas associated with attention, working
memory, numerical representation, and oculometric
coordination (Pradhan et al., 2022). Eye movement
features measured include saccades, fixations, blinks,
and pupil dilations, which have a variety of functions
with multiple voluntary and reflexive factors (Kang
et al., 2023; Purves et al., 2001). Time-based features
recorded—such as total test time, the average time to
complete each three-number addition task (where
each number is associated with the low, medium, or
high cognitive load), and response time of following
the number on the screen also reflect cognitive
processes like attention, processing speed, and
working memory. In a proof of concept study, OCAT
demonstrated increased saccadic latency and fixation
time in a hypoxic population (Pradhan et al., 2022),
supporting its sensitivity to cognitive load.
The objective of this study was to develop
predictive machine learning models for possible mild
cognitive impairment (PMCI) identification using the
combined eye movement and time-based features
extracted from the raw gaze data during the OCAT
testing. OCAT was performed the same day as, but
prior to, neuropsychological testing which included
the DRS. It is hypothesized that with the optimal
model, the features derived from OCAT will reliably
and accurately predict DRS outcomes (PASS/FAIL).
This study represents the foundational work toward
establishing OCAT as a rapid, objective screening
tool for neurological function, with the potential to
guide further neuropsychological assessment.
Figure 1: Eye tracking data during OCAT showing the
fixations (in red) and saccadic movement (in blue).
2 METHODOLOGY
2.1 Participants
250 participants who underwent neuropsychological
testing were enrolled in this study protocol, which
was approved by the Institutional Review Board
(IRB). Subjects between 21 and 99 years of age with
normal vision (including those with correction), no
clinically significant visual impairment, and the
ability to provide consent themselves were enrolled.
Informed consent was obtained from all participants
before enrolment. All tested participants were
categorized into Cognitive Normal (CN) and Possible
Mild Cognitive Impairment (PMCI) groups,
including those with mild dementia, based on their
DRS score during clinical neuropsychological
assessment. As per the clinical standards, participants
with a DRS score of 140 or above were labelled as
CN, and those with less than 140 scores were labelled
KDIR 2025 - 17th International Conference on Knowledge Discovery and Information Retrieval
458

as PMCI (Harvey & Mohs, 2001). A portion of the
data was used to train and optimize supervised
machine learning models, while remaining data was
reserved for independent validation. Model
performance was evaluated by assessing recall,
specificity, precision, and accuracy in classifying
patients with DRS scores indicative of MCI, based on
established diagnostic thresholds (Harvey & Mohs,
2001). Participants whose eye-tracking data during
OCAT testing did not meet the predefined “tracking
ratio” threshold of 80% due to excessive signal loss,
poor eye-tracking calibration, or unstable gaze
recordings were excluded from further analysis to
ensure the reliability and validity of gaze-based
cognitive performance measurements during the
OCAT. The final distributed dataset included the
OCAT data of 206 participants, with 166 categorized
as CN class and 40 as PMCI class.
2.2 Equipment and Procedures
The OCAT testing was conducted in a quiet, climate-
controlled room. The ambient light levels were at
stable luminance and consistent throughout the data
collection. The OCAT software was installed on the
14” EyeOn Elite Windows 10 Pro tablet (EyeTech
Digital Systems, Tempe, Arizona, USA) with an
integrated eye tracking device (8MP Eye Gaze
Camera) to track eye gaze during the OCAT testing.
The resolution of the tablet screen was 1920 x 1080.
The raw eye-gaze data was collected at a sampling
rate of 120 Hz. During the study, participants were
seated facing the tablet and positioned to maintain a
viewing distance of 60 cm, a distance within the
recommended reading range. The session began with
a 5-point calibration to optimize eye-tracking
accuracy. Calibration quality was verified, and
recalibration was performed if necessary to maintain
a calibration error below 0.5 degrees. To control
potential task novelty effects, a structured preview
and practice phase were incorporated before data
acquisition. Participants first received standardized
instructions and observed a demonstration of the task.
Subsequently, an initial practice session was
conducted, during which participants completed a full
OCAT trial that allowed for task familiarization and
reduction of learning-related variability. The
subsequent OCAT trial was considered the formal
test, and only data from this test were analyzed. The
OCAT testing session was performed before any
scheduled neuropsychological testing for the
Neurology appointment to avoid any fatigue effects.
2.3 Data Processing and Feature
Extraction
The time-related features described in Table 1 were
measured during the OCAT for overall task
completion time and for each addition sequence.
Addition sequences had varying cognitive
workloads (low, medium, and high in the form of
first, second, and third number, respectively). The
raw gaze data obtained during the OCAT were pre-
processed to extract eye movement-related features.
Pre-processing involved cleaning artifacts using
filtering techniques followed by applying fixation and
saccade classification algorithms based on dispersion
thresholds (Pradhan et al., 2018). From the processed
data streams, the features related to saccades and
fixations, along with blinks and pupillary dynamics,
were computed to characterize participants’ cognitive
and oculomotor performance (Table 1). The features
listed in Table 1 were computed for each OCAT test
performed by every participant. The features
exhibiting significant deviation from a normal
distribution (skewness outside the range of -1 to 1)
were subjected to logarithmic transformation during
the data preprocessing stage. This transformation
aimed to reduce skewness and stabilize variance,
thereby improving the performance of the
classification model and predictive accuracy. It is
worth noting that, in addition to the 31 features listed
in Table 1, the age of the participants was also
included as an additional feature in the predictive
modelling.
To develop and evaluate the performance of the
machine learning models to predict the possible mild
cognitive impairment, the OCAT dataset was
randomly split into training and testing sets, with 80%
of the data used for training and the remaining 20%
reserved for testing. This stratified split ensured that
the class distribution between CN and PMCI was
preserved across both subsets, as summarized in
Table 2. To address the issue of class imbalance in the
training data, the Synthetic Minority Over-sampling
Technique (SMOTE) was applied. SMOTE generates
synthetic samples for the minority class (in this case,
PMCI class) by interpolating between existing
minority class instances, thereby improving the
model’s ability to learn discriminative patterns and
reducing bias toward the majority class. Table 3
shows the class distribution of training and testing
data after applying SMOTE.
Towards Early Detection of Mild Cognitive Impairment: Predictive Analytics Using the Oculo-Cognitive Addition Test (OCAT)
459

Table 1: Description of OCAT features categorized into
time and eye-movement related features.
Models were developed and evaluated using both
the original imbalanced dataset and a class-balanced
dataset generated through SMOTE. The training data
were standardized using the StandardScaler method
to ensure that features had zero mean and unit
variance. The fitted scaler parameters were saved and
subsequently applied to the testing dataset to maintain
consistency in feature scaling during model
evaluation.
Table 2: Class distribution of training and testing dataset
from the original, imbalanced dataset.
Classification CN Class PMCI Class
Trainin
g
dataset 135 29
Testing dataset 31 11
Table 3: Class distribution of training and testing dataset
after applying SMOTE to get an augmented, class-balanced
dataset.
Classification CN Class PMCI Class
Trainin
g
dataset 135 135
Testin
g
dataset 31 11
2.4 Feature Selection
Feature selection was conducted in a two-step process
to reduce redundancy and retain features with high
predictive value. First, highly correlated feature
groups were identified using Pearson’s correlation
coefficient, with a threshold of 0.8, consistent with
established practices for multicollinearity reduction
(Dormann et al., 2013). Each group consisted of two
or more features that exhibited mutual correlation
above this threshold. Within each group, a Random
Forest classifier was employed to assess the relative
importance of features, and only the feature with the
highest predictive importance was retained while the
others were discarded. In the second step, a univariate
evaluation of the remaining, uncorrelated features
was performed using a Decision Tree classifier. Each
feature was individually assessed based on its
Receiver Operating Characteristic - Area Under the
Curve (ROC-AUC) score. Features with ROC-AUC
scores less than or equal to 0.5 were excluded, as they
contributed no better than random performance in
classification.
Both models were trained using the pre-processed
and feature-selected dataset. Key performance
metrics including recall, precision, specificity, F1-
score, accuracy, and the area under the precision-
recall curve (AUPRC) were computed for
comprehensive assessment of predictive
performance. Figure 2 illustrates the complete
workflow of the model comprising feature extraction,
data pre-processing, feature selection, and predictive
modelling steps.
Time-related Features
1. Total Test Time (s)
2. Mean Time for Number 1 (low cognitive workload)
(s)
3. Mean Time for Number 2 (medium cognitive
workload) (s)
4. Mean Time for Number 3 (high cognitive
workload) (s)
5. (Log-) Mean Latency Time (ms)
6.
(
Lo
g
-
)
Standard Deviation of Latenc
y
Time
(
ms
)
Eye Movement-related Features
Fixations:
7. Mean Fixation Time for Number 1 (ms)
8. (Log-) Standard Deviation of Fixation Time for
Number 1 (ms)
9. Mean Fixation Size for Number 1 (mm)
10. (Log-) Standard Deviation of Fixation Size for
Number 1 (mm)
11. Mean Fixation Area for Number 1 (mm2)
12. (Log-) Standard Deviation of Fixation Area for
Number 1 (mm2)
13. Mean Fixation Time for Number 2 (ms)
14. (Log-) Standard Deviation of Fixation Time for
Number 2 (ms)
15. Mean Fixation Size for Number 2 (mm)
16. (Log-) Standard Deviation of Fixation Size for
Number 2 (mm)
17. Mean Fixation Area for Number 2 (mm2)
18. (Log-) Standard Deviation of Fixation Area for
Number 2 (mm2)
19. Mean Fixation Time for Number 3 (ms)
20. (Log-) Standard Deviation of Fixation Time for
Number 3 (ms)
21. Mean Fixation Size for Number 3 (mm)
22. (Log-) Standard Deviation of Fixation Size for
Number 3 (mm)
23. Mean Fixation Area for Number 3 (mm2)
24. (Log-) Standard Deviation of Fixation Area for
Number 3 (mm2)
Saccades:
25. Median Diagonal Saccadic Velocity (deg/s)
26. Median Horizontal Saccadic Velocity (deg/s)
27. Median Vertical Saccadic Velocity (deg/s)
Blinks:
28. Blink Rate (number of blinks per minute)
29. Median Blink Duration (ms)
Pupillary Dynamics:
30. Standard Deviation of Pupil Size (mm)
31. Coefficient of Variation of Pupil Size
KDIR 2025 - 17th International Conference on Knowledge Discovery and Information Retrieval
460

Figure 2: Workflow of the predictive modelling process.
3 RESULTS
By using OCAT testing, this study aimed to predict
whether a participant would score below 140 on the
DRS, reflecting a higher risk for the possibility of
MCI. The classification performance of Logistic
Regression (LR) and K-Nearest Neighbours (KNN)
was evaluated under both imbalanced (original) and
class-balanced (SMOTE- augmented) datasets with
different feature combinations described in Table 1.
Table 4 shows that the LR model trained on
SMOTE-balanced data containing both time-related
and eye movement-related features demonstrated
superior and consistent performance across all
metrics, achieving perfect precision (1.00),
specificity (1.00), and F1-score (0.95), with high
recall (0.91) and accuracy (0.97), indicating strong
discriminatory ability without overfitting. In contrast,
the LR model trained on the original imbalanced data
showed reduced recall (0.73 at DT = 0.45 and 0.64 at
DT = 0.5), while maintaining high specificity (0.97)
and precision (≥0.88), suggesting a bias toward the
majority cognitive normal class.
KNN also benefited from SMOTE, with the
balanced model (k = 6) yielding improved recall
(0.82) and F1-score (0.82), along with high
specificity (0.94) and AUPRC (0.95). Interestingly,
the KNN model (k = 5) with original, imbalanced
dataset achieved perfect precision (1.00) and
specificity (1.00), but at the cost of lower recall
(0.73), indicating under-identification of the minority
possibly MCI class despite overall high accuracy
(0.93). Both models show optimal performance under
the SMOTE-balanced condition, as also seen in the
precision-recall curve (Figure 3).
4 DISCUSSIONS
Multiple predictive models were developed using
time- and eye movement-based OCAT features. The
LR models trained on SMOTE-balanced datasets
consistently demonstrated the most balanced and
robust performance across all metrics. These results
highlight the utility of SMOTE in improving recall
while maintaining favorable balance between
precision and specificity. The model developed
yielded high recall, precision, specificity, F1-score,
accuracy, and AUPRC, indicating reliable predictive
power for diagnosing PMCI. This means that the
model developed is robust to false positives and
negatives. In the context of MCI screening, false
positives may lead to unnecessary patient expense
and stress, as well as provider time, but the screener
result does not definitively make the diagnosis.
Rather, it rather prompts further evaluation via DRS
or comprehensive neuropsychological assessment.
False negatives, on the other hand, pose a more
Towards Early Detection of Mild Cognitive Impairment: Predictive Analytics Using the Oculo-Cognitive Addition Test (OCAT)
461
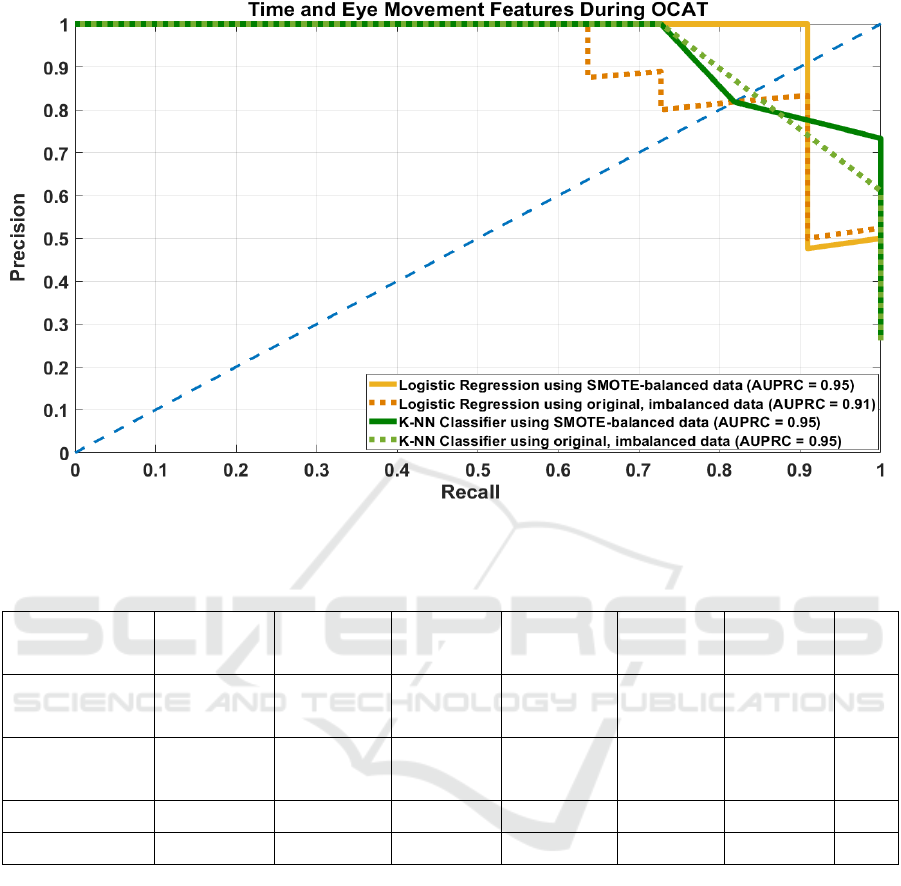
Figure 3: Precision-Recall Curve of Logistic Regression (LR) and K-Nearest Neighbors (KNN) models using both SMOTE-
augmented balanced and original, imbalanced datasets with time and eye-movement features during OCAT.
Table 4: LR and KNN model performance with SMOTE-balanced and imbalanced datasets.
Model
Hyper-
parameter
Recall Precision Specificity F1-score Accuracy AUPRC
LR – SMOTE
DT = 0.45
DT = 0.5
0.91
0.91
1
1
1
1
0.95
0.95
0.97
0.97
0.95
LR - original
DT = 0.45
DT = 0.5
0.73
0.64
0.89
0.88
0.97
0.97
0.8
0.74
0.9
0.88
0.91
KNN- SMOTE Best k = 6 0.82 0.82 0.94 0.82 0.9 0.95
KNN - original Best k = 5 0.73 1 1 0.84 0.93 0.95
serious concern in cognitive screening, since missing
the indicators of MCI when it is present could delay
timely intervention. This is particularly critical now
that there are disease modifying treatments for
Alzheimer’s disease as well as for individuals with
other causes of cognitive impairment, such as
concussions, hypoxia, vascular or metabolic
conditions (Biessels & Whitmer, 2020; Pradhan et al.,
2019)
In such cases, early identification and intervention
may facilitate cognitive recovery, or prompt
additional diagnostic measures, including
neuroimaging and further cognitive evaluation
(Biessels & Whitmer, 2020). These findings support
the continued use of OCAT with integrated eye-
tracking in clinical settings, as garnering the broader
range of cognitively relevant features improves
diagnostic accuracy and enhances the tool’s potential
for early detection of cognitive impairment. There is
broad consensus that the total health care cost could
be greatly reduced by more efficient resource
utilization as well as earlier diagnosis and
intervention for cognitive and neurological disorders,
especially when traditional clinical diagnostic tools
lack sufficient sensitivity (Laguna et al., 2011;
Mosimann et al., 2005). As a screening tool, OCAT
can help to narrow the focus of resource deployment
to those at greater risk for disease and may be
applicable to other conditions that also affect eye
movement. For example, sports-related concussion
has also been associated with oculomotor dysfunction
such as saccadic eye movements, accommodation,
KDIR 2025 - 17th International Conference on Knowledge Discovery and Information Retrieval
462

smooth pursuit (tracking), fixation, and sensitivity to
light in 90% of athletes (Ciuffreda et al., 2007).
Further refinement of LR and KNN models that use
both eye-movement and time-based features could
lead to a highly sensitive screening tool in clinical and
sideline settings where subclinical markers of
cognitive impairment can inform diagnoses.
5 CONCLUSIONS
OCAT leverages the well-established relationship
between eye movement dynamics and cognitive
function to facilitate early detection of cognitive
decline associated with MCI or other neurological
disorders, like Alzheimer’s Disease, dementias,
traumatic brain injuries, substance use, and fatigue.
By combining reflexive saccadic eye movements
with time-based and attentional effects under varying
cognitive loads, OCAT provides a multidimensional
profile of cognitive performance. As a rapid, non-
invasive assessment tool, OCAT can be seamlessly
integrated into outpatient clinics, primary care
settings, and neurology practices. Its use as an initial
screening tool may assist clinicians in identifying
patients who would benefit from more extensive
evaluations, such as full-extent DRS testing,
ultimately conserving time, reducing medical and
insurance burdens. With further refinement and
dissemination, OCAT could serve as a standardized
intake instrument for both preliminary assessment
and longitudinal tracking of cognitive state. By
featuring OCAT into routine assessments, healthcare
providers can enhance early detection, streamline
cognitive evaluations, and improve patient outcomes
to reduce healthcare costs.
REFERENCES
Aarsland, D., Brønnick, K., Larsen, J., Tysnes, O., & Alves,
G. (2009). Cognitive impairment in incident, untreated
Parkinson disease. Neurology, 72(13), 1121-1126.
Anderson, N. (2019). State of the science on mild cognitive
impairment (MCI). CNS Spectrums, 24, 78-87.
Biessels, G., & Whitmer, R. (2020). Cognitive dysfunction
in diabetes: How to implement emerging guidelines.
Diabetologia, 63, 3-9.
Chen, Y., Liang, N., Li, X., Yang, S., Wang, Y., & Shi, N.
(2021). Diagnosis and treatment for mild cognitive
impairment: A systematic review of clinical practice
guidelines and consensus statements. Front Neurol, 12.
Ciuffreda, K., Kapoor, N., Rutner, D., Suchoff, I., Han, M.,
& Craig, S. (2007). Occurrence of oculomotor
dysfunctions in acquired brain injury: A retrospective
analysis. Optometry, 78(4), 155-161.
Dormann, C. F., Elith, J., Bacher, S., Buchmann, C., Carl,
G., Carré, G., Marquéz, J. R. G., Gruber, B.,
Lafourcade, B., Leitão, P. J., Münkemüller, T.,
McClean, C., Osborne, P. E., Reineking, B., Schröder,
B., Skidmore, A. K., Zurell, D., & Lautenbach, S.
(2013). Collinearity: a review of methods to deal with
it and a simulation study evaluating their performance.
Ecography, 36(1), 27-46. https://doi.org/https://
doi.org/10.1111/j.1600-0587.2012.07348.x
Harvey, P., & Mohs, R. (2001). Memory Changes with
Aging and Dementia. In P. Hof & C. Mobbs (Eds.),
Functional Neurobiology of Aging (Vol. 1, pp. 53-61).
Academic Press.
Kang, J., Lee, S., Kim, J., & Oh, S. (2023). Recording and
interpretation of ocular movements: Saccades, smooth
pursuit, and optokinetic nystagmus. Annals of Clinical
Neurophysiology, 25(2), 55-65.
Laguna, D., Manzanares, C., Zola, M., Buffalo, E., &
Agichtein, E. (2011). Detecting cognitive impairment
by eye movement analysis using automatic
classification algorithms. Journal of Neuroscience
Methods, 201, 196-203.
Marson, D., Dymek, M., Duke, L., & Harrell, L. (1997).
Subscale validity of the Mattis Dementia Rating Scale.
Archives of Clinical Neuropsychology, 12(3), 269-275.
Matteau, E., Dupre, N., Langlois, M., Jean, L., Thivierge,
S., Provencher, P., & Simard, M. (2011). Mattis
Dementia Rating Scale 2: Screening for MCI and
dementia. American Journal of Alzheimer's Disease &
Other Dementias, 26(5), 389-398.
Mattis, S. (1976). Mental Status Examination for Organic
Mental Syndrome in the Elderly Patient. In L. Bellak &
T. Karasu (Eds.), Geriatric Psychiatry. A Handbook for
Psychiatrists and Primary Care Physicians (pp. 77-
121). Grune & Stratton.
Mattis, S. (1988). Dementia Rating Scale: Professional
Manual. Psychological Assessment Resources.
Montgomery, K. (1982). A normative study of
neuropsychological test performance of a normal
elderly sample University of Victoria]. BC, Canada.
Mosimann, U., Müri, R., Burn, D., Felblinger, J., O'Brien,
J., & McKeith, I. (2005). Saccadic eye movement
changes in Parkinson's disease dementia and dementia
with Lewy bodies. Brain, 128, 1267-1276.
Petersen, R. (2004). Mild cognitive impairment as a
diagnostic entity. Journal of International Medicine,
256, 183-194.
Petersen, R., Lopez, O., Armstrong, M., Getchius, T.,
Ganguli, M., Gloss, D., Gronseth, G., Marson, D.,
Pringsheim, T., Day, G., Sager, M., Stevens, J., & Rae-
Grant, A. (2018). Practice guideline update summary:
Mild cognitive impairment. Report of the Guideline
Development, Dissemination, and Implementation
Subcommittee of the American Academy of
Neurology. Neurology, 90(3).
Petersen, R., Smith, G., Waring, S., Ivnik, R., Tangalos, E.,
& Kokmen, E. (1999). Mild cognitive impairment:
Towards Early Detection of Mild Cognitive Impairment: Predictive Analytics Using the Oculo-Cognitive Addition Test (OCAT)
463

Clinical characterization and outcome. Arch Neurol, 56,
303-308.
Porto, C., Caramelli, P., & Nitrini, R. (2007). The Dementia
Rating Scale (DRS) in the diagnosis of vascular
dementia. Dementia & Neuropsychologia, 3, 282-287.
Pradhan, G., Bogle, J., Cevette, M., & Stepanek, J. (2019).
Discovering oculometric patterns to detect cognitive
performance changes in healthy youth football athletes.
Journal of Healthcare Informatics Research, 3, 371-
392.
Pradhan, G., Bogle, J., Kleindienst, S., Cevette, M., &
Stepanek, J. (2018). Correlating multi-dimensional
oculometrics with cognitive performance in healthy
young adults. J Healthc Inform Res, 2, 132-151.
https://doi.org/https://doi.org/10.1007/s41666-017-
0011-8
Pradhan, G., Cevette, M., Stepanek, J., & Brookler, K.
(2024). Oculo-Cognitive Addition Testing (United
States of America Patent No. US 11,869,386 B2). U. S.
P. a. T. Office.
Pradhan, G., Hagen, K., Cevette, M., & Stepanek, J. (2022).
Oculo-Cognitive Addition Test: Quantifying Cognitive
Performance During Variable Cognitive Workload
Through Eye Movement Features 2022 IEEE 10th
International Conference on Healthcare Informatics
(ICHI)
Purves, D., Augustine, G., Fitzpatrick, D., Katz, L.,
LaMantia, A., McNamara, J., Williams, S., & (editors).
(2001). Types of eye movements and their functions. In
D. Purves, G. Augustine, D. Fitzpatrick, L. Katz, A.
LaMantia, J. McNamara, & S. Williams (Eds.),
Neuroscience. Sinauer Associates.
Schmidt, R., Friedl, W., Fazekas, F., Reinhart, B.,
Grieshofer, P., Koch, M., Eber, B., Schumacher, M.,
Polmin, K., & Lechner, H. (1994). The Mattis
Dementia Rating Scale: Normative data from 1,001
healthy volunteers. Neurology, 44, 964-966.
KDIR 2025 - 17th International Conference on Knowledge Discovery and Information Retrieval
464
