
From Data to Warnings: Challenges in Building
in-Vehicle Data-Driven Hazard Warning Systems
Alexander Stocker
a
and Gerald Musser
b
Virtual Vehicle Research, Inffeldgasse 21a, Graz, Austria
Keywords: Data-Driven Services, Driver Warning Systems, in-Vehicle Hazard Alerts, Risk Modelling.
Abstract: Data offers a strong potential for advanced, data-driven services such as in-vehicle hazard warning systems.
As data spaces and ecosystems mature, access to relevant assets for these applications will grow. This paper
reviews the state of driver warning and reports on a project that developed a prototypical data-driven hazard
warning system to alert drivers to potential route dangers. We present its architecture and key implementation
challenges, including backend event generation, frontend warning mechanisms, data availability and
integration, transformation of heterogeneous inputs into actionable warnings, definition of warning logics,
handling of data validity and expiration, and human factors such as modality and user acceptance. By
addressing these challenges through our prototype, the paper highlights technical and systemic requirements
for dependable, data-driven warning applications in the evolving mobility data ecosystem.
1 INTRODUCTION AND
MOTIVATION
The rapid digitalization of mobility and transport is
generating vast amounts of data (Möller et al., 2024),
now a key asset for stakeholders. This data enables
new services (Zambetti et al., 2021) and business
models (Stocker et al., 2024), as the automotive
industry shifts from viewing vehicles as standalone
products to connected ecosystem components
(Nischak & Hanelt, 2019). This evolution supports
data-driven, software-defined vehicles (Sterk et al.,
2024; Otto et al., 2025) and services such as driver
warning systems, especially when vehicle data is
combined with contextual information and integrated
into driver-facing systems (Kaiser et al., 2018, 2021).
Driver warning systems (Driver et al., 2021), a
subclass of advanced driver assistance systems
(ADAS), aim to enhance safety and situational
awareness (Schömig & Metz, 2013). They include
collision and lane departure warnings, blind spot
detection (Kashevnik et al., 2021), drowsiness
monitoring, speed and sign recognition, pedestrian
and cyclist alerts, and hazard warnings.
a
https://orcid.org/0000-0002-3758-1617
b
https://orcid.org/0009-0005-6006-588X
In this paper, we focus on hazard warning systems
(Xu et al., 2024; Ryder et al., 2016), a category of
driver warning systems designed to alert drivers to
emerging dangers based on external data and risk-
relevant information. Such data may include weather
conditions, accident hotspots, or signals from other
vehicles (e.g., distracted drivers or stability control
activation on slippery roads). We present the
architectural design of our data-driven, in-vehicle
hazard warning system and analyse key
implementation challenges.
Despite advances in automated driving (Ebinger
et al., 2024), driver warning systems remain essential
(European Commission, 2025), as human drivers will
continue to bear responsibility for vehicle operation
(Stocker, 2025).
Our contribution offers insights into developing
data-driven hazard warning systems, relevant for
researchers, developers, and practitioners. The paper
is structured as follows: Section 2 reviews the state of
the art, Section 3 details our approach and
architecture, Section 4 discusses implementation
challenges, and Section 5 presents results, limitations,
and an outlook for future research.
236
Stocker, A. and Musser, G.
From Data to Warnings: Challenges in Building in-Vehicle Data-Driven Hazard Warning Systems.
DOI: 10.5220/0013802500003985
Paper published under CC license (CC BY-NC-ND 4.0)
In Proceedings of the 21st International Conference on Web Information Systems and Technologies (WEBIST 2025), pages 236-243
ISBN: 978-989-758-772-6; ISSN: 2184-3252
Proceedings Copyright © 2025 by SCITEPRESS – Science and Technology Publications, Lda.

2 RELATED WORK
2.1 Driver Warning Systems
The driver remains a central factor in road safety and
a leading cause of accidents, with human errors such
as speeding and risky driving (Sagberg et al., 2015;
Kaiser et al., 2020), distraction (Regan et al., 2011),
and misjudgement (Paker et al., 1995) contributing
significantly. Driver warning systems address these
risks by providing timely alerts to enhance awareness
and support safer decisions.
As a subclass of driver assistance systems
(Bengler et al., 2014), warning systems aim to prevent
accidents by alerting rather than taking control.
Examples include collision warnings (Jameson et al.,
2008), lane departure warnings (Chen et al., 2020),
blind spot detection (Liu et al., 2017), and drowsiness
monitoring (Kashevnik et al., 2021). Other functions
include speed limit and sign recognition, as well as
pedestrian or cyclist alerts.
A key category is hazard warning systems (Xu et
al., 2024; Ryder et al., 2016), which detect
unexpected dangers like slippery roads, stationary
vehicles, or accident hotspots (Ryder et al., 2016).
Unlike traditional sensor-based systems, these
increasingly integrate external data from vehicles,
infrastructure, or cloud services, providing broader
situational awareness. By combining vehicle and
contextual data (Kaiser et al., 2018; Stocker et al.,
2013), hazard warning systems enable earlier,
proactive responses in complex traffic environments.
2.2 Factors Influencing Driving Safety
Driving safety is shaped by three categories:
individual, route-related, and environmental factors.
Individual factors involve the driver’s state (Regan et
al., 2011) and behaviour (Sagberg et al., 2015),
including distraction, fatigue (Young et al., 2007),
emotions, impairments (e.g., alcohol, medication),
and risky driving. Route-related factors concern road
characteristics (Intini et al., 2019; Bogenreif et al.,
2012) such as layout, surface condition, signage,
traffic density, and temporary hazards.
Environmental factors include weather, lighting,
visibility, other road users, and unexpected events
(Maze et al., 2006; Malin et al., 2019).
Human behaviour is the dominant cause of
accidents, accounting for over 70% of cases
(McCarty & Kim, 2024). Risky actions such as
speeding or aggressive manoeuvres directly
contribute to crashes (Osafune et al., 2017), with
young drivers (16–25) particularly vulnerable due to
higher risk-taking (Jonah, 1986). Sagberg et al.
(2015) propose a framework to better classify such
driving styles.
Weather is another critical influence: snowstorms,
low visibility, and wind increase accident risks (Maze
et al., 2006), while rainfall and temperature also
correlate with crash likelihood (Bergel-Hayat et al.,
2013; Malin et al., 2019). However, some datasets
suggest weather is not always significant
(Theofilatos, 2017). Road geometry also matters,
including curvature, lane width, shoulders, and
pavement. Narrow lanes, poor surfaces, and complex
layouts are linked to higher crash risk (Rengarasu et
al., 2009), with curves or bends especially hazardous
(Bogenreif et al., 2012; Dantas et al., 2007).
3 SYSTEM ARCHITECTURE
AND APPROACH
In this section, we present the architecture of our in-
vehicle, data-driven hazard warning system (Figure 1
and 2), designed to alert drivers to potential dangers.
The architecture follows a generic, technology-
agnostic design for broad applicability. After this
overview, Section 4 discusses implementation
challenges and prototype-specific design decisions.
Our driver warning system operates as follows: an
in-vehicle client (edge component) computes a Geo-
Spatial Key (GSK) from the vehicle’s position and
speed, transmitting it to the central hazard warning
platform. The platform queries internal and external
data sources for relevant safety events, which are then
cleaned, consolidated, enriched, and sent back to the
client. The client compares this data with real-time
driving conditions (e.g., position, speed, heading)
and, if risk is detected, triggers a warning—adaptable
to driver preferences. As the vehicle reaches the
boundary of a GSK, a new one is generated, and the
process repeats. The following subsections describe
each system component (Figure 1).
3.1 In-Vehicle Client
The in-vehicle client, such as a smartphone app or
embedded infotainment application, serves as the
driver’s interface to the hazard warning platform. It
fulfils three main roles: (1) providing the user
interface for login, warning configuration, and
connectivity, while delivering warnings visually,
acoustically, or haptically; (2) acting as an edge-
computing node that evaluates received events
against real-time driving conditions to decide whether
From Data to Warnings: Challenges in Building in-Vehicle Data-Driven Hazard Warning Systems
237
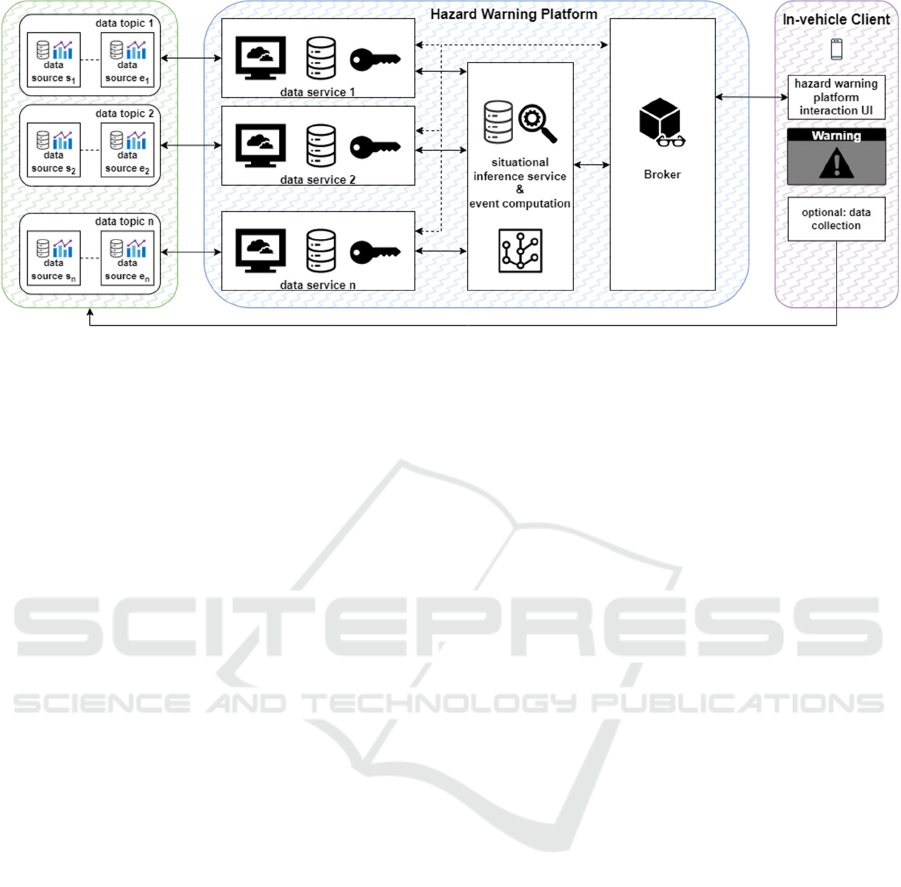
Figure 1: System Architecture.
to issue a warning; and (3) serving as a data source by
sending safety-relevant events or issued warnings
back to the platform, supporting the refinement of
driving risk models..
3.2 Data Source and Data Topic
A data source is any device or service providing
safety-relevant information, such as in-vehicle
sensors, data from other vehicles, third-party weather
services, or government accident statistics. Since
sources often lie outside the core platform and may
incur access costs, minimizing requests is essential.
The platform must also remain flexible to integrate
new feeds or retire obsolete ones.
A data topic, by contrast, is a logical grouping of
related sources (e.g., all weather feeds). While not
physical components, topics simplify management,
querying, and aggregation of multiple feeds on the
same subject.
3.3 Data Service
A data service encapsulates a single data topic,
providing a unified interface to all its underlying
sources. Each topic has exactly one data service,
making it a core platform component. When queried
with a Geo-Spatial Key (GSK), it returns relevant
events, re-indexing incoming data and merging
overlapping or redundant feeds for consistency.
The service also maintains a local cache of
incoming data (e.g., weather), reducing repeated
external calls, improving response times, and
abstracting the complexity of heterogeneous sources.
By normalizing, deduplicating, and caching feeds, it
ensures higher-level components can access
harmonized, up-to-date data without handling source-
specific idiosyncrasies.
3.4 Situational Inference and Event
Computation Service
This service is the core component, assembling and
refining all relevant events for a given Geo-Spatial
Key (GSK). It queries all data services to retrieve
their event collections, then reconciles cross-topic
conflicts to produce a unified dataset.
Expert-defined rules are applied to infer
additional risk-relevant events and enrich existing
ones. For instance, a sharp curve may be considered
more hazardous in rain or snow, generating a
composite event with a condition-specific safe speed.
The service outputs a consolidated set of observed
and inferred events, ready for transmission to the in-
vehicle client.
3.5 Broker
The Broker acts as the communication hub between
the platform and the in-vehicle clients. As a core
component of the system, it manages and maintains
client connections, receives Geo-Spatial Keys
(GSKs) transmitted by the clients, and ensures that
the corresponding sets of computed events are
reliably routed back to the appropriate originating
vehicles.
By handling message coordination and delivery,
the broker enables timely, bidirectional
communication between the edge and backend
components of the hazard warning system.
WEBIST 2025 - 21st International Conference on Web Information Systems and Technologies
238

4 IMPLEMENTATION
CHALLENGES
4.1 Backend and Event Generation
A major implementation challenge is ensuring that all
data services can process and respond to queries
within a bounded, fast timeframe, allowing the
system to generate timely and relevant warnings for
the driver. This requires orchestrating asynchronous
requests, efficient data retrieval and caching, and
robust timeout mechanisms to handle slower or
temporarily unavailable sources.
In our prototype, multiple independent data
services run in Docker containers, including external
weather data, vehicle crash and traffic data, accident
hotspots, harsh braking, and road geometry. The
event inference service queries these services within
a defined GSK (currently 4 km²), allocating about
20 seconds per service and one second for final
merging. Related events, such as curves combined
with adverse weather, are merged into single,
meaningful events with safe speed recommendations,
improving warning coherence while reducing event
volume.
Importantly, highly relevant information—like
weather—must not be filtered out, as it can serve both
as standalone spatial events or as context for other
warnings, enabling early alerts for drivers in
hazardous conditions such as snow, ice, or heavy
precipitation.
4.2 Frontend and Warning Mechanism
A major implementation challenge lies in designing
how data is accessed, processed, and transformed into
actionable warning events that reach drivers in a
timely manner. While drivers expect prompt alerts to
react appropriately to potential hazards in near to real-
time, the reality is that not all relevant data may be
immediately available to generate such warnings.
Additionally, low or unstable internet connectivity
can further delay data transmission to the vehicle.
To address the challenge of timely and reliable
driver warnings under variable connectivity and data
availability, we implemented a two-step mechanism.
Warning-relevant events are first generated on the
server side using a Geo-Spatial Key (GSK), which
defines a broader area of potential relevance. These
events are then validated on the in-vehicle client
using a driving corridor-based mechanism that
focuses on the vehicle’s real-time trajectory. This
dual architecture is shown in figure 2 and balances
data efficiency, connectivity limitations, and warning
relevance.
In our prototypical implementation, the GSK is
represented as a configurable square region (in our
case currently a 4 km² area) surrounding the vehicle’s
current GPS position. The in-vehicle client sends a
GSK to the server, which queries all relevant data
services for potential warning events in that area.
Aggregated warning events are returned and cached
locally on the in-vehicle client for low-latency access.
On the client side, a dynamic driving corridor is
constructed as a triangle aligned with the vehicle’s
position, speed, and heading. This corridor is used to
filter the cached events in real time. If a relevant event
falls within this corridor, and certain local conditions
are fulfilled (e.g. vehicle speed is above a threshold
for a particular event), a warning is issued.
To ensure uninterrupted service, the in-vehicle
client proactively requests data for the next GSK
region before exiting the current one, allowing
seamless preloading of warning events. Key
parameters - including GSK size, driving corridor
geometry, and update intervals - are configurable to
support different operational scenarios and allow
more frequent updates in high-risk areas, such as
during evolving weather conditions or traffic
incidents.
4.3 Availability and Use of Data
Accessing relevant data for driver warning is
challenging, and a key implementation issue is how
to use limited, costly sources efficiently to generate
timely, actionable warnings. Queries to third-party
data, such as weather or vehicle telemetry, must be
minimized to reduce cost while ensuring relevant
events are delivered to the vehicle.
In our prototype, weather data is collected from
100 spatially distributed points across a defined
driving region, each treated as a virtual weather
station representing localized conditions including
precipitation, temperature, wind, visibility, and
severe weather alerts.
Vehicle telemetry is ingested in real time via a
Kafka-based stream from a connected vehicle data
marketplace, providing position data and risk-
relevant events such as crash detections or activation
of safety systems like ABS or ESP. The incoming
streams are filtered and cached for rapid access by the
event inference service, allowing enrichment,
merging, or generation of new hazard events.
In addition, historical vehicle trip data is
leveraged to generate curve information, including
radius and maximum recommended safe speeds
From Data to Warnings: Challenges in Building in-Vehicle Data-Driven Hazard Warning Systems
239

under various surface conditions. Sudden braking
events are clustered to identify brake hotspots, while
historical accident data is clustered to define accident
hotspots. These dedicated data services, together with
the curve data service, enrich the platform with both
real-time and context-aware, locally derived insights,
supporting more accurate and actionable hazard
warnings for drivers.
4.4 Event Data Processing: Balancing
Between Server and Client
Another key implementation challenge is deciding
where data processing should take place—on the
server or in the in-vehicle client—and how warning
events should be structured and delivered. This
requires careful coordination of data availability and
timing to ensure the system remains performant,
fault-tolerant, and capable of generating warnings
even if certain data services are temporarily
unavailable. Balancing the division of labor between
platform and client is critical for maintaining
responsiveness, reliability, and overall system
robustness.
A typical scenario illustrates this approach:
warning a driver approaching a curvy curve too
quickly during adverse weather. The server
independently queries weather and curve data, then
combines them to adjust the recommended safe
speeds for each curve under current conditions, such
as lowering speeds due to rain. These updated curve
events are sent to the in-vehicle client, which
continuously monitors the vehicle’s speed, position,
and driving corridor. If the vehicle exceeds the safe
speed for the curve and weather conditions, a warning
is issued.
Decision-making is distributed across
components based on data availability. The in-vehicle
client has access to real-time vehicle data, enabling it
to infer higher-level events, such as hazardous driving
behavior, locally. Meanwhile, external data like
weather, accident hotspots, or icy road conditions can
be processed server-side and either merged with
curve data or issued as standalone warnings. This
distributed approach ensures warnings are timely,
context-aware, and resilient to delays or temporary
unavailability of individual data services.
4.5 Warning Logics Defined by Experts
Many types of meaningful warnings can, in principle,
be generated using existing data sources—ranging
from infrastructure and weather information to real-
time vehicle telemetry—as well as future sources. A
key challenge is translating these diverse data points
into effective warnings, designing logic that converts
raw data into actionable, context-aware alerts without
causing overload or false alarms. This requires robust
methods and algorithms capable of interpreting
heterogeneous inputs and triggering clear messages
that enhance driver awareness and safety.
In our prototype, we focused on relatively simple
warning logics to validate core functionality. Experts
initially create “warning stories,” fictional but
plausible hazardous events at specific locations—
such as distracted drivers or high-risk intersections—
which serve as a foundation for designing and testing
alert logic in real-world or simulated scenarios.
For example, a warning for drivers approaching a
tight curve too fast under adverse weather merges
static road geometry (curve radius and location),
dynamic weather data (rain or snow), and real-time
vehicle speed to determine if a warning is necessary.
General weather-based alerts, like icy road warnings,
are implemented using geographic overlays. If
historical accident data or real-time vehicle signals—
such as ESP activation, distraction, or an ongoing
accident—are present, the hazard level increases, but
even a single additional risk signal may suffice to
classify the curve as hazardous.
The central challenge is designing hazard logic
flexible enough to incorporate a broad, dynamic
range of input signals, both historical and real-time,
without relying on a fixed rule set. At the same time,
the system must generate meaningful warnings even
with limited data, e.g., using only curve geometry or
weather, while remaining robust against false
positives. Balancing richness and robustness requires
careful, data-aware design of event fusion and
decision logic, supported by heuristics and expert
knowledge, to weigh signals and determine urgency
and warning necessity.
4.6 Data and Event Invalidation
Another key implementation challenge is the
handling of data and event invalidation. Not all
safety-relevant data remains valid indefinitely:
Weather conditions evolve, distraction events are
transient, and incidents such as accidents or
roadworks have limited temporal and spatial
relevance. The system must therefore continuously
assess the validity period of each event and ensure
that outdated or no longer applicable information is
removed or updated in a timely manner to avoid
misleading or unnecessary warnings.
In our current prototype, many events span the full
duration of the evaluation period and are derived from
WEBIST 2025 - 21st International Conference on Web Information Systems and Technologies
240
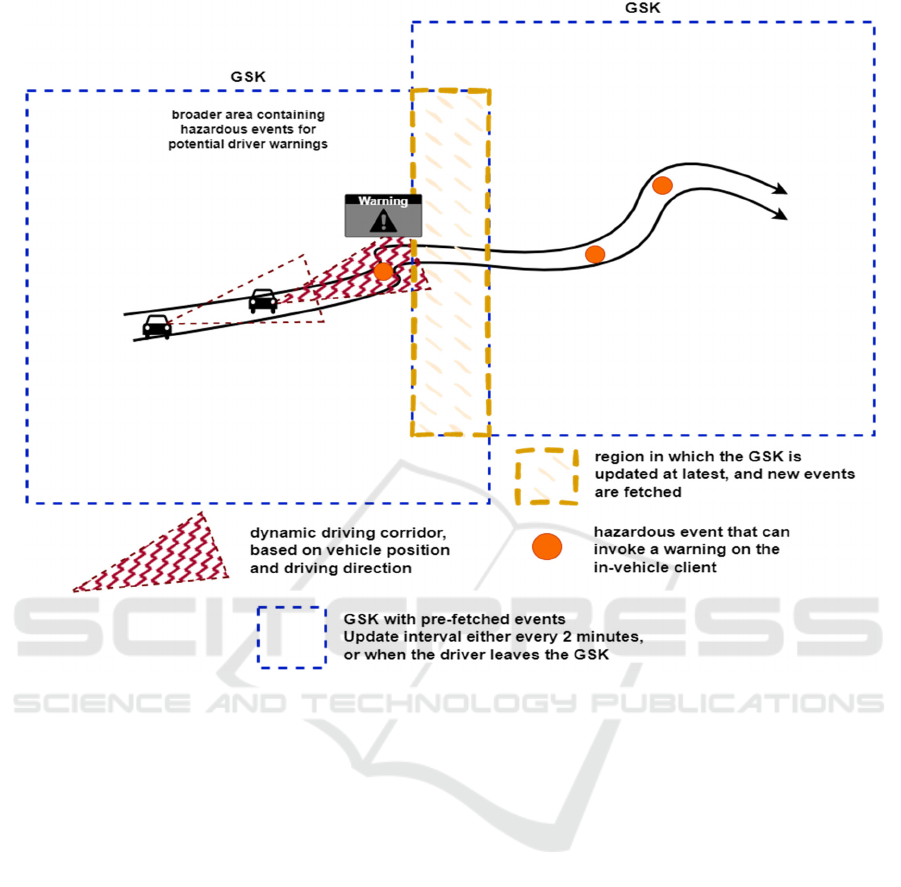
Figure 2: GSK, Driving Corridor, Hazardous events and warnings.
historical datasets, explicit deletion or expiration has
not been required. However, for few dynamic data
types such as weather and vehicle-related events, we
have implemented basic invalidation strategies.
Weather data is refreshed hourly, while vehicle-
related events are streamed continuously. Events
from the vehicle stream are cached in a database for
the data service and invalidated after a maximum of
two hours, ensuring that only recent, potentially
relevant incidents are retained for warning evaluation.
4.7 Human Factor: Vehicle Integration
and Warning Modality
As the platform scales, handling more data sources or
time-sensitive use cases like real-time driver
distraction detection, effective data and event
invalidation becomes crucial. One approach is to
timestamp each event and assign a type-specific
validity period after which it’s excluded from
processing. While simple in concept, choosing
appropriate expiration intervals is challenging. For
instance, a distraction alert may be valid for seconds,
weather data for up to an hour, while events like road
construction lack predictable durations, requiring
adaptive or manual invalidation strategies.
Another key implementation challenge is how to
integrate the warning mechanism into the vehicle in a
way that does not distract the driver. The system must
alert drivers to hazards while minimizing cognitive
load and avoiding any increase in distraction.
This implementation challenge involves deciding
whether to use a mounted smartphone or integrate the
system into the in-vehicle infotainment system, as
well as determining the most effective modality for
delivering warnings, visual, acoustic, haptic, or a
combination. The challenge lies in striking a balance
between providing timely and relevant information
and ensuring the warning mechanism remains subtle
and non-intrusive, so that it genuinely improves
safety rather than undermines it.
For simplicity, our prototype uses a smartphone as
the in-vehicle client, displaying visual warnings via
an on-screen triangle and brief message. We also
explored integration as an Android Automotive OS
From Data to Warnings: Challenges in Building in-Vehicle Data-Driven Hazard Warning Systems
241

(AAOS) app to show alerts within the infotainment
system. To reduce distraction, we considered
alternative modalities like ambient lighting, haptic
feedback (e.g., steering wheel vibrations), or audio
cues, leveraging in-vehicle actuators for more
intuitive driver alerts.
5 DISCUSSION & CONCLUSION
We introduced hazard warning as a category of driver
warning systems, presented our architectural and
procedural approach, and discussed the
implementation challenges and solutions in our
prototypical system. We acknowledge several
limitations: the system is a prototype and not a fully
operational solution with guaranteed availability or
formal service-level agreements.
Our prototype is tailored for rural areas and not
yet optimized for urban settings, where limited
positioning precision and overlapping events near
intersections or roundabouts make hazard detection
more challenging. Highways and urban roads also
require wider driving corridors for timely warnings at
higher speeds, increasing the risk of false positives.
Connectivity gaps, such as long tunnels or areas with
poor internet, can cause update failures. Large update
areas (GSKs) add computational overhead, increase
data transfer, and lengthen update intervals, reducing
the accuracy and timeliness of soft real-time
warnings. The system is intended as a driver-
assistance or comfort feature rather than a safety-
critical component. Barriers to large-scale
deployment include high costs of accessing and
licensing diverse data sources, which require
continuous streaming and high-volume API requests
for many connected vehicles. Privacy is also a key
concern (Lechte et al., 2023): the in-vehicle client
transmits only a generalized Geo-Spatial Key (GSK),
with no speed or direction data sent to the backend.
GSKs are cached temporarily and processed locally,
and all speed and direction computations occur within
the vehicle. This privacy-by-design approach
minimizes transmitted PII and ensures sensitive data
remains within the vehicle.
In conclusion, we presented the architecture and
workflow of a data-driven, in-vehicle hazard warning
system. Our prototype highlighted key challenges,
including data acquisition, integration, real-time
processing, warning logic, and client-side evaluation.
These insights guide researchers and offer practical
value for automotive OEMs and Tier-1 suppliers.
Unlike commercial solutions focused on static events,
our approach demonstrates how dynamic,
situationally enriched warnings can better enhance
driver awareness and road safety.
ACKNOWLEDGEMENTS
This work was supported by European Commission
under the Promoting and Incentivising Federated,
Trusted, and Fair Sharing and Trading of
Interoperable Data Assets (PISTIS) Project under
Grant 101093016.
REFERENCES
Bengler K, Dietmayer K, Farber B, Maurer M, Stiller C,
Winner H. Three decades of driver assistance systems:
Review and future perspectives. IEEE Intelligent
transportation systems magazine. 2014 Oct 24;6(4):6-
22.
Bergel-Hayat, R., Debbarh, M., Antoniou, C., & Yannis, G.
(2013). Explaining the road accident risk: Weather
effects. Accident Analysis & Prevention, 60, 456-465.
Bogenreif, C., Souleyrette, R. R., & Hans, Z. (2012).
Identifying and measuring horizontal curves and related
effects on highway safety. Journal of Transportation
Safety & Security, 4(3), 179-192.
Chen, W., Wang, W., Wang, K., Li, Z., Li, H., & Liu, S.
(2020). Lane departure warning systems and lane line
detection methods based on image processing and
semantic segmentation: A review. Journal of traffic and
transportation engineering (English edition), 7(6), 748-
774.
Dantas, A., Fowler, M., & Koorey, G. (2007). Effect of road
network bendiness on traffic crash occurrence.
Transportation Research Part B: Methodological,
Volume 117, Part A, November 2018, Pages 101-116
Ebinger, N., Neuhuber, N., Moser, J., Trösterer, S., &
Stocker, A. (2024). Which partially automated driving
function do drivers prefer? Results from two field
studies on public highways. Transportation
Engineering, 17, 100236.
European Commission (2024), https://single-market-
economy.ec.europa.eu/sectors/automotive-
industry/vehicle-safety-and-automatedconnected-
vehicles_en, accessed 30.06.2025.
Intini, P., Colonna, P., & Ryeng, E. O. (2019). Route
familiarity in road safety: A literature review and an
identification proposal. Transportation research part F:
traffic psychology and behaviour, 62, 651-671.
Jonah, B. A. (1986). Accident risk and risk-taking
behaviour among young drivers. Accident Analysis &
Prevention, 18(4), 255-271.
Jamson, A. H., Lai, F. C., & Carsten, O. M. (2008).
Potential benefits of an adaptive forward collision
warning system. Transportation research part C:
emerging technologies, 16(4), 471-484.
WEBIST 2025 - 21st International Conference on Web Information Systems and Technologies
242

Kaiser, C., Stocker, A., Festl, A., Lechner, G., & Fellmann,
M. (2018). A research agenda for vehicle information
systems.
Kaiser, C., Festl, A., Pucher, G., Fellmann, M., & Stocker,
A. (2019, September). The Vehicle Data Value Chain
as a Lightweight Model to Describe Digital Vehicle
Services. In WEBIST (pp. 68-79).
Kaiser, C., Stocker, A., Festl, A., Djokic-Petrovic, M.,
Papatheocharous, E., Wallberg, A., ... & Fellmann, M.
(2020, May). A Vehicle Telematics Service for Driving
Style Detection: Implementation and Privacy
Challenges. In VEHITS (pp. 29-36).
Kaiser, C., Stocker, A., Viscusi, G., Fellmann, M., &
Richter, A. (2021). Conceptualising value creation in
data-driven services: The case of vehicle data.
International Journal of Information Management, 59,
102335.
Kashevnik, A., Shchedrin, R., Kaiser, C., & Stocker, A.
(2021). Driver distraction detection methods: A
literature review and framework. IEEE Access, 9,
60063-60076.
Lechte, H., Menck, J. H. D., Stocker, A., Lembcke, T. B.,
& Kolbe, L. M. (2023, May). Exploring threat-specific
privacy assurances in the context of connected vehicle
applications. In European Conference on Information
Systems: ECIS 2023.
Liu, G., Wang, L., & Zou, S. (2017, March). A radar-based
blind spot detection and warning system for driver
assistance. In 2017 IEEE 2nd Advanced Information
Technology, Electronic and Automation Control
Conference (IAEAC) (pp. 2204-2208). IEEE.
Malin, F., Norros, I., & Innamaa, S. (2019). Accident risk
of road and weather conditions on different road types.
Accident Analysis & Prevention, 122, 181-188.
Maze, T. H., Agarwal, M., & Burchett, G. (2006). Whether
weather matters to traffic demand, traffic safety, and
traffic operations and flow. Transportation research
record, 1948(1), 170-176.
McCarty, D., & Kim, H. W. (2024). Risky behaviors and
road safety: An exploration of age and gender
influences on road accident rates. PLoS one, 19(1),
e0296663.
Möller, F., Jussen, I., Springer, V., Gieß, A., Schweihoff,
J.C., Gelhaar, J., Guggenberger, T. and Otto, B., 2024.
Industrial data ecosystems and data spaces. Electronic
Markets, 34(1), p.41.
Nischak F, Hanelt A. (2019). Ecosystem change in the era
of digital innovation–A longitudinal analysis and
visualization of the automotive ecosystem.
International Conference on Information Systems.
Parker D, Reason JT, Manstead AS, Stradling SG. Driving
errors, driving violations and accident involvement.
Ergonomics. 1995 May 1;38(5):1036-48.
Osafune, T., Takahashi, T., Kiyama, N., Sobue, T.,
Yamaguchi, H., & Higashino, T. (2017). Analysis of
accident risks from driving behaviors. International
journal of intelligent transportation systems research,
15, 192-202.
Otto, S., Wlcek, M., & Wortmann, F. (2025). Towards
Conceptualizing Software-Defined Vehicles: A
Systematic Review and Future Research Avenues.
European Conference on Information Systems.
Regan, M. A., Hallett, C., & Gordon, C. P. (2011). Driver
distraction and driver inattention: Definition,
relationship and taxonomy. Accident Analysis &
Prevention, 43(5), 1771-1781.
Rengarasu, T. M., Hagiwara, T., & Hirasawa, M. (2009).
Effects of road geometry and cross-section variables on
traffic accidents: study using homogeneous road
segments. Transportation research record, 2102(1), 34-
42.
Ryder, B., Gahr, B., & Dahlinger, A. (2016). An in-vehicle
information system providing accident hotspot
warnings. In Proceedings of the 24th European
Conference on Information Systems (ECIS).
Sagberg, F., Selpi, Bianchi Piccinini, G. F., & Engström, J.
(2015). A review of research on driving styles and road
safety. Human factors, 57(7), 1248-1275.
Schömig, N., & Metz, B. (2013). Three levels of situation
awareness in driving with secondary tasks. Safety
science, 56, 44-51.
Sterk, F., Stocker, A., Heinz, D., & Weinhardt, C. (2024).
Unlocking the value from car data: A taxonomy and
archetypes of connected car business models.
Electronic Markets, 34(1), 13.
Stocker A, Kaiser C, Fellmann M. Quantified vehicles:
Novel services for vehicle lifecycle data. Business &
information systems engineering. 2017 Apr;59:125-30.
Stocker, A., Kaiser, C., Lechner, G., & Fellmann, M.
(2024). A Conceptual Framework for Mobility Data
Science. IEEE Access, 12, 117126-117142.
Stocker, A. (2025). User Archetypes of Physical AI
Systems. Insights from an Automated Driving Systems
Study, European Conference on Information Systems –
ECIS 2025.
Theofilatos, A. (2017). Incorporating real-time traffic and
weather data to explore road accident likelihood and
severity in urban arterials. Journal of safety research,
61, 9-21.
Xu, J., & Bowers, A. R. (2024). Hazard warning modalities
and timing thresholds for older drivers with impaired
vision. Accident Analysis & Prevention, 202, 107
Young, K. & Regan, M. (2007). Driver distraction: A
review of the literature. In: I.J. Faulks,M. Regan, M.
Stevenson, J. Br own, A. Porter & J.D. Irwin (Eds.).
Distracted driving. Sydney, NSW: Australasian College
of Road Safety. Pages 379-405.
Zambetti M, Adrodegari F, Pezzotta G, Pinto R, Rapaccini
M, Barbieri C. From data to value: conceptualising
data-driven product service system. Production
Planning & Control. 2023 Jan 25;34(2):207-23.
From Data to Warnings: Challenges in Building in-Vehicle Data-Driven Hazard Warning Systems
243
