Hematoxylin and Eosin Stained Histopathological Image
Enhancement Method
Bogusław Cyganek
AGH University of Krakow, Al. Mickiewicza 30, 30-059 Kraków, Poland
Keywords: Medical Image Processing, Histopathology, H&E Staining, Whole Slide Images (WSI),
High-Dynamic Range, Image Enhancement, Deep Learning.
Abstract: Hematoxylin and eosin staining is one of the most well-known and common methods of staining
histopathological samples. Its main purpose is to highlight the morphological features of tissues, which help
doctors make the right diagnosis. However, it is not without its flaws, and the scans obtained in this way are
characterized by high inconsistency not only resulting from the variability of the tissues themselves, but also
due to the chemical reagents used, the technique of preparing the preparation, etc. This causes various
difficulties and errors in the case of tissue assessment performed by the algorithm, but can also be a hindrance
for doctors. Therefore, there are many methods to improve the quality of scans obtained from tissue stained
in the H&E way. In this article, we present a fairly recent idea and very preliminary results for the use of our
multi-channel virtual high-dynamic range MVHDR method to improve the parameters of H&E scans. Our
method allows both data augmentation for CNN, but also significant detail enhancement that helps doctors
identify the disease.
1 INTRODUCTION
The examination of a tissue sample is one of the basic
medical procedures in the diagnosis of various types
of cancer in humans and animals. For this purpose,
there are strict procedures for collecting such tissues
and then properly preparing, storing and - recently -
digitizing them into so called Whole Slide Images
(WSI) (Tellez 2019, Janowczyk 2019, Greeley 2024).
One of the very important steps in this chain is the
appropriate staining of the tissue. Hematoxylin and
eosin stain (H&E) is one of the principal tissue stains
used in histology for over a century (Tellez 2019).
Hematoxylin is a natural chemical compound
obtained from the logwood tree Hematoxylon
campechianum, discovered by the Spanish during
exploration expeditions to Yucatan, Mexico, in the
early 16th century. Hematoxylin's initial uses were
for dyeing hair and fabrics. The first tissue staining
with hematoxylin dates back to 1800. Interestingly,
for over 200 years, hematoxylin has remained one of
the primary methods of staining tissue, primarily for
the isolation of nuclei in microscope slides (Titford
2005). Despite many years and the development of
other methods, H&E is the most widely used stain in
biology and medical diagnosis and is often the gold
standard (Dapson 2009)(Bassotti 2011)(Ma 2024).
For example, when a pathologist looks at a biopsy of
a suspected cancer, the histological section is likely to
be H&E stained (Sorenson 2014)(Srinidhi 2021).
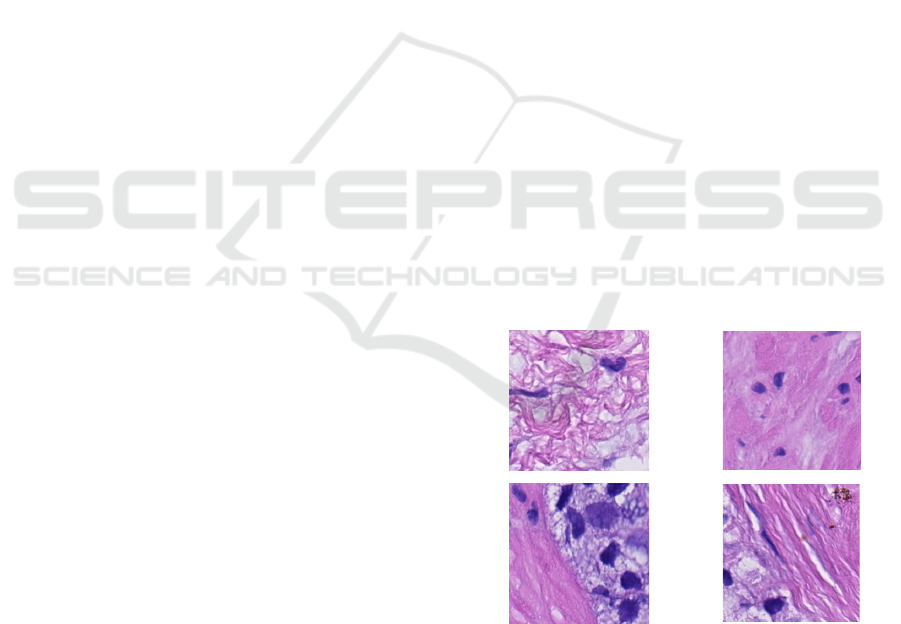
Figure 1: Examples of the healthy prostate tissue (upper
row) and tissues with cancer of type Gleason 5 (lower row).
Scans from the DiagSet dataset (Koziarski 2024).
Figure 1 shows patches extracted from a WSI scan
of the DiagSet dataset containing examples of
prostate tissues from the anonymous patients
(Koziarski 2024). Upper row contains the healthy
378
Cyganek, B.
Hematoxylin and Eosin Stained Histopathological Image Enhancement Method.
DOI: 10.5220/0013786000003982
Paper published under CC license (CC BY-NC-ND 4.0)
In Proceedings of the 22nd Inter national Conference on Informatics in Control, Automation and Robotics (ICINCO 2025) - Volume 2, pages 378-385
ISBN: 978-989-758-770-2; ISSN: 2184-2809
Proceedings Copyright © 2025 by SCITEPRESS – Science and Technology Publications, Lda.
prostate tissues, while the lower one shows patches
with a prostate cancer classified by an expert to
Gleason grade no. 5.
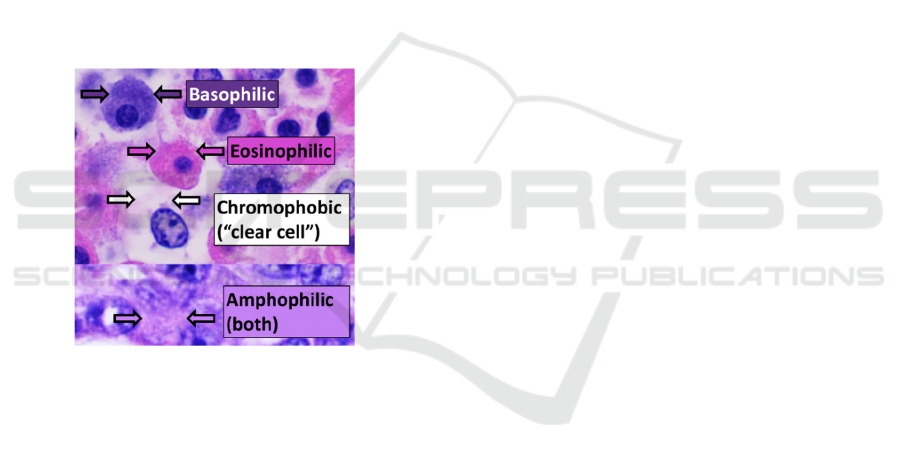
As already mentioned, H&E uses two histological
stains – hematoxylin (H) and eosin (E). H affects cell
nuclei and renders them purplish blue. On the other
hand, E stains in pink mostly the extracellular matrix
and cytoplasm, whereas other structures take on
different shades, hues, as well as combinations of
similar colors. A brief explanation of the main
structures visible in a tissue sample after the H&E
staining is shown in Figure 2 (Lisowski 2019)
(Sampias 2025). Hence a pathologist can easily
differentiate between the nuclear and cytoplasmic
parts of a cell, and additionally, the overall patterns of
coloration from the stain show the general layout and
distribution of cells and provides a general overview
of a tissue sample's structure. Thus, pattern
recognition, both by expert humans themselves and
by software that aids those experts in digital
pathology, provides histologic information.
Figure 2: Brief explanation of the main structures visible in
a tissue sample after the hematoxylin & eosin staining
(Source images: Mikael Häggström. Public Domain, 2022).
Nevertheless, H&E is not a remedy for all the
cases and tissues – hence, in some difficult cases
more specific stains and methods are used. Similarly,
when using H&E stained patches for grading we may
encounter a number of problems. The first problem is
the heterogeneity of samples even those performed in
the same laboratory. The second is the insufficient
quality parameters of the image that make it difficult
or negatively affect the quality of classification.
In this paper we address at least two of these
problems by proposing a new concept of nonlinear
multi-channel virtual high dynamic range (MVHDR)
filtering method, however successfully applied to the
H&R scans. What's important about our method is
that it follows the general idea of tissue staining –
because unstained tissues lack contrast, our method
goes a step further and significantly improves contrast
in already H&E stained tissues.
This our preliminary proof of concept is based on
a number of previous works and discoveries that
inspired us to use it to improve the quality of H&E
scans based on the advance image filtering algorithms
(Grabek 2019)(Koziarski 2018). These previous
observations include the application of VHDR to
thermal images, i.e. from the far infrared, for which
we observed that the application of VHDR before
using the CNN network significantly improved its
results (Knapik 2019). Early concepts and results,
presented in this paper, show that our assumptions are
correct, although we leave more in-depth studies for
the future.
This is a position paper showing our initial
concepts and the first observations. The rest of the
paper is organized as follows. In Section 2, we briefly
review the existing literature on this topic. In Section
3, we present the details of our approach, with a novel
multi-channel VHDR (MVHDR). Chapter 4 presents
the results of the experiments along with a discussion
of the obtained results. The article ends with
conclusions and a list of literature.
2 RELATED WORKS
The history of the discovery of hematoxylin, as well
as its subsequent uses, is particularly interesting
(Titford 2005)(Cooksey 2021). Despite numerous
studies and new approaches to tissue contrast, H&E
remains one of the most widely used methods.
However, it is not without its drawbacks (Dapson
2009)(Bassotti 2011)(Ma 2024). Hence, there are
many works and studies on improving the image
quality of scans stained in the H&E method. Here we
mention only a few of the most important ones, and
further literature references can be found in the
mentioned here works. The first group are methods
improving the repeatability and homogenity of
staining, because even the same laboratories can
produce completely different shades for the same
tissues. These are called stain normalization methods.
In this respect Janowczyk et al. proposed the use of
sparse autoencoders for stain normalization
(Janowczyk 2017). In their method pixels are
separated into 𝑘 clusters. Then histogram equalization
across clusters and RGB channels is applied to obtain
a color standardized image. In the same vein Zanjani
et al. propose to use the deep generative models
(Zanjani 2018). This is done to separate pixels into 𝑘
tissue classes. In the next step, stain normalization is
obtained by separation of the source and target
Hematoxylin and Eosin Stained Histopathological Image Enhancement Method
379
images. On the other hand, for stain normalization
Tellez et al. propose an U-Net-like network
architecture. This is improved with heavily color-
augmented images and trained to reconstruct their
original appearance (Tellez 2019). Their main idea is
that when trained with images from a target center,
the network should be able to transform new images
to the same target color distribution.
The second group of methods deals with the
general change of parameters of H&E images. An
interesting approach is based on Blind Color
Deconvolution (BCD) techniques. Its idea is to
separate H&E images into colors (stains) and
structural information (concentrations). This, in turn,
can be useful for the further processing, data
augmentation, and classification etc. In this respect,
Ruifrok et al. proposed the use of the logarithmically
inverted optical density space and a non-blind color
deconvolution algorithm to obtain the stain
concentrations (Ruifrok 2001).
However, we have adopted a slightly different
approach, which involves both improving contrast
and the ability to change the color space.
3 METHOD DESCRIPTION
In this section the basic architecture of the proposed
method is presented. More concretely, we start with
the overall view of the main blocs, after which a
general description of the method operation follows.
3.1 Operation of the Virtual
High-Dynamic Range Converter
The main idea of the presented method, called VHDR
(Knapik 2021), is to increase the dynamics of the
image, but using a single image as its input – hence
the name "virtual" high dynamic range. This is
different from classic HDR, which usually uses
several images with different exposures (Sen 2016).
However, in many cases, such as H&E, we simply do
not have such many exposures. Hence the idea that
we can "artificially" generate them. The processing
chain leading to this is shown in Figure 3. It operates
as follows. An input image is processed by a set of
tone adjustment curves. As a result, a number of tone
converted images is calculated.
The main idea here is to expose different ranges
of the input image, in order to reveal not well visible
details. The tone sub-images are then joined back to
form one HDR image. After that, image range
conversion and contrast enhancement are applied.
Tone curves Fusion module
Contrast
enhancement filter
Image range
conversion
In
image
Out
image
Figure 3: Architecture of the virtual high-dynamic range
converter. Only a single image is required as its input.
The luminance change is done with help of the
logistic function, in its basic form given as follows
()
()
()
0
0
1
−−
=+
kx x
sx A e
,
(2)
where A denotes and amplitude and k is a parameter;
x
0
denotes the so called middle point of the S shape
function, whose inflection point is just x
0
.
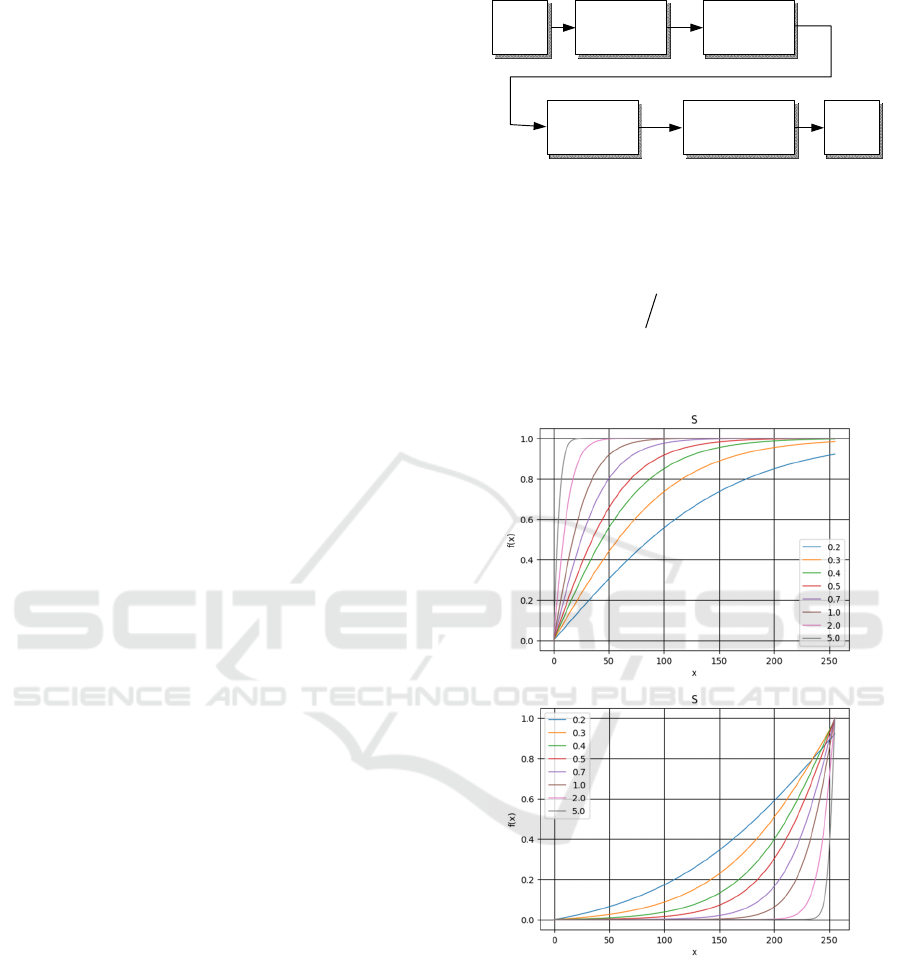
Figure 4: Sets of functions to generate virtual exposures.
Horizontal axis denotes the input brightness. Vertical the
normalized output brightness. From top: convex and
concave curves.
However, to generate series of virtual exposures
we need three variants of the logistic functions:
convex, concave, as well as S-shaped. Exemplary
variants of these function are shown in Figure. Not
less important is to assure that the domain and
codomain cover the whole allowable range, which for
ICINCO 2025 - 22nd International Conference on Informatics in Control, Automation and Robotics
380

8-bits runs 256 values. Hence (1) needs to be
conditioned, as follows
()
()
0
10
,, 1
−
−
=+
x
x
Dk
R
sxkx A e
.
(2)
D is a domain range constant, A=P
max
is a maximal
pixel range of the input image. The parameter D
controls the range of values of s
1
– it needs to be
different from 0 and 1. In other words, these are the
saturation values. In our system this parameter is set
to 2 times 6 around x
0
, and hence D=12.
The above function is extended by the additional
multiplicative and additive components to provide a
concave, convex and S like shape. It needs also to
cover full range of the codomain – this is in the range
[P
min
, P
max
], i.e. [0,255]. Hence, new version of ()
reads as follows:
()
()
()
()
20
100 10
,,
,, 1 0,,
=
−++
mid mid
sxkx
s
xkx x P P s kx
(3)
For 8-bit pixel representations P
mid
=(P
max
-
P
min
)/2=(255.0-0.0)/2=127.5, which denotes a middle
value of the low dynamic image. In the next step,
parameter x
0
is chosen from the following three
values
{
}
0
,,
min mid max
xPPP∈
.
(4)
Each of the above values of x
0
corresponds to a
distinct type of a curve as follows (Figure 4):
1. Convex case – The midtone data of the input
image is stretched toward the highlight of the
output space, resulting in a bright-toned image.
2. Concave case – The midtone data of the input is
stretched toward the shadow of the output space,
resulting in a dark-toned image.
3. S-curve – The highlight and shadow of the input
pixels are enhanced, leading to a higher contrast.
The parameter to consider now is k, whose value
was chosen experimentally, as follows:
{
}
{}
{}
0
0
0
0.2, 0.3 ,
0.4, 0.5 ,
0.3, 0.4 , .
=
∈=
=
min
mid
max
f
or x P
kforxP
f
or x P
(5)
Summarizing, with three values x
0
, and two
parameters k for each x
0
, a series of V=6 tone
converted images I
v
is generated. Values of these
parameters were chosen experimentally.
On the other hand, the fusion module takes as its
input the aforementioned set of V tone mapped
images. In its next step, each pixel i
h
in the output
fused image I
h
is computed as a weighted sum of all
V pixels i
v
, as follows
11==
=
VV
hvvv
vv
iwiw
,
(6)
where i
h
denotes an output pixel, i
v
is an input pixel
from one of the V tone mapped images I
v
, while the
weight w
v
is computed as follows:
2
vmid
mid
iP
P
v
we
λ
−
−
=
.
(7)
λ in the above denotes a parameter that controls
steepness of the weighting function. In our
experiments λ is set to a value in the range 2.2-3.9.
Pixel values obtained thanks to (6) are frequenlty
concentrated around the middle values of the
allowable pixel range, since these are increased by the
weights in (7). Therefore, their values need to be
further scaled by the image range conversion module,
in order to spread equally their histograms. This
scaling process is done as follows:
()
() ()
max
ˆ
hh
h
hh
iminI
iP
max I min I
−
=
−
, for each
hh
iI∈
(8)
where
min(I
h
) and max(I
h
) are minimal and maximal
values of the whole I
h
image, respectively.
The last step constitutes image contrast
enhancement. This is done with the one-scale local
spatial filter (Cvetkovic, 2007). In this process, each
pixel is converted as follows:
()
ˆˆ ˆ
=+ −
oh h h
ii imi
,
(9)
where the mean value
m around a pixel
ˆ
h
i
, in the
window controlled by two parameters
s
w
and t
w
, is
computed in accordance with the following formula
()
()
()()
()
ˆ
,
1
ˆ
,.
2121
=− =−
=
++
++
ww
ww
h
st
h
sstt
ww
mi pq
ipsqt
st
(10)
Figure 4 shows different functions for generation of
virtual exposures.
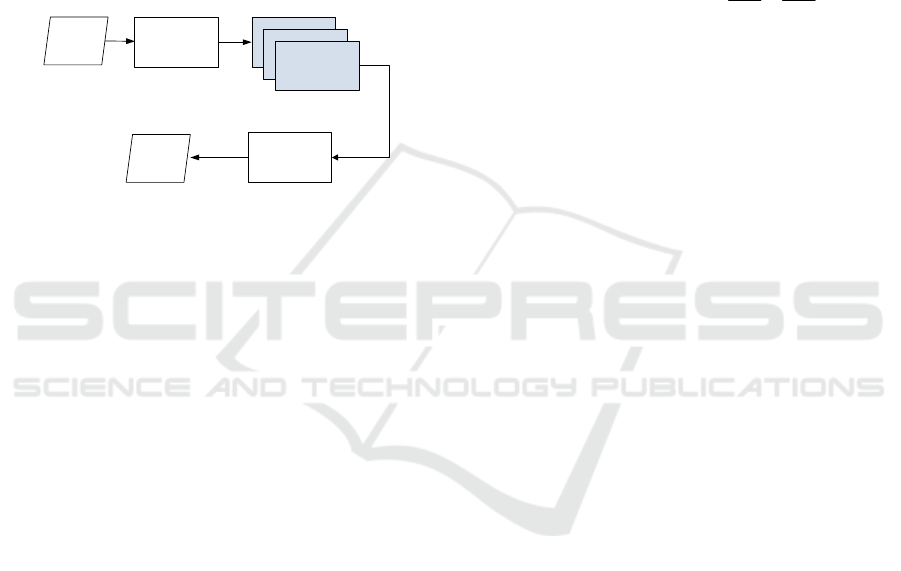
3.2 Multi-Channel VHDR
The VHDR method described in the previous chapter
has been extended to the space of color images or
even multi-channel signals/images. This is one of the
main contributions of this paper.
We assume that the input color image is
represented using the RGB space. Then, an optional
conversion of this space to another color space takes
place. Out tested transformations are as follows:
Hematoxylin and Eosin Stained Histopathological Image Enhancement Method
381
1. RGB HSI
2. RGB IJK
3. RGB YCrCb
In each of the above spaces, including RGB, the
image dynamics improvement is performed
independently in each of the color channels. This
means that it is possible to independently select the
parameters of the single-channel VHDR method for
each color channel independently. In this way, for
example, after transformation to the YCrCb space,
only the Y channel can be modified, leaving Cr and
Cb unchanged, etc. Operation of the proposed
extended method is depicted in Figure 5.
Jednokanałowy
VHDR
Color image
in RGB
Color-VHDR
Color Space
Converter from
RGB
Jednokanałowy
VHDR
Single-channel
VHDR
Color Space
Converter to RGB
Figure 5: Architecture of the proposed multi-channel
VHDR method. Structure of the single-channel VHDR is
shown in Figure 3.
It is also possible to change all channels, also
causing a change in the color palette. The last feature
can be independently useful for doctors for deeper
analysis of histopathological scans. Selected
experimental results are presented in the next section.
4 EXPERIMENTAL RESULTS
As alluded to previously, in this position paper we
present our novel concept and intuition, as well as
initial findings. Our method is also underpinned with
good results obtained in thermal image enhancement
when operating with CNN (Knapik 2021). The main
experiment planned for the nearest future research
into this topic will be to train CNN for cancer
classification with MVHDR on its input. This
requires finding the optimal hyperparameters of
MVHDR. Hence, the next step can be to built-in
MVHDR as an initial layer of a CNN, which will be
then trained with the optimization criteria of the best
accuracy. However, this is left for the future research.
An interesting and parallel branch of method
assessment is its application in computer systems
aimed at helping to diagnose or to annotate WSI by
the professional pathologists. Based on our private
conversations with the pathologists we know their
needs. We can also assess the usefulness of such
system features as the increase in scan quality
presented here or the change of the color palette for
the histopathological diagnostic process. It will
therefore be a human-in-the-loop system.
Following this direction, in this paper we present
results comparing the quality of patches from WSI
scans before and after applying MVHDR. Our
objective measures are sharpness and clarity.
• Sharpness – a measure conveying information
on level of detail in a scan. In our approach we
compute variance of the Laplacian, defined as
follows (Cyganek 2009):
() ()
22
2
22
,,
∂∂
=∇ = +
∂∂
II
LIxy Ixy
x
y
,
(11)
In our experiments a discrete version of
L is
used, to compute sharpness coefficient S over an
image I, as follows:
[
]
()
var
=
SLII
,
(12)
where
()
L I
denotes discrete Laplacian over
the entire image I, and
var stands for variance.
Hence, this measure indicates how well the
edges and fine details are captured. In many
classification systems, also based on AI,
sharpness can be essential to obtain high
accuracy especially when processing images
with some lighting and/or geometrical defects.
• Clarity – a measure that encompasses the overall
visual coherence and an overall level of noise
and/or distortions. In our approach clarity
C is
expressed as a product of the above sharpness
measure
S, and the standard deviation of an
image. Hence, clarity is expressed as follows:
[
]
[
]
[
]
=⋅CSstdII I
,
(13)
where
std is the standard deviation.
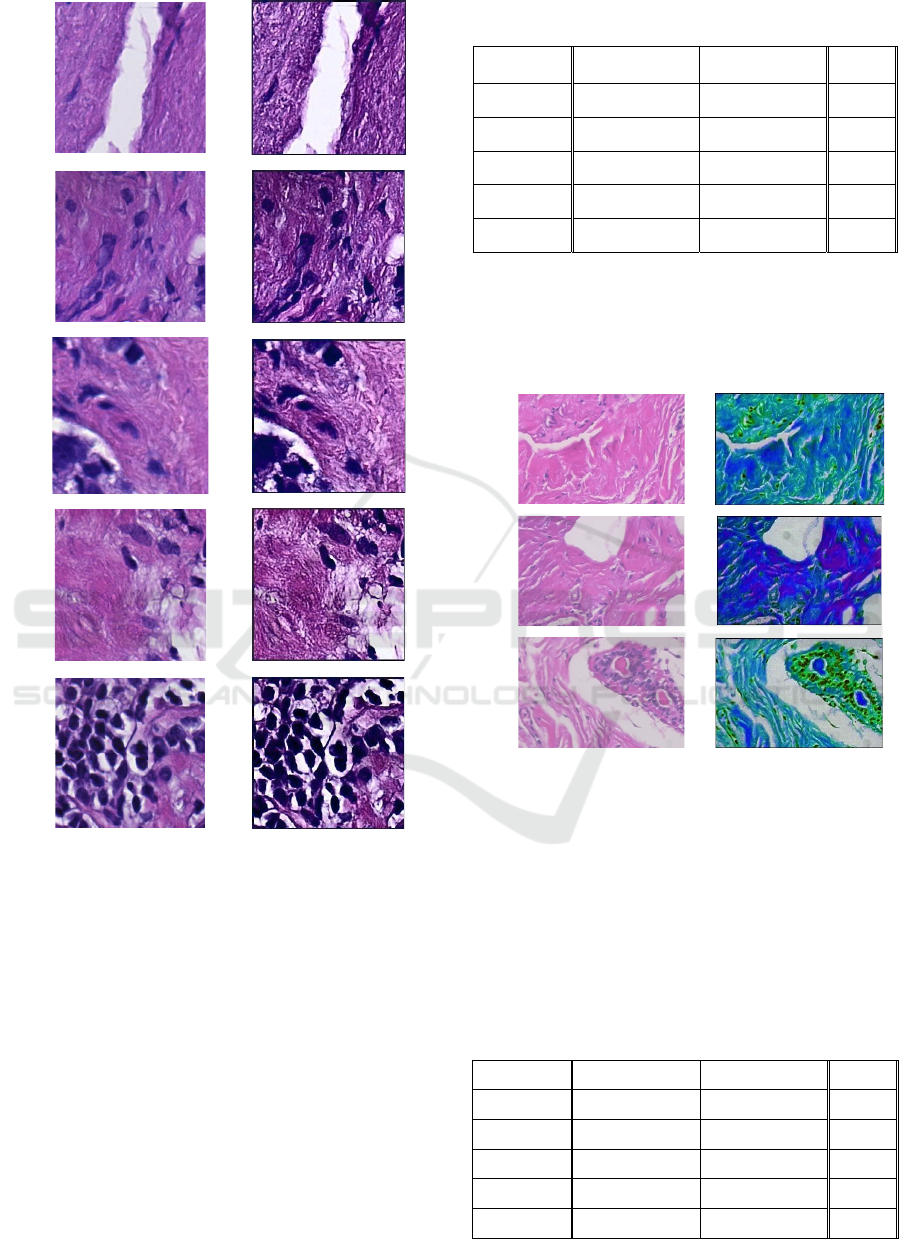
Figure 6 shows a number of original H&E patches
from the DiagSet with various Gleason degrees
(Koziarski 2024), i.e. these are cancerous tissues.
ICINCO 2025 - 22nd International Conference on Informatics in Control, Automation and Robotics
382
1
2
3
4
5
Figure 6: Left column – examples of prostate scan sections
at 40x magnification from DiagSet – diseased tissue – G5
on the Gleason scale. Right column – images processed
with the developed MVHDR module. Visible improvement
in contrast enabling analysis of morphological structures of
the tissue, such as estimation of the size and locations of
nucleoli.
In Figure 6 original patches are in the left column,
whereas MVHDR processed in the right one. Even
visual inspection shows that the latter are sharper and
more revealing of the morphological details of the
tissue, which may be important both for
classification, as well as for inspection by an expert
pathologist. These observations are confirmed by
quantitative measurements of the parameters S from
(12) and C defined in (13), and presented in Table 1
and Table 2, respectively.
Table 1: Sharpness values S computed for the images from
Figure 6.
Image no. S - Original S - MVHDR Ratio
1 148.27 2465.83 16.6
2 155.66 2398.71 15,4
3 108.11 1690.45 15,6
4 219.39 3246.61 14,8
5 288.54 3376.86 11,7
Figure 7 shows prostate cancer tissues showing
color space change obtained on histopathological
scans using the developed MVHDR method. Original
H&E patches are shown in the left column, while
MVHDR-processed image are in the right one.
1
2
3
Figure 7: Samples of the prostate cancer tissues illustrating
image enhancement and color space change by the
MVHDR method. Original H&E image (left column),
MVHDR-processed image (right column).
As can be seen in the right column of Figure 7, the
histological images have not only been contrast-
enhanced, but also converted to a different color space,
which allows for the perception of other image details,
e.g., in the case of a diagnosis made by a pathologist.
Table 2: Clarity values C computed for the images from
Figure 6.
Image no. C- Original C - MVHDR Ratio
1 6957.79 184386.41 26.5
2 4143.99 128363.72 30.9
3 4065.20 104402.24 25.7
4 8071.64 212568.42 26.3
5 16212.25 281219.42 17.3
Hematoxylin and Eosin Stained Histopathological Image Enhancement Method
383
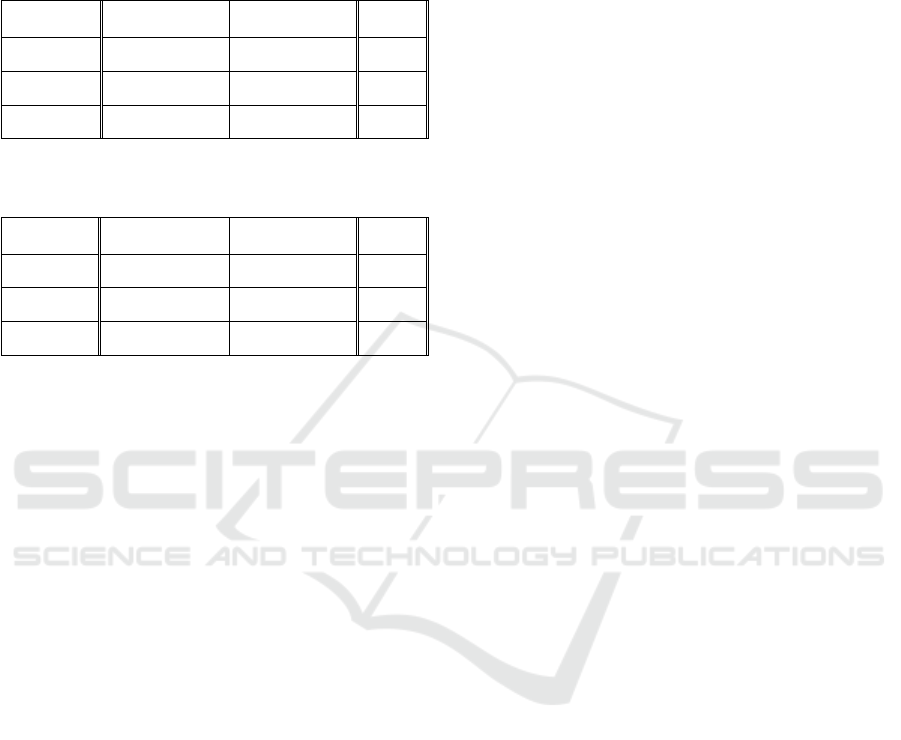
Table 3 and Table 4 show numerical results of the
parameters S and C computed for the images from
Figure 7, respectively.
Table 3: Sharpness values S computed for the images from
Figure 7.
Image no. S - Original S - MVHDR Ratio
1 597.25 4647.94 7.8
2 301.59 3412.69 11.3
3 288.05 3777.61 13.1
Table 4: Clarity values C computed for the images from
Figure 7.
Image no. C- Original C - MVHDR Ratio
1 12583.80 188048.80 14.9
2 8096.60 188842.25 23.3
3 8106.07 189127.10 23.3
In all cases we see a significant difference, i.e.
more than an order of magnitude, between the
parameters for the original H&E scans and their
versions processed with our MVHDR method.
However, it's not the numerical values themselves
that matter, but their ratio (the rightmost column),
which in all cases exceeds an order of magnitude.
This demonstrates significant potential for improving
contrast, as well as the dynamics of pixel
representation itself. We have presented results here
for several images, but they are consistent for all
patches obtained from the WSI scan. This proves the
stability of the proposed method, which in virtually
every real case leads to a significant contrast
enhancement and – as we have seen – also allows for
changing the color palette.
The presented method was implemented in C++.
Experiments were conducted on a computer with 128
GB of RAM and an Intel® i7-11850H/2.50GHz
microprocessor, running Windows 10 Pro. Such
implementation allows for real-time processing of
video streams, as well as for easy parallelization – the
feature which we intend to utilize in the future.
5 CONCLUSIONS
In this paper we address the problem of enhancement
and filtering of the H&E stained histopathological
scans. Our original concept relies on application of
the nonlinear multi-channel virtual high dynamic
range filtering method to the H&R scans.
We would like to stress that this is an initial
concept describing work in progress and published as
a position paper. Therefore we only outlined the main
concept and presented the initial results, which are
encouraging. Also, our previous experience with this
type of data preprocessing/augmentation for CNN
training, although tested for thermal images showed
very good results, increasing the final accuracy by
certain percentage points (Knapik 2021).
Summarizing, our proposed MVHDR method
can be used for:
• Data augmentation for CNN/ViT training.
• Generation of new images for GAN.
• To generate better quality histopathological
images for doctors’ diagnosis.
Our scientific hypothesis and things to do are as
follows:
1. The proposed method, when used as a data
preprocessing module, can lead to higher
accuracies in deep learning with CNN and ViT.
2. The proposed method can be used as a data
augmentation module.
3. The method can be used to improve quality
and/or change the color palette when used in
tissue diagnosis by medical experts.
If the above are correct, then the next step would be
as follows:
4. Design of the input layers, so the optimal
parameters of the MVHDR method can be
learned by a CNN/ViT during its training.
Finally, we would like to mention that this method
was discussed and pre-tested by two pathology
experts who gave it a positive review. They were
particularly interested in the possibility of enhancing
the contrast and highlighting important
morphological details of the observed tissues. We are
planning further tests in this direction as well. It
would be particularly interesting to observe
differences in the labeling process of different types
of tissue by medical specialists without and with the
use of the method proposed here.
ACKNOWLEDGMENT
Research under project no. 10741, supported by
program “Excellence initiative – research university”
for the AGH University of Krakow.
ICINCO 2025 - 22nd International Conference on Informatics in Control, Automation and Robotics
384

REFERENCES
Bassotti, G., Villanacci, V., Salerni, B., Maurer, C. A.,
Cathoma, G. (2011). Beyond hematoxylin and eosin:
the importance of immunohistochemical techniques for
evaluating surgically resected constipated patients
Tech. Coloproctol 15:371–375, Springer, DOI
10.1007/s10151-011-0721-5.
Cooksey, C. J. (2021) Hematoxylin in the 21st century,
Biotechnic & Histochemistry, 96:3, pp. 242-249, DOI:
10.1080/10520295.2020.1786725
Cvetkovic S.D., Schirris J., de With P.H.N. (2007).
Locally-Adaptive Image Contrast Enhancement
without Noise and Ringing Artifacts. IEEE
International Conference on Image Processing, vol. 3,
pp. 551-560.
Cyganek, B. (2009). An Introduction to 3D Computer
Vision Techniques and Algorithms, Wiley,.
Dapson RW., Horobin RW. (2009). Dyes from a twenty-
first century perspective, Biotechnic & Histochemistry,
84:4, pp. 135-137, DOI: 10.1080/10520290902908802
Dosovitskiy, A., Beyer, L., Kolesnikov, A., Weissenborn,
D., Zhai, X., Unterthiner, T., Dehghani, M., Minderer,
M., Heigold, G., Gelly, S. (2020). An image is worth
16x16 words: Transformers for image recognition at
scale. arXiv preprint. arXiv: 2010.11929.
https://doi.org/10.48550/arXiv.2010.11929.
Grabek, J., Cyganek, B (2019). Speckle Noise Filtering in
Side-Scan Sonar Images Based on the Tucker Tensor
Decomposition, Sensors, 19(13), 2903; https://doi.org/
10.3390/s19132903
Greeley, C., Holder, L., Nilsson, E. E., Skinner, M. K.
(2024). Scalable deep learning artificial intelligence
histopathology slide analysis and validation. Scientific
Reports, 14(1), 26748. https://doi.org/10.1038/s41598-
024-76807-x.
Janowczyk A, Madabhushi A. (2016). Deep learning for
digital pathology image analysis: a comprehensive
tutorial with selected use cases. J Pathol
Inform;7(1):29.
Janowczyk, Basavanhally, A., Madabhushi A. (2017).
Stain normalization using sparse autoencoders
(stanosa): application to digital pathology, Comput.
Med. Imaging Graph. 57.
Ke W.-M., Wang T.-H., Chiu C.-T. (2009). Hardware-
efficient virtual high dynamic range image
reproduction. Proceedings of the 16th IEEE
International Conference on Image Processing
(ICIP’09). Piscataway, NJ, USA: IEEE Press, pp.
2665–2668.
Knapik M., Cyganek B. (2021). Fast eyes detection in
thermal images. Multimedia Tools and Applications
80:3601–3621, Springer, https://doi.org/10.1007/
s11042-020-09403-6.
Koziarski, M., Cyganek, B. (2018). Marine Snow Removal
Using a Fully Convolutional 3D Neural Network
Combined with an Adaptive Median Filter, 24th
International Conference on Pattern Recognition,
Pattern Recognition And Information Forensics (ICPR
2018) LNIP Vol. 11188 , pp. 16-25
Koziarski, M., Cyganek, B., Niedziela, P., Olborski, B.,
Antosz, Z., Żydak, M., Kwolek, B., Wąsowicz, P.,
Bukała, A., Swadźba, J. (2024). DiagSet: A dataset for
prostate cancer histopathological image classification.
Scientific Reports, 14(1), 6780. Nature Publishing
Group. https://doi.org/10.1038/s41598-024-52183-4.
Lisowski, A. (2019) Science of H&E. Leica BioSystems
https://www.leicabiosystems.com/knowledge-
pathway/science-of-he/
Ma, ZY, Zhang, XF, Hu, YZ, Zhu, MD, Jin, J, Qian, P.
(2024). Comparison of staining quality between rapid
and routine hematoxylin and eosin staining of frozen
breast tissue sections: an observational study. J Int Med
Res. Jun; 52(6): 3000605241259682. doi:
10.1177/03000605241259682. PMID: 38886869;
PMCID: PMC11184997.
Ruifrok A.C., Johnston D.A. (2001). Quantification of
histochemical staining by color deconvolution, Anal.
Quant. Cytol. Histol. 23, pp. 291–299.
Sampias, C., Rolls, G. (2025). H&E Staining Overview: A
Guide to Best Practices. Leica BioSystems.
https://www.leicabiosystems.com/knowledge-
pathway/he-staining-overview-a-guide-to-best-
practices/
Sen P., Aguerrebere C. (2016). Practical High Dynamic
Range Imaging of Everyday Scenes. IEEE Signal
Processsing Magazine, pp. 36-44.
Srinidhi, C.L., Ciga, O., Martel, A.L. (2021). Deep neural
network models for computational histopathology: A
survey, Medical Image Analysis, Volume 67, 2021,
101813, ISSN 1361-8415, https://doi.org/10.1016/j.
media.2020.101813.
Sorenson, R.L., Brelje, T.C. (2014). Atlas of Human
Histology A Guide to Microscopic Structure of Cells,
Tissues and Organs 3rd Edition
Tellez D, Litjens G, Bándi P. (2019). Quantifying the
Effects of Data Augmentation and Stain Color
Normalization in Convolutional Neural Networks for
Computational Pathology Medical Image Analysis,
Volume 58.
Titford, M. (2005). The long history of hematoxylin,
Biotechnic & Histochemistry, 80:2, pp. 73-78, Taylor
& Francis.
Zanjani F.G., Zinger S., Bejnordi, B.E., van der Laak,
J.A., de With, P.H. (2018). Stain normalization of
histopathology images using generative adversarial
networks, in: 2018 IEEE 15th International
Symposium on Biomedical Imaging, pp. 573–577,
IEEE.
Hematoxylin and Eosin Stained Histopathological Image Enhancement Method
385
