
Revisiting Expected Possession Value in Football: Introducing a U-Net
Architecture, Reward and Risk for Passes, and a Benchmark
Thijs Overmeer
1,2 a
, Tim Janssen
3 b
and Wim P. M. Nuijten
1,2 c
1
Eindhoven AI Systems Institute, Eindhoven University of Technology, Eindhoven, The Netherlands
2
Department of Mathematics and Computer Science, Eindhoven University of Technology, Eindhoven, The Netherlands
3
Royal Dutch Football Association (KNVB), Zeist, The Netherlands
Keywords:
Expected Possession Value, U-Net Architecture, Football Analytics, Pass Analysis, Risk-Reward Decompo-
sition, Machine Learning in Sports.
Abstract:
This paper presents an Expected Possession Value (EPV) model for football with three main new components:
a U-Net-inspired convolutional neural network architecture, ball height as a feature, and a dual-component
pass value model that analyzes reward and risk. We furthermore introduce the Overmeer–Janssen–Nuijten Pass
Expected Possession Value benchmark (OJN-Pass-EPV benchmark), which enables a quantitative evaluation
of EPV models by using pairs of game states with given relative EPVs. The presented EPV model achieves
good results in model loss and Expected Calibration Error on a dataset containing Dutch Eredivisie and 2022
FIFA Men’s World Cup matches and correctly identifies the higher value state in 78% of the game state
pairs in the OJN-Pass-EPV benchmark, demonstrating its ability to accurately assess goal-scoring potential.
Our findings enable more precise EPV estimations, support risk-reward analysis for passing decisions, and
establish quality control standards for EPV models.
1 INTRODUCTION
Football analytics is increasingly important for gain-
ing a competitive edge. This paper focuses on a spe-
cific metric in the expanding realm of football data
analysis: Expected Possession Value (EPV). EPV
quantifies the net probability of goal outcomes within
a fixed time horizon: the probability that the team
in possession scores minus the probability that they
concede within τ seconds. Following Fern
´
andez et al.
(2021), who propose a horizon consistent with the av-
erage possession duration, we set τ = 15 seconds in
this study. The resulting value is a continuous, zero-
centered measure of goal-scoring potential with range
in [−1, 1].
This work addresses four key research questions
(RQs) in EPV modeling:
First, can we develop a high-quality EPV model
using modern deep learning architectures? We in-
vestigate whether U-Net convolutional neural net-
works, successful in medical imaging and other spa-
a
https://orcid.org/0009-0003-9108-1909
b
https://orcid.org/0000-0002-8050-1176
c
https://orcid.org/0000-0003-0351-2768
tial domains, can capture the complex spatial pat-
terns in football. For this, we introduce OJN-
EPV (Overmeer–Janssen–Nuijten Expected Posses-
sion Value), a U-Net–type architecture focused on
pass EPV, tested on the Dutch Eredivisie dataset and
the 2022 FIFA Men’s World Cup dataset.
Second, does incorporating ball height as a fea-
ture improve pass prediction? We examine whether
adding the vertical dimension enables the model to
distinguish between aerial and ground passes, po-
tentially improving prediction accuracy for different
types of passing scenarios.
Third, can decomposing pass value into risk and
reward components provide more actionable insights?
We define reward as the probability of scoring and
risk as the probability of conceding within 15 sec-
onds, for both successful and unsuccessful passes.
Fourth, how can we establish standardized eval-
uation methods for EPV models? We introduce the
Overmeer–Janssen–Nuijten Pass Expected Posses-
sion Value benchmark (OJN-Pass-EPV benchmark),
consisting of 50 expert-validated pairs of game states
for relative pass-value comparison.
100
Overmeer, T., Janssen, T. and Nuijten, W. P. M.
Revisiting Expected Possession Value in Football: Introducing a U-Net Architecture, Reward and Risk for Passes, and a Benchmark.
DOI: 10.5220/0013784300003988
Paper published under CC license (CC BY-NC-ND 4.0)
In Proceedings of the 13th International Conference on Sport Sciences Research and Technology Support (icSPORTS 2025), pages 100-109
ISBN: 978-989-758-771-9; ISSN: 2184-3201
Proceedings Copyright © 2025 by SCITEPRESS – Science and Technology Publications, Lda.

1.1 Main Contributions
Based on our research questions, this work delivers
the following contributions:
• A U-Net-based EPV model achieving strong per-
formance across all components: pass success,
pass likelihood, and pass value prediction with
low loss and strong calibration.
• Empirical validation that ball height improves
pass likelihood predictions, enabling the model to
distinguish aerial from ground passes while ac-
counting for their inherent uncertainty.
• Decomposition of pass value into interpretable re-
ward and risk components, enabling tactical anal-
ysis of volatility in passing decisions beyond a
single metric.
• The OJN-Pass-EPV benchmark with 50 expert-
validated game state pairs, establishing the first
standardized quantitative evaluation framework
for EPV models.
2 RELATED WORK
Quantifying the value of actions in football follows
two main lines: event-only models and tracking-
based models. Event-only approaches leverage the
broad availability of event data, while tracking-based
models exploit full-player spatio temporal data to cap-
ture off-ball context.
Event-based metrics such as Rudd’s Markov mod-
els (Rudd, 2011), VAEP (Decroos et al., 2019), Ex-
pected Threat (xThreat) (Singh, 2019), and ECOM
(Bransen et al., 2019) estimate the added value of ac-
tions from event data. They scale well across com-
petitions but cannot distinguish game states that share
identical on-ball actions yet differ in off-ball position-
ing, which limits their ability to evaluate relative pass
value in otherwise similar situations.
Tracking-based approaches combine tracking
data with events to model spatial dynamics. Metrics
such as Dangerousity (Link et al., 2016) and expected
pass (Anzer and Bauer, 2022) incorporate for example
player locations and velocities, offering richer con-
text. However, many works either simplify represen-
tation (e.g., coarse zones) or only partially encode the
full game state, and the resulting models are not al-
ways transparently interpretable for practitioners.
Fern
´
andez et al. (2019) introduce Expected Pos-
session Value (EPV) to football as a tracking-based
framework that estimates, at each event of a pass,
dribble, or shot, the net probability of scoring mi-
nus conceding within a fixed horizon. EPV decom-
poses possession into actions (passes, carries, shots)
and produces spatially interpretable surfaces, includ-
ing pass value within a fixed horizon (commonly 15
seconds) and pass success probabilities. Fern
´
andez
et al. (2021) further refine components such as pass
likelihood, dribble and shot evaluation, and action se-
lection, and evaluate models with calibration and loss
metrics.
Beyond single-number value, prior work has ex-
amined risk–reward trade-offs for passes using track-
ing data (Goes et al., 2022; Power et al., 2017), typi-
cally defining risk via interception likelihood and re-
ward via tactical outcomes. Our perspective differs
in objective: we define reward and risk directly in
terms of future goal scoring and conceding probabili-
ties within a 15-second horizon, yielding spatial value
surfaces for both successful and unsuccessful passes.
Two gaps remain salient. First, ball height is
rarely modeled, despite empirical differences be-
tween aerial and ground passes (H
˚
aland et al., 2020).
Second, standardized relative evaluation for pass EPV
is lacking; existing works predominantly report ag-
gregate loss and calibration, which do not capture
whether a model ranks two closely related states in
the expert-expected order. Our work addresses both
by incorporating ball height explicitly, and by intro-
ducing an expert-validated benchmark of paired game
states for relative assessment.
3 METHODOLOGY
3.1 Data Collection
The data used in this study are sourced from the
Koninklijke Nederlandse Voetbalbond (KNVB), pro-
viding tracking data from TRACAB, and event data
from OPTA, which encompasses the 2021/22 and
2022/23 seasons of the Dutch Eredivisie, in addition
to data from the 2022 FIFA Men’s World Cup.
Our analysis utilizes data from 624 Eredivisie
matches and 63 2022 FIFA Men’s World Cup
matches. This combination captures a diverse array
of performance levels and playing styles, thereby pro-
viding a robust foundation for OJN-EPV.
3.2 Data Preprocessing and Feature
Engineering
We transform the raw event and tracking data for in-
tegration into our models through the following steps:
• Coordinate Normalization and Grid Scaling:
Player and ball coordinates are first normalized to
Revisiting Expected Possession Value in Football: Introducing a U-Net Architecture, Reward and Risk for Passes, and a Benchmark
101

a standard pitch dimension (105m x 68m) based
on the venue information associated with each
match, addressing variations in actual pitch sizes.
These normalized coordinates are then scaled to
fit a 104×68 grid representation for efficient pro-
cessing in NumPy and TensorFlow. Velocities are
smoothed using a Savitzky-Golay filter to reduce
noise.
• Direction Standardization and Cleaning: We
standardize the data by ensuring all attacks pro-
ceed uniformly from left to right. Additionally,
we remove instances of players recorded outside
the pitch boundaries to improve data integrity.
• Real Playing Time Calculation: To accurately as-
sess pass value, we calculate the actual playing
time, excluding periods when the ball is out of
play. This ensures that our evaluation window of
15 seconds following each pass reflects only the
active duration of the game, providing a more pre-
cise assessment of in-game actions.
• Data Alignment: To ensure synchronicity, we
align the event data with the tracking data. This
ensures that each pass event is accurately reflected
in the tracking data, enabling precise spatial and
temporal analysis. The tracking data includes ball
height (z-axis). Positional data from optical track-
ing systems inherently contains noise (with typi-
cal errors around 7–8 cm (Linke et al., 2020)); our
1 m grid resolution is robust to such deviations in
the (x, y) positions.
For the pass likelihood, pass success, and pass value
models, we use the features described in Fern
´
andez
et al. (2021) and additionally incorporate the z-value
(height) of the ball.
3.3 Model Architecture
We select a U-Net–type architecture (Ronneberger
et al., 2015) due to its proven effectiveness in image
segmentation tasks, which share similarities with pre-
dicting dense, spatially-aware surfaces like pass EPV
across the pitch. The U-Net’s encoder-decoder struc-
ture with skip connections allows the model to cap-
ture both fine-grained local details (e.g., player prox-
imity) and broader global context (e.g., overall team
formation), which are both crucial for accurate EPV
estimation.
Our pass OJN-EPV model takes a multi-channel
grid representation of the game state over the pitch
with dimensions (104×68) and produces a single out-
put grid of the same size. Each cell corresponds to
the predicted quantity at that location (e.g., pass suc-
cess probability, pass likelihood, or pass value). The
model comprises encoder and decoder blocks with
max pooling, replication padding, attention gates, and
concatenation layers. A diagram is provided in Fig-
ure 1.
Each encoder block applies two repetitions of:
replication padding, a convolution with a 5×5 kernel,
batch normalization, and a LeakyReLU activation (al-
pha = 0.1). The number of filters per block is 16,
32, and 64 in the contracting path, then 32 and 16 in
the expanding path to mirror the U-shape. Decoder
blocks consist of upsampling, replication padding, a
5×5 convolution with the corresponding number of
filters, batch normalization, and LeakyReLU (alpha
= 0.1).
Downsampling is performed by max pooling after
the first two encoder blocks; pooling is omitted after
the third to preserve spatial resolution. The most con-
tracted feature maps are 26×17.
In the decoder, feature maps are upsampled. At-
tention gates modulate the high-resolution encoder
features using a gating signal from the decoder before
concatenation. The concatenated features are then
processed by the decoder convolutional blocks, com-
bining local detail with global context.
The final layer uses a sigmoid activation for the
pass success model and softmax over the 104 × 68
grid for the pass likelihood model. For pass value,
we employ a softmax per grid cell with three classes
indicating outcomes within 15 seconds: goal for the
passing team, no goal, or goal for the opponent.
3.4 Model Training and Evaluation
We split the matches into training, validation, and test
sets using an 80-10-10 split for Eredivisie matches
and a 60-20-20 split for 2022 FIFA Men’s World Cup
matches. Due to the smaller size of the 2022 FIFA
Men’s World Cup dataset, we assign a higher per-
centage of samples to the validation and test sets to
enhance their statistical relevance. Table 1 shows
the distribution of successful and unsuccessful passes
across both datasets.
We first train on the larger Eredivisie dataset
and subsequently fine-tune on the 2022 FIFA Men’s
World Cup data. The training employs a cyclic learn-
ing rate, which fluctuates between a base learning rate
of 1× 10
−6
and a maximum learning rate of 1 × 10
−4
following a triangular policy with a full cycle lasting 8
epochs (Smith, 2017). This method helps to avoid lo-
cal minima. Subsequently, we fine-tune the model us-
ing data from the 2022 FIFA Men’s World Cup, where
the maximum learning rate is decreased to 1 ×10
−5
.
A batch size of 128 is used for all OJN-EPV mod-
els. Training stops when the validation loss does not
icSPORTS 2025 - 13th International Conference on Sport Sciences Research and Technology Support
102
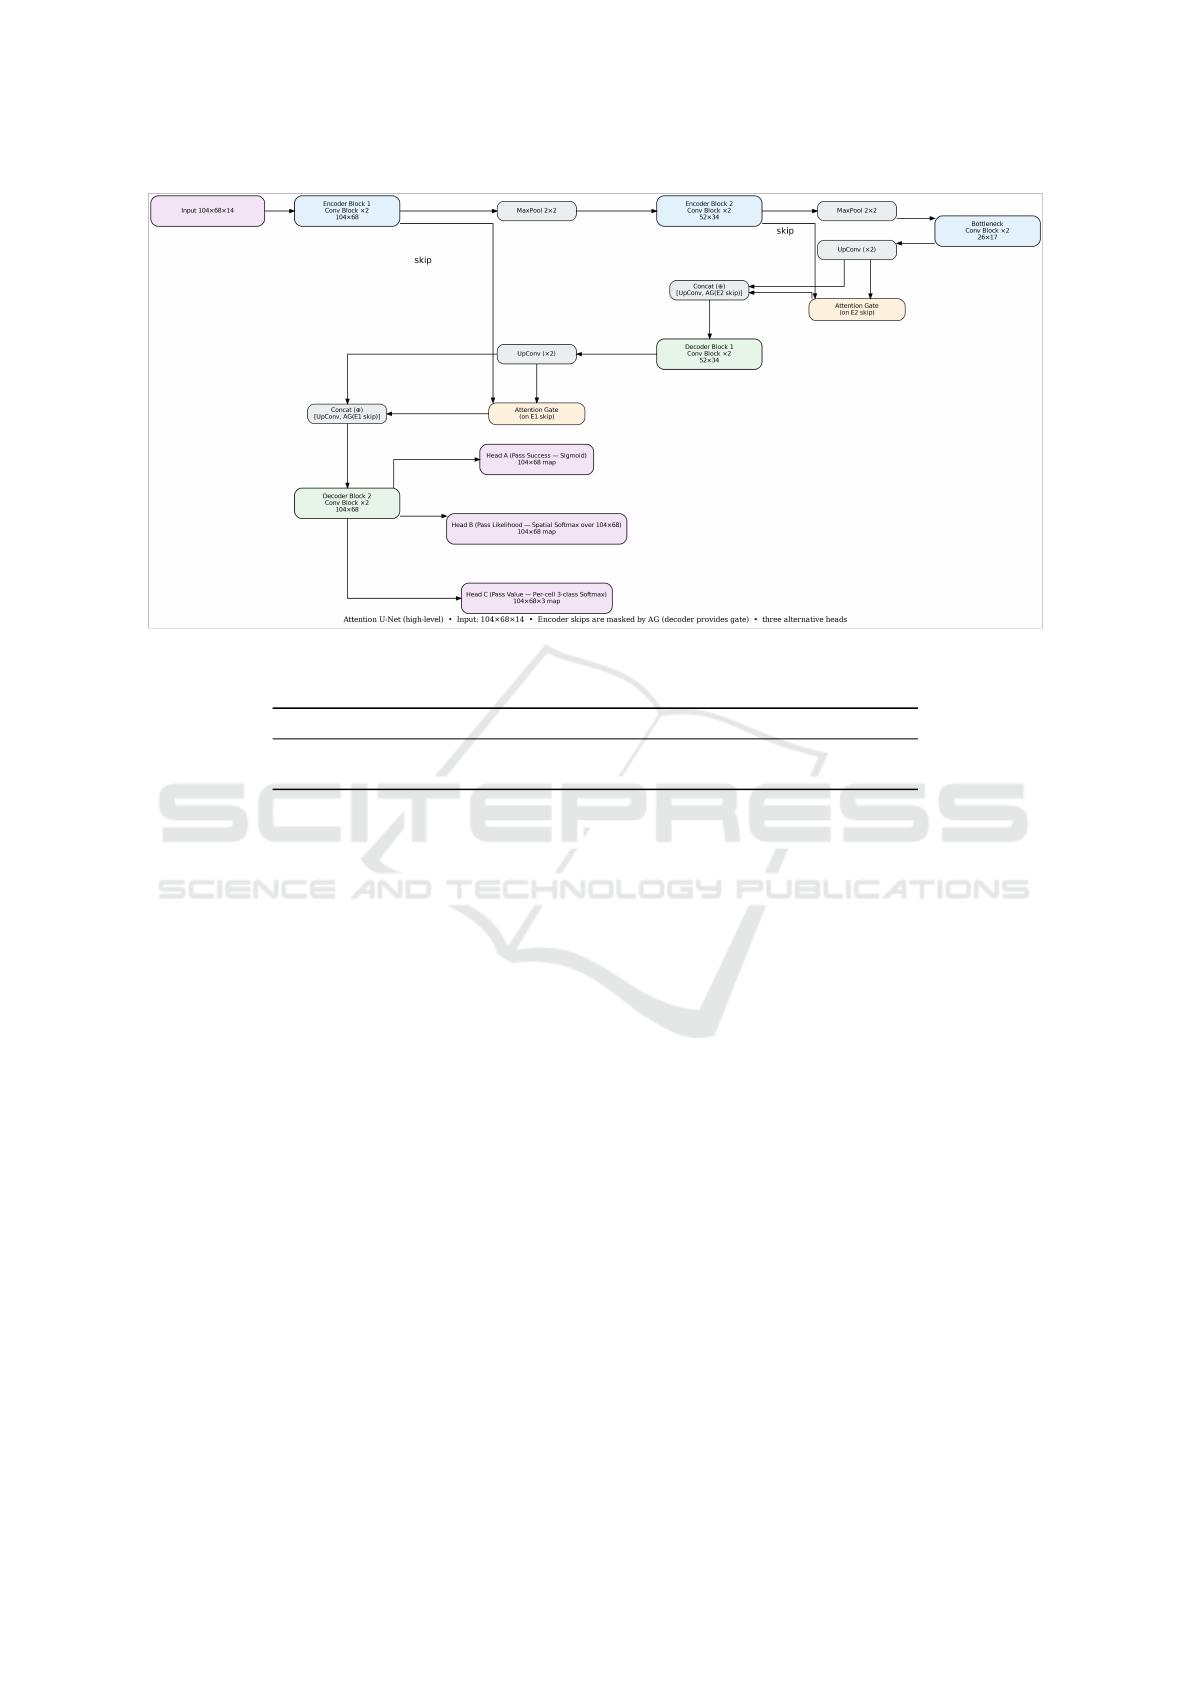
Figure 1: High-level U-Net architecture with encoder–decoder and skip connections used in OJN-EPV.
Table 1: Comparison of Successful and Unsuccessful Passes.
Dataset Total Train Val Test % Success
Eredivisie 507,953 406,495 49,542 51,916 79.79%
2022 FIFA Men’s World Cup 58,569 34,093 11,787 12,689 81.52%
improve for 8 consecutive epochs. After training con-
verges, we select the epoch that provides a suitable
balance between the loss and expected calibration er-
ror (ECE). The Adam optimizer with default settings
in TensorFlow 2.18 is employed for all models.
Both pass success and pass value models employ
temperature scaling as a post-processing step. The
optimal temperature value, ranging from 0.1 to 2 with
a step size of 0.1, is selected to minimize the ECE on
the validation set.
3.5 Optimal Pass Location
Identification
To operationalize OJN-EPV for evaluating passes (as
visualized in Figure 4), we create a pitch-wide surface
that combines pass success, pass value, and the like-
lihood of a pass arriving at each location. We restrict
the outputs to reasonably probable destinations using
a likelihood threshold.
Definition 1 (OJN-EPV Output). The model output
for location (x, y) is:
Output(x, y) =
(
V (x, y) if L(x, y) > 0.001
0 otherwise
(1)
where V (x, y) = S(x, y)V
s
(x, y) + (1 − S(x, y))V
u
(x, y)
(2)
V
s
(x, y) = P
score
(x, y|success)
− P
concede
(x, y|success) (3)
V
u
(x, y) = P
score
(x, y|no success)
− P
concede
(x, y|no success) (4)
with:
• V (x, y): estimated value of a pass that ends up at
location (x, y)
• L(x, y): likelihood that a pass ends up at location
(x, y)
• S(x, y): probability of a successful pass to (x, y)
• P
score
(x, y|success): probability of scoring after a
successful pass to (x, y)
• P
concede
(x, y|success): probability of conceding
after a successful pass to (x, y)
• P
score
(x, y|no success): probability of scoring after
an unsuccessful pass to (x, y)
• P
concede
(x, y|no success): probability of conceding
after an unsuccessful pass to (x, y)
Revisiting Expected Possession Value in Football: Introducing a U-Net Architecture, Reward and Risk for Passes, and a Benchmark
103

We set L(x, y) > 0.001 as a practical threshold in Def-
inition 1. This hyperparameter can be adjusted: lower
values surface less likely (but potentially more cre-
ative) options, whereas higher values restrict recom-
mendations to more traditional and realistic destina-
tions. This output definition enables the identification
of optimal pass locations by evaluating Output(x, y)
across all feasible locations on the pitch. The location
with the highest output value represents the model’s
recommendation for the most valuable pass option,
accounting for both the probability of successfully
executing the pass and its expected impact on scor-
ing/conceding probabilities. This practical applica-
tion is demonstrated in our analysis of real game situ-
ations (see Figure 4 in Section 5).
3.6 Benchmark Creation and
Evaluation
To enable quantitative evaluation of the performance
of EPV models, we create the OJN-Pass-EPV bench-
mark. This benchmark consists of 50 modified game
state pairs, where we use a real game state and realis-
tically alter aspects of it (e.g. player positions and ve-
locities). While this number is modest, it represents a
first step towards standardized quantitative evaluation
of pass EPV models, focusing on challenging scenar-
ios identified by experts.
We rely on a panel of three football experts, in-
cluding members of the Royal Dutch Football As-
sociation (KNVB) with backgrounds in performance
and data analysis, to assess which of the two game
states in each game state pair has a higher pass EPV.
This approach follows guidelines from Davis et al.
(2024), who emphasize expert evaluation as essential
for sports analytics validation. We focus on relative
EPVs rather than absolute EPVs, as the latter are of-
ten more subjective. In designing the benchmark, we
select game state pairs that we expect to have widely
accepted relative values, and we only include game
state pairs in the benchmark set if all three football
experts agree on their relative value.
To obtain the performance of OJN-EPV on the
benchmark, we first create a single scalar pass EPV
for a game state. For this, we take the prediction
of pass EPV over endpoints with respect to the pass
likelihood as in Definition 2 and compare the scalar
pass EPV of one game state with the modified game
state. We then report the percentage of cases where
our model ranks the game state either lower or higher
in correspondence with the ratings of the experts.
Definition 2: Scalar Pass EPV.
EPV
pass
=
∑
x,y
L(x, y)V (x, y) (5)
with V (x, y) as in Definition 1.
4 RESULTS
This section presents our main results and findings,
beginning with a feature ablation study. Building
upon the optimal feature set identified, we subse-
quently present the results of an architectural study
aimed at determining the ideal number of parame-
ters for OJN-EPV. The best-performing architecture
is then employed to evaluate the performance of the
resulting model. Losses and calibration metrics in this
section are computed on held-out splits of the Eredi-
visie and 2022 FIFA Men’s World Cup datasets (Ta-
bles 2 and 3). The OJN-Pass-EPV benchmark in Sec-
tion 4.6 is a separate, expert-validated set of 50 paired
game states used only for relative evaluation.
4.1 Feature Ablation Study
In our feature ablation study, we investigate the ef-
fects of various feature combinations on model per-
formance. Across all models, adding features beyond
the fundamental features (i) player positions and ve-
locities, (ii) distance to the ball for every location, and
(iii) ball height, yield only negligible performance
gains in aggregate metrics such as loss and ECE. In
practice, the only additional features we include are
distance to goal and angle to goal. Closer inspec-
tion of the value models, including visual evaluations
of predicted probability surfaces, reveals that these
two features substantially improve contextual accu-
racy. Without them, the model underestimates value
in scenarios near the penalty area. We retain these
features specifically because they improve benchmark
performance even when global loss and calibration
change only marginally.
4.2 Architecture Study
To validate the model architecture, we examine var-
ious setups, specifically focusing on the number of
filters (8, 16, 32) and the filter dimensions (3x3,
5x5). We find that using only 8 filters significantly
reduces performance for all models except the pass
value models. For the models using 32 filters, we
find that these models do show slightly better per-
formance compared to the models using 16 filters,
but due to only slight improvements and significantly
more parameters, we choose to use 16 filters with di-
mension 5x5 for the OJN-EPV model. This configu-
ration results in 372,355 parameters for the pass suc-
cess model, 372,359 for the pass likelihood model,
icSPORTS 2025 - 13th International Conference on Sport Sciences Research and Technology Support
104
and 373,201 parameters for both pass value models
(successful and unsuccessful).
4.3 Model Performance
This section assesses the performance of the OJN-
EPV model, focusing on the loss and calibration met-
rics. We use ECE with 10 bins as the calibration met-
ric. To enhance model calibration, we apply tem-
perature scaling to the pass success and pass value
models. All models, except one, demonstrate optimal
calibration with a temperature of 1.0, indicating no
need for temperature scaling. Only the value unsuc-
cessful model, trained and validated on the Eredivisie
data, exhibits improved calibration with a temperature
value of 1.1. We do not report ECE for the pass likeli-
hood surface, because it is a spatial distribution (soft-
max over 104 × 68 endpoints) rather than a binary
probability; bin-based calibration is not well-posed
for this output. Table 2 presents the overall perfor-
mance metrics for models trained on Eredivisie data,
while Table 3 shows results for models fine-tuned on
2022 FIFA Men’s World Cup data. Loss and ECE
curves remain stable over epochs, indicating consis-
tent convergence behavior.
The detailed loss per class based on the value
model, as shown in Tables 4 and 5, provides a com-
prehensive representation of the model’s nuanced un-
derstanding of pass outcomes. Low loss and calibra-
tion scores demonstrate the model’s proficiency in ac-
curately forecasting whether a pass will result in scor-
ing a goal, conceding a goal, or no goal at all within
a window of 15 seconds for the team in possession of
the ball.
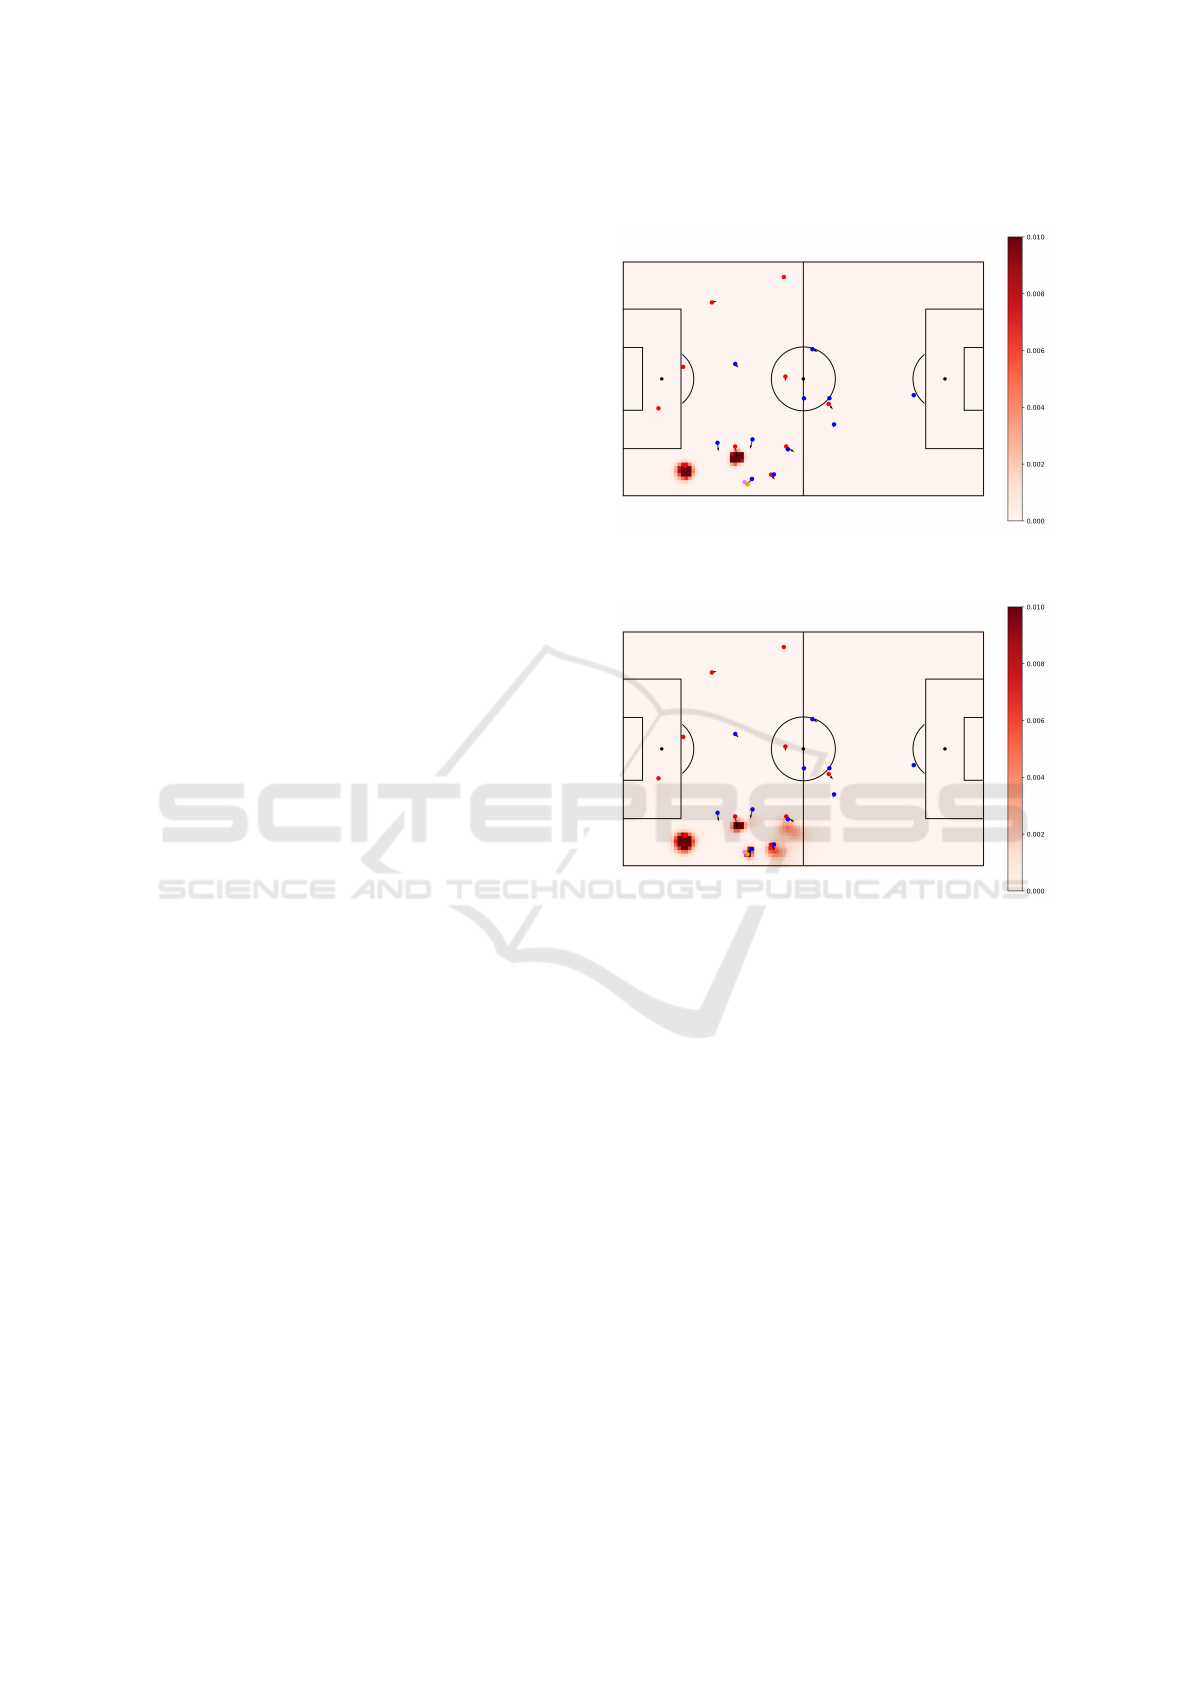
4.4 Influence of Ball Height on
Predictions
Incorporating the ball’s height (z-axis) into the model
significantly impacts the pass likelihood predictions
by adding the crucial vertical dimension to the anal-
ysis. Figure 2 illustrates this by contrasting two sce-
narios: a ground pass (Figure 2a) and an aerial pass
with the ball at 2 meters high (Figure 2b). When
trained without the ball height feature on the Eredi-
visie dataset, the pass likelihood model achieves a
loss of 4.7478, compared to 4.7225 with ball height
included (as shown in Table 2). While this aggre-
gate metric shows only minor changes, reflecting the
relative rarity of aerial passes, Figure 2 demonstrates
the practical importance of considering ball height for
specific passing situations, where the model recog-
nizes that aerial passes can be made over opponents
while also showing increased uncertainty about the
pass destination.
(a) Ground pass scenario (z=0 m). Red team in possession;
yellow dot marks the ball carrier belonging to the red team;
pink dot marks the ball.
(b) Aerial pass scenario (z=2 m). Same game state as top
panel but with the ball at 2 meters in the z-axis.
Figure 2: Impact of ball height on pass likelihood pre-
diction. Top: ground pass (z=0 m) with blocked passing
lanes; Bottom: same state with an aerial pass (z=2 m) that
can be played over defenders. Aerial passes yield broader,
more diffuse likelihoods, reflecting lower precision relative
to ground passes.
4.5 Risk and Reward Decomposition
Decomposing pass EPV into reward and risk compo-
nents offers a more nuanced perspective on the com-
plexities of passing decisions in football. By sepa-
rating the potential positive and negative impacts of a
pass, we can gain deeper insights into the underlying
volatility of seemingly straightforward game states.
Figure 3 depicts one such game state, where the de-
composition of EPV reveals the trade-offs inherent in
a passing decision.
In this game state, the pass value model trained
on successful passes assigns a slightly negative over-
all value (i.e., -0.0047) for the end location of the
Revisiting Expected Possession Value in Football: Introducing a U-Net Architecture, Reward and Risk for Passes, and a Benchmark
105
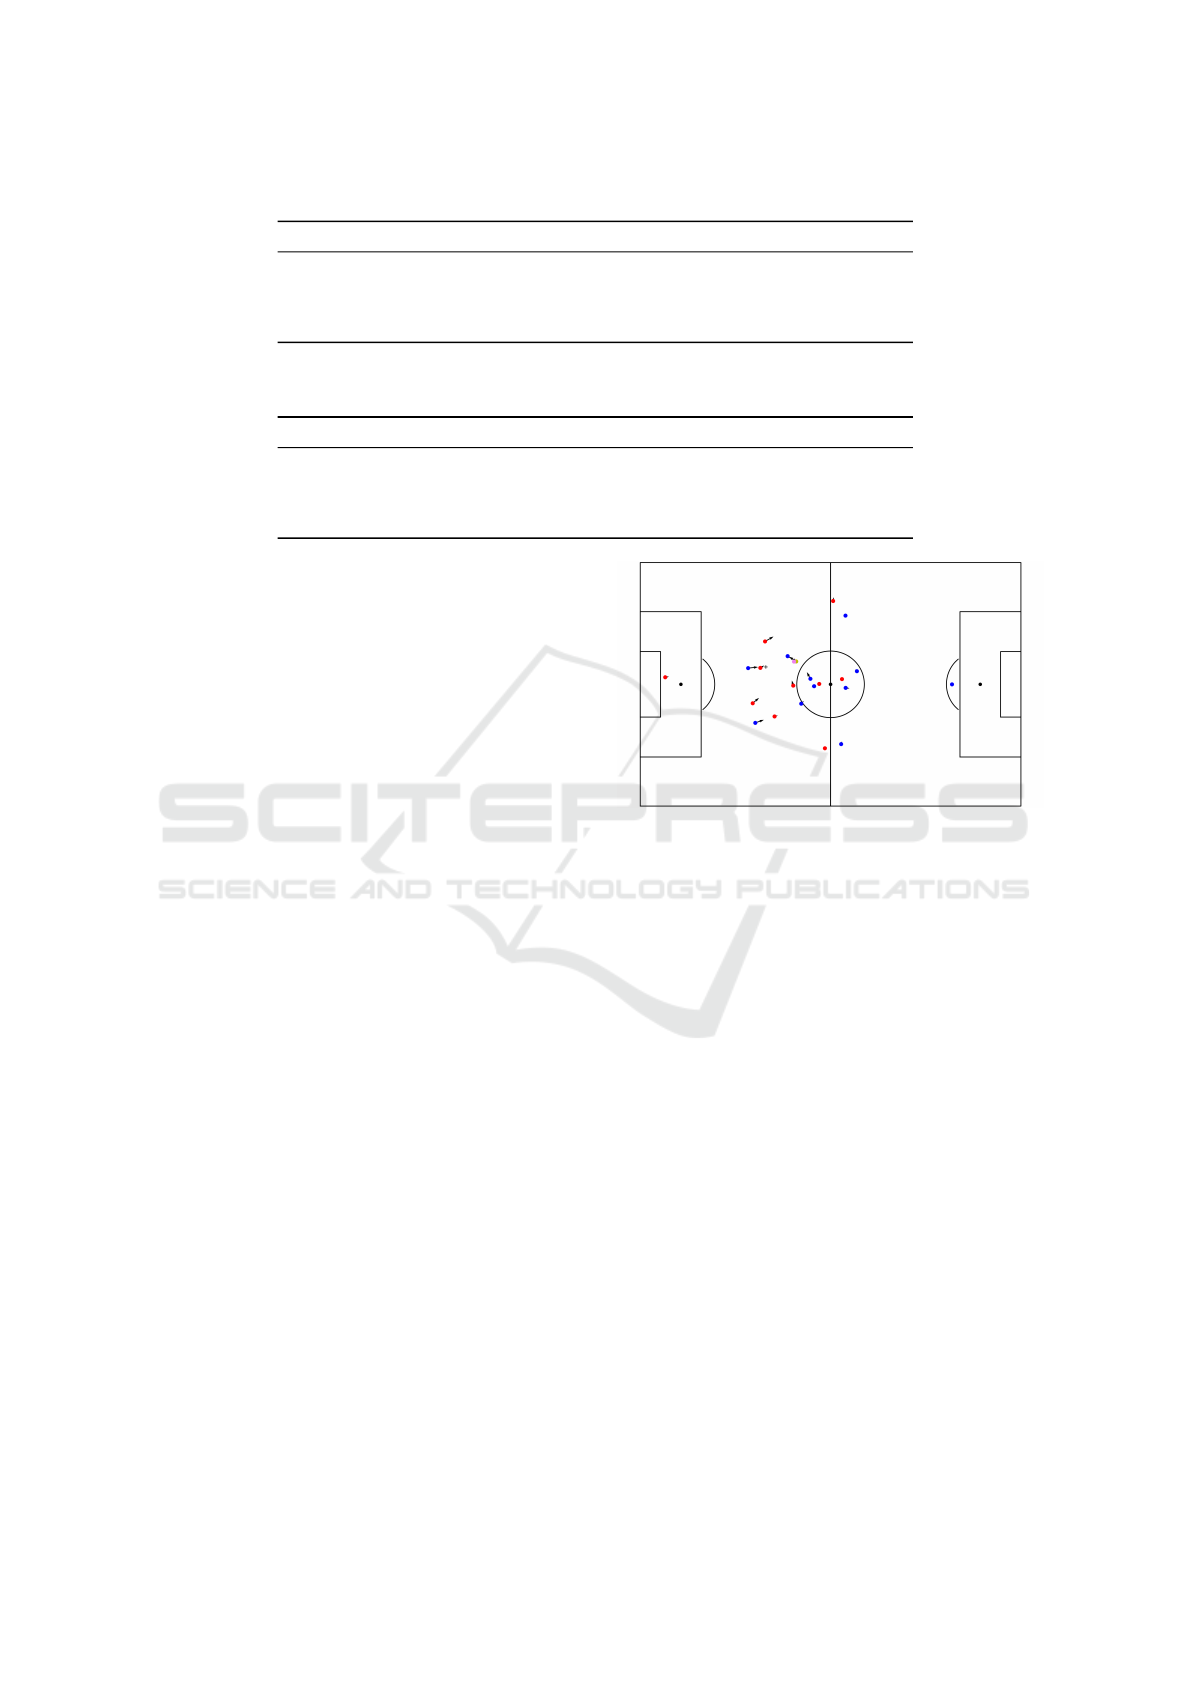
Table 2: Loss and ECE on both datasets for models trained on Eredivisie data. Note: ERE = Eredivisie; WC = World Cup.
Model Loss (ERE) ECE (ERE) Loss (WC) ECE (WC)
Pass Success 0.1558 0.0024 0.1355 0.0122
Pass likelihood 4.7225 - 4.4528 -
Pass Value (Successful) 0.0689 0.0016 0.0835 0.0060
Pass Value (Unsuccessful) 0.0663 0.0042 0.0726 0.0056
Table 3: Loss and ECE on both datasets for models fine-tuned on 2022 FIFA Men’s World Cup data. Note: ERE = Eredivisie;
WC = World Cup.
Model Loss (ERE) ECE (ERE) Loss (WC) ECE (WC)
Pass Success 0.1568 0.0090 0.1326 0.0047
Pass likelihood 4.7227 - 4.4367 -
Pass Value (Successful) 0.0687 0.0024 0.0836 0.0065
Pass Value (Unsuccessful) 0.0671 0.0045 0.0740 0.0050
pass marked with a ”+”. This implies that even if the
pass is completed, the blue team is still considered
more likely to score within 15 seconds than the red
team. Building on nuanced risk-reward assessments
in passing, such as Goes et al. (2022) who quantified
risk via interception probability and reward through
multiple tactical factors, our analysis, grounded in the
EPV framework, offers a complementary perspective
focused on ultimate outcomes. Instead of solely fo-
cusing on pass completion or immediate tactical ad-
vantage, we decompose the predicted pass value into
’reward’ (the probability of scoring within 15 sec-
onds) and ’risk’ (the probability of conceding within
15 seconds). This direct link to future goal events
allows for evaluating the potential volatility and net
goal impact inherent in different passing options, dis-
tinct from the immediate risk of turnover or specific
tactical gains. Even a successful pass can lead to an
unpredictable game state, potentially detrimental for
the team in possession, depending on factors such as
opponent pressure. This assessment is based on po-
tential outcomes: the blue team has a 0.0199 proba-
bility of scoring compared to 0.0152 for the red team.
This analysis illustrates the complex trade-offs that
can be present in passing decisions.
OJN-EPV quantifies these potential outcomes (re-
ward vs. risk for different options) to inform player
and coach decision-making, rather than prescribing a
single ’best’ action, which may depend on factors be-
yond the model’s scope (e.g., game state, tactical in-
structions, individual player risk tolerance).
4.6 Benchmark Performance and
Validation
Before incorporating distance to goal and angle to
goal features in our pass value models, the benchmark
performance for the model trained only on the Ere-
Figure 3: Pass value decomposition in a single game state.
Red team is in possession; the ball carrier is marked with a
yellow dot; the intended pass destination is marked by ”+”.
The example illustrates how OJN-EPV can assign slightly
negative overall value even for a completed pass when con-
ceding risk outweighs reward in the horizon of 15 seconds.
divisie dataset is 68% on the OJN-Pass-EPV bench-
mark, rising to 70% after fine-tuning on the 2022
FIFA Men’s World Cup data. Once we add these
two features, the global loss and calibration metrics
do not show a pronounced improvement. However,
the benchmark performance for both the Eredivisie-
trained and 2022 FIFA Men’s World Cup fine-tuned
models increases to 78%.
5 DISCUSSION
This section discusses our findings and their implica-
tions for football analytics.
5.1 Technical Achievements
5.1.1 U-Net Architecture Performance
Our results indicate that the U-Net architecture deliv-
ers strong performance on the OJN-Pass-EPV bench-
icSPORTS 2025 - 13th International Conference on Sport Sciences Research and Technology Support
106

Table 4: Pass value model - loss and ECE by class for model trained on Eredivisie data.
Class Loss (Eredivisie) ECE (Eredivisie) Loss (WC) ECE (WC)
Scoring goal (Successful) 0.0590 0.0018 0.0689 0.0048
No goal (Successful) 0.0660 0.0040 0.0791 0.0035
Conceding goal (Successful) 0.0096 0.0023 0.0144 0.0022
Scoring goal (Unsuccessful) 0.0379 0.0060 0.0357 0.0074
No goal (Unsuccessful) 0.0620 0.0105 0.0663 0.0134
Conceding goal (Unsuccessful) 0.0271 0.0041 0.0362 0.0062
Table 5: Pass value model - loss and ECE by class for model fine-tuned on 2022 FIFA Men’s World Cup data.
Class Loss (Eredivisie) ECE (Eredivisie) Loss (WC) ECE (WC)
Scoring goal (Successful) 0.0590 0.0011 0.0693 0.0057
No goal (Successful) 0.0658 0.0032 0.0793 0.0042
Conceding goal (Successful) 0.0093 0.0021 0.0141 0.0020
Scoring goal (Unsuccessful) 0.0385 0.0064 0.0366 0.0081
No goal (Unsuccessful) 0.0619 0.0095 0.0661 0.0125
Conceding goal (Unsuccessful) 0.0272 0.0039 0.0365 0.0058
mark. Its effectiveness stems from the U-Net’s abil-
ity to first capture broad, contextual information like
the overall team formation in its encoder, and then
re-integrate fine-grained local details, such as player
proximity, using skip connections to produce a spa-
tially precise output.
The choice of 16 filters with 5x5 kernels balances
model complexity and performance. While 32 filters
give marginal gains, the parameter cost is dispropor-
tionate.
5.1.2 Ball Height Impact
Incorporating ball height improves the model’s abil-
ity to distinguish between ground and aerial passes.
As shown in the Results, the model recognizes that
aerial passes can bypass defenders while exhibiting
increased spatial uncertainty, aligning with domain
knowledge that headers are less precise than ground
passes.
5.1.3 Risk-Reward Decomposition
Decomposing pass value into separate reward and
risk components provides a more nuanced view than
single-value EPV approaches. By quantifying the
probability of scoring (reward) and conceding (risk)
for both successful and unsuccessful passes, the
model surfaces the volatility of different options.
5.2 Methodological Considerations
5.2.1 Benchmark Design
The OJN-Pass-EPV benchmark represents a first step
toward standardized evaluation in EPV modeling.
By focusing on relative comparisons between paired
game states rather than absolute values, we reduce
subjectivity in target labels. Unanimous expert agree-
ment ensures high-confidence ground truth, though it
limits the set to 50 pairs. The public repository in-
cludes the 50 paired states and the expert selections.
5.2.2 Training Strategy
We train on Eredivisie data and fine-tune on 2022
FIFA Men’s World Cup data; similar qualitative
behavior across both suggests the model captures
general football principles rather than competition-
specific patterns.
5.3 Comparison with Previous Work
Attempting to implement the Fern
´
andez et al. (2021)
model as a baseline encountered vanishing gradients
during training, preventing a direct comparison and
motivating our U-Net approach with skip connections
and LeakyReLU activations (Glorot et al., 2011).
The OJN-Pass-EPV benchmark provides a quanti-
tative measure previously unavailable in the field. In-
corporating distance and angle to goal improves rel-
ative value assessment even when aggregate loss and
calibration metrics change only marginally.
5.4 Practical Implications
We illustrate how our model can be employed as a
decision support tool, utilizing Definition 1 by eval-
uating the model surface across the pitch (Figure 4).
In this figure, we demonstrate the locations that our
model estimates to be optimal based on the current
game state. As previously discussed in subsection 4.5,
these outputs should be considered a supportive tool
Revisiting Expected Possession Value in Football: Introducing a U-Net Architecture, Reward and Risk for Passes, and a Benchmark
107
for practitioners, taking into account current limita-
tions, such as the model’s player-agnostic nature.
Beyond benchmark accuracy, OJN-EPV supports
player- and team-level decision profiling. At the
player level, analysts can quantify a risk profile by
measuring the share of high-variance options (high
risk–high reward) selected relative to available al-
ternatives, and detect systematic biases toward con-
servative choices. At the team level, aggregated
risk–reward tendencies reveal phase- or opponent-
specific strategies (e.g., increased aerial risk under
high press). These diagnostics help align coaching
intent with on-pitch execution.
Figure 4: Decision analysis with OJN-EPV. Red team is
in possession; the ball carrier is marked with a yellow dot.
The player’s actual pass destination is marked by ”+”; the
model-recommended optimal location is circled (Definition
1). The comparison highlights potential areas for decision-
making refinement.
OJN-EPV supports applied analysis across the
match cycle: pre-match scouting of opponent passing
patterns, half-time assessment of risk-taking shifts,
post-match comparison of actual decisions to model
surfaces.
5.5 Limitations & Future Work
Three benchmark errors are attributable to offside;
rule-aware masking of offside receivers at pass start
would likely correct these cases. Offside is defined for
receivers at pass start, not for abstract endpoints, so a
location-only mask is inadequate. A practical remedy
is a post-processing step that assigns candidate end-
points to intended receivers and sets S(x, y) = 0 for
receivers who are offside at pass start.
Future work includes implementing explicit off-
side handling via receiver-aware masking, expanding
the OJN-Pass-EPV set beyond 50 pairs, increasing
spatial resolution beyond 1 m to capture finer nuances,
and developing player-specific models that account
for individual abilities and preferences.
6 CONCLUSION
We present OJN-EPV with four core contributions:
a U-Net architecture for spatial EPV at modest scale
( 372K parameters), incorporation of ball height to
distinguish aerial from ground passes, a risk-reward
decomposition defined for both successful and un-
successful passes, and the OJN-Pass-EPV benchmark
of 50 expert-validated pairs for standardized, relative
evaluation.
Our model demonstrates strong performance
across both Eredivisie and World Cup datasets,
achieving low loss, robust calibration, and 78% accu-
racy on our benchmark. These results affirm the value
of each contribution: the U-Net architecture produces
high-quality spatial EPV surfaces, ball height integra-
tion refines pass predictions, the risk-reward frame-
work offers actionable insights, and the benchmark
provides a necessary tool for standardized evaluation,
thereby answering RQ1–RQ4.
To foster transparency and drive further innova-
tion, the OJN-Pass-EPV dataset is publicly available
at https://github.com/EAISI/OJN-EPV-benchmark.
This resource provides the community with a stan-
dardized tool to rigorously compare and validate
new EPV models, moving beyond aggregate met-
rics toward expert-aligned relative assessments.
Ultimately, this work not only introduces a novel,
high-performing EPV model but also establishes
a more robust methodological foundation for its
evaluation, setting a new baseline for future research
in football analytics.
ACKNOWLEDGEMENTS
We thank the Royal Dutch Football Association
(KNVB) for providing data access and the expert
panel for benchmark validation. We used OpenAI’s
GPT-4 to review the manuscript for grammar and
spelling. No content, data, code, figures, or results
were generated or altered by AI tools; the authors re-
main fully responsible for the content.
REFERENCES
Anzer, G. and Bauer, P. (2022). Expected passes: Determin-
ing the difficulty of a pass in football (soccer) using
spatio-temporal data. Data Mining and Knowledge
Discovery, 36(1):295–317.
Bransen, L., Haaren, J. V., and van de Velden, M. (2019).
Measuring soccer players’ contributions to chance
creation by valuing their passes. Journal of Quanti-
tative Analysis in Sports, 15(2):97–116.
icSPORTS 2025 - 13th International Conference on Sport Sciences Research and Technology Support
108

Davis, J., Bransen, L., Devos, L., Jaspers, A., Meert, W.,
Robberechts, P., Van Haaren, J., and Van Roy, M.
(2024). Methodology and evaluation in sports ana-
lytics: Challenges, approaches, and lessons learned.
Machine Learning, 113(9):6977–7010.
Decroos, T., Bransen, L., Van Haaren, J., and Davis, J.
(2019). Actions speak louder than goals: Valuing
player actions in soccer. In Proceedings of the 25th
ACM SIGKDD International Conference on Knowl-
edge Discovery & Data Mining, pages 1851–1861.
Fern
´
andez, J., Bornn, L., and Cervone, D. (2019). Decom-
posing the immeasurable sport: A deep learning ex-
pected possession value framework for soccer. In 13th
MIT Sloan Sports Analytics Conference.
Fern
´
andez, J., Bornn, L., and Cervone, D. (2021). A frame-
work for the fine-grained evaluation of the instanta-
neous expected value of soccer possessions. Machine
Learning, 110(6):1389–1427.
Glorot, X., Bordes, A., and Bengio, Y. (2011). Deep
sparse rectifier neural networks. In Gordon, G., Dun-
son, D., and Dud
´
ık, M., editors, Proceedings of the
Fourteenth International Conference on Artificial In-
telligence and Statistics (AISTATS), volume 15, pages
315–323, Fort Lauderdale, FL, USA. PMLR.
Goes, F., Schwarz, E., Elferink-Gemser, M., Lemmink,
K., and Brink, M. (2022). A risk-reward assessment
of passing decisions: comparison between positional
roles using tracking data from professional men’s soc-
cer. Science and Medicine in Football, 6(3):372–380.
H
˚
aland, E. M., Wiig, A. S., St
˚
alhane, M., and Hvattum,
L. M. (2020). Evaluating passing ability in association
football. IMA Journal of Management Mathematics,
31(1):91–116.
Link, D., Lang, S., and Seidenschwarz, P. (2016). Real
time quantification of dangerousity in football us-
ing spatiotemporal tracking data. PLOS ONE,
11(12):e0168768.
Linke, D., Link, D., and Lames, M. (2020). Football-
specific validity of tracab’s optical video tracking sys-
tems. PLOS ONE, 15(3):1–17.
Power, P., Ruiz, H., Wei, X., and Lucey, P. (2017). Not
all passes are created equal: Objectively measuring
the risk and reward of passes in soccer from tracking
data. In Proceedings of the 23rd ACM SIGKDD In-
ternational Conference on Knowledge Discovery and
Data Mining, pages 1605–1613, Halifax, NS, Canada.
Association for Computing Machinery.
Ronneberger, O., Fischer, P., and Brox, T. (2015). U-
net: Convolutional networks for biomedical im-
age segmentation. In Medical Image Computing
and Computer-Assisted Intervention–MICCAI 2015,
pages 234–241. Springer.
Rudd, S. (2011). A framework for tactical analysis and in-
dividual offensive production assessment in soccer us-
ing markov chains. NESSIS 2011 presentation. (Ac-
cessed April 8, 2025).
Singh, K. (2019). Expected threat. Online Resource.
Smith, L. N. (2017). Cyclical learning rates for training
neural networks. In 2017 IEEE Winter Conference on
Applications of Computer Vision (WACV), pages 464–
472. IEEE.
Revisiting Expected Possession Value in Football: Introducing a U-Net Architecture, Reward and Risk for Passes, and a Benchmark
109
