
Real-Time Automated Visual Inspection of Decorative Wood Panels for
Zero Defects Manufacturing
Beatriz Coutinho
1 a
, Tom
´
as Martins
2 b
, Eliseu Pereira
1 c
and Gil Gonc¸alves
1 d
1
SYSTEC ARISE, Faculdade de Engenharia, Universidade do Porto, Rua Dr. Roberto Frias, 4200-465 Porto, Portugal
2
Faculdade de Engenharia, Universidade do Porto, Rua Dr. Roberto Frias, 4200-465 Porto, Portugal
Keywords:
Computer Vision, Defect Detection, Quality Monitoring, Non-Destructive Inspection, Zero Defects
Manufacturing.
Abstract:
In the wood panel manufacturing industry, maintaining high product quality is critical to ensure customer sat-
isfaction and minimize resource waste. Manual quality inspection methods are often inconsistent, increasing
the risk of defective panels reaching the market. This paper introduces an automated visual inspection system
for decorative wood panels, aligned with the Detection strategy of the Zero Defects Manufacturing (ZDM)
framework. Designed for real-time deployment on an NVIDIA Jetson Nano, the system inspects panels inde-
pendently without disrupting the production line and visually highlights detected defects for operator review.
Two implementation approaches were explored and compared: a traditional computer vision pipeline and a
deep learning-based solution. Due to the limited availability of real-world defect images, a synthetic dataset
was created using patch blending, tiling, and diverse augmentations to improve the model’s generalization
across spatial variations. Experimental evaluation with static images and live video showed that while tradi-
tional methods achieve moderate detection accuracy, they fail under varying lighting and camera angles. In
contrast, the YOLO-based approach delivered robust segmentation and superior defect detection, even under
challenging conditions. These results highlight the system’s potential to assist operators during manual in-
spections and contribute to practical advances to achieve ZDM.
1 INTRODUCTION
In today’s highly competitive industrial environment,
quality assurance plays a crucial role in manufactur-
ing, ensuring that products meet rigorous specifica-
tions and customer expectations (Hoffmann and Re-
ich, 2023). If defective products reach customers, it
can lead not only to economic losses and a decline
in customer trust, but also to a significant waste of
resources (Psarommatis et al., 2023). Consequently,
adopting rigorous quality inspection procedures is
one of the most effective ways for companies to min-
imize losses and operate in a more environmentally
conscious way.
This is particularly relevant in the wood panel
industry, where surface defects such as cracks, dis-
colorations, and scratches can compromise both the
a
https://orcid.org/0009-0000-9769-6726
b
https://orcid.org/0009-0008-9771-0688
c
https://orcid.org/0000-0003-3893-3845
d
https://orcid.org/0000-0001-7757-7308
aesthetic and functional quality of the final product.
While manual quality inspection remains common,
these methods often suffer from limitations includ-
ing low efficiency, subjectivity, and inconsistent re-
sults (Li et al., 2024).
To address these challenges, manufacturers are in-
creasingly adopting the Zero Defects Manufacturing
(ZDM) concept, which enables companies to proac-
tively reduce the occurrence of defects and the de-
livery of poor-quality products by implementing four
main strategies: Detection, Repair, Prediction, and
Prevention (Caiazzo et al., 2022). Detection and Re-
pair are reactive strategies aimed at identifying and
correcting defects after they occur. In contrast, Pre-
diction and Prevention focus on anticipating qual-
ity issues and implementing process improvements
to completely avoid defects. Although each strat-
egy independently contributes to better manufactur-
ing performance (Fragapane et al., 2023), their com-
bined application can significantly enhance produc-
tion throughput and reduce resource waste.
This paper presents the development of an auto-
446
Coutinho, B., Martins, T., Pereira, E. and Gonçalves, G.
Real-Time Automated Visual Inspection of Decorative Wood Panels for Zero Defects Manufacturing.
DOI: 10.5220/0013782200003982
Paper published under CC license (CC BY-NC-ND 4.0)
In Proceedings of the 22nd International Conference on Informatics in Control, Automation and Robotics (ICINCO 2025) - Volume 2, pages 446-456
ISBN: 978-989-758-770-2; ISSN: 2184-2809
Proceedings Copyright © 2025 by SCITEPRESS – Science and Technology Publications, Lda.

mated visual quality inspection system aligned with
the Detection strategy of the ZDM framework. The
system has been designed for deployment at the final
stage of decorative surfaced wood panel production,
in collaboration with Sonae Arauco, a Portuguese
manufacturer. Prediction and Prevention strategies
for this production process have been previously de-
veloped and detailed in (Coutinho et al., 2024). The
proposed detection system is not intended to replace
human inspection, but rather to enhance it using com-
puter vision (CV) technology to provide real-time, ac-
curate defect identification and thereby support more
informed decision-making. Two implementation ap-
proaches were explored and benchmarked: one based
on traditional CV techniques and other using deep
learning (DL) methods.
The remainder of this paper is organized as fol-
lows: Section 2 presents the literature review. Sec-
tion 3 describes the methodology. Section 4 outlines
the system implementation. Section 5 presents and
discusses the experimental results, and Section 6 pro-
vides the conclusions and future work.
2 BACKGROUND AND RELATED
WORK
Combining automated detection-based systems
with manual inspection processes enhances hu-
man–machine collaboration and improves the overall
process (Lario et al., 2025). This combined approach
not only enables more efficient and accurate quality
control but also acts as a two-step verification,
reducing human error and minimizing the risk of
defective products passing undetected. Industry
trends increasingly favor AI-based solutions for
quality assurance, with CV playing a major role due
to its ability to deliver fast and consistent results (Li
et al., 2024).
CV methods can be categorized into traditional
and DL techniques (O’Mahony et al., 2020). Tradi-
tional methods rely on techniques like filtering and
edge detection to extract features. While these tech-
niques perform well on well-defined and simple tasks,
they often struggle with variability in product appear-
ance or complex defect patterns (Li et al., 2024).
These methods are also highly domain-specific, re-
quiring manual tuning and expert knowledge for each
application. DL methods, in contrast, are more adapt-
able and capable of handling a wider range of in-
spection challenges, as they can learn directly from
raw image data. This ability to learn and gen-
eralize from data makes DL approaches typically
more scalable and effective across diverse use cases
(O’Mahony et al., 2020). In particular, architectures
such as Convolutional Neural Networks (CNNs), Au-
toencoder Neural Networks (AeNNs), Deep Resid-
ual Neural Networks (DRNNs), Fully Convolutional
Neural Networks (FCNNs), and Recurrent Neural
Networks (RNNs) have become especially prominent
in defect detection within smart manufacturing (Jia
et al., 2024). Figure 1 illustrates the main differ-
ences in workflow between traditional CV and DL ap-
proaches.
In the wood industry, particularly in the produc-
tion of melamine-faced panels, several studies have
explored the use of CV methods for defect detection
on finished products. Some of these contributions are
analyzed below.
Li et al. (2024) (Li et al., 2024) proposed a CV
framework based on an improved YOLOv8 model
to detect three types of defects in melamine-faced
panels: edge breakage, scratches, and surface dam-
age. To address the severe class imbalance in the
collected dataset, data augmentation and equalization
techniques were applied. These included the use of
a Generative Adversarial Network (GAN) to gener-
ate synthetic defect images, as well as oversampling
methods.
The YOLOv8, a single-stage object detection
model built on CNNs, was enhanced by incor-
porating depth-separable convolutions (DSC), De-
formable Convolutional Networks (DCN), an Ef-
ficient Multiscale Attention (EMA) mechanism, a
Bi-directional Feature Pyramid Network (BiFPN),
and customized loss functions. These modifications
led to performance improvements over the baseline
model, achieving an overall mean average precision
(mAP@50) of 78%, precision of 84%, and recall of
78%. The resulting system demonstrated robustness
and efficiency in detecting subtle and irregular surface
defects.
Aguilera et al. (Aguilera et al., 2018) investigated
defect classification in melamine-faced panels using
multispectral images from the visible, near-infrared
(NIR), and long-wavelength infrared spectrums. A
feature descriptor learning approach combined with
a Support Vector Machine (SVM) classifier was ap-
plied, evaluating two descriptors: Extended Local Bi-
nary Patterns (E-LBP) and SURF, both using a Bag
of Words representation. The dataset included five
defect types: paper scraps, stains, white spots, paper
displacement, and bubbles. Data augmentation tech-
niques such as rotation, scaling, noise addition, and
translation were used to expand the training data.
Three experiments were conducted: using each
spectral band separately, combining bands through
early fusion (averaging images), and late fusion (com-
Real-Time Automated Visual Inspection of Decorative Wood Panels for Zero Defects Manufacturing
447
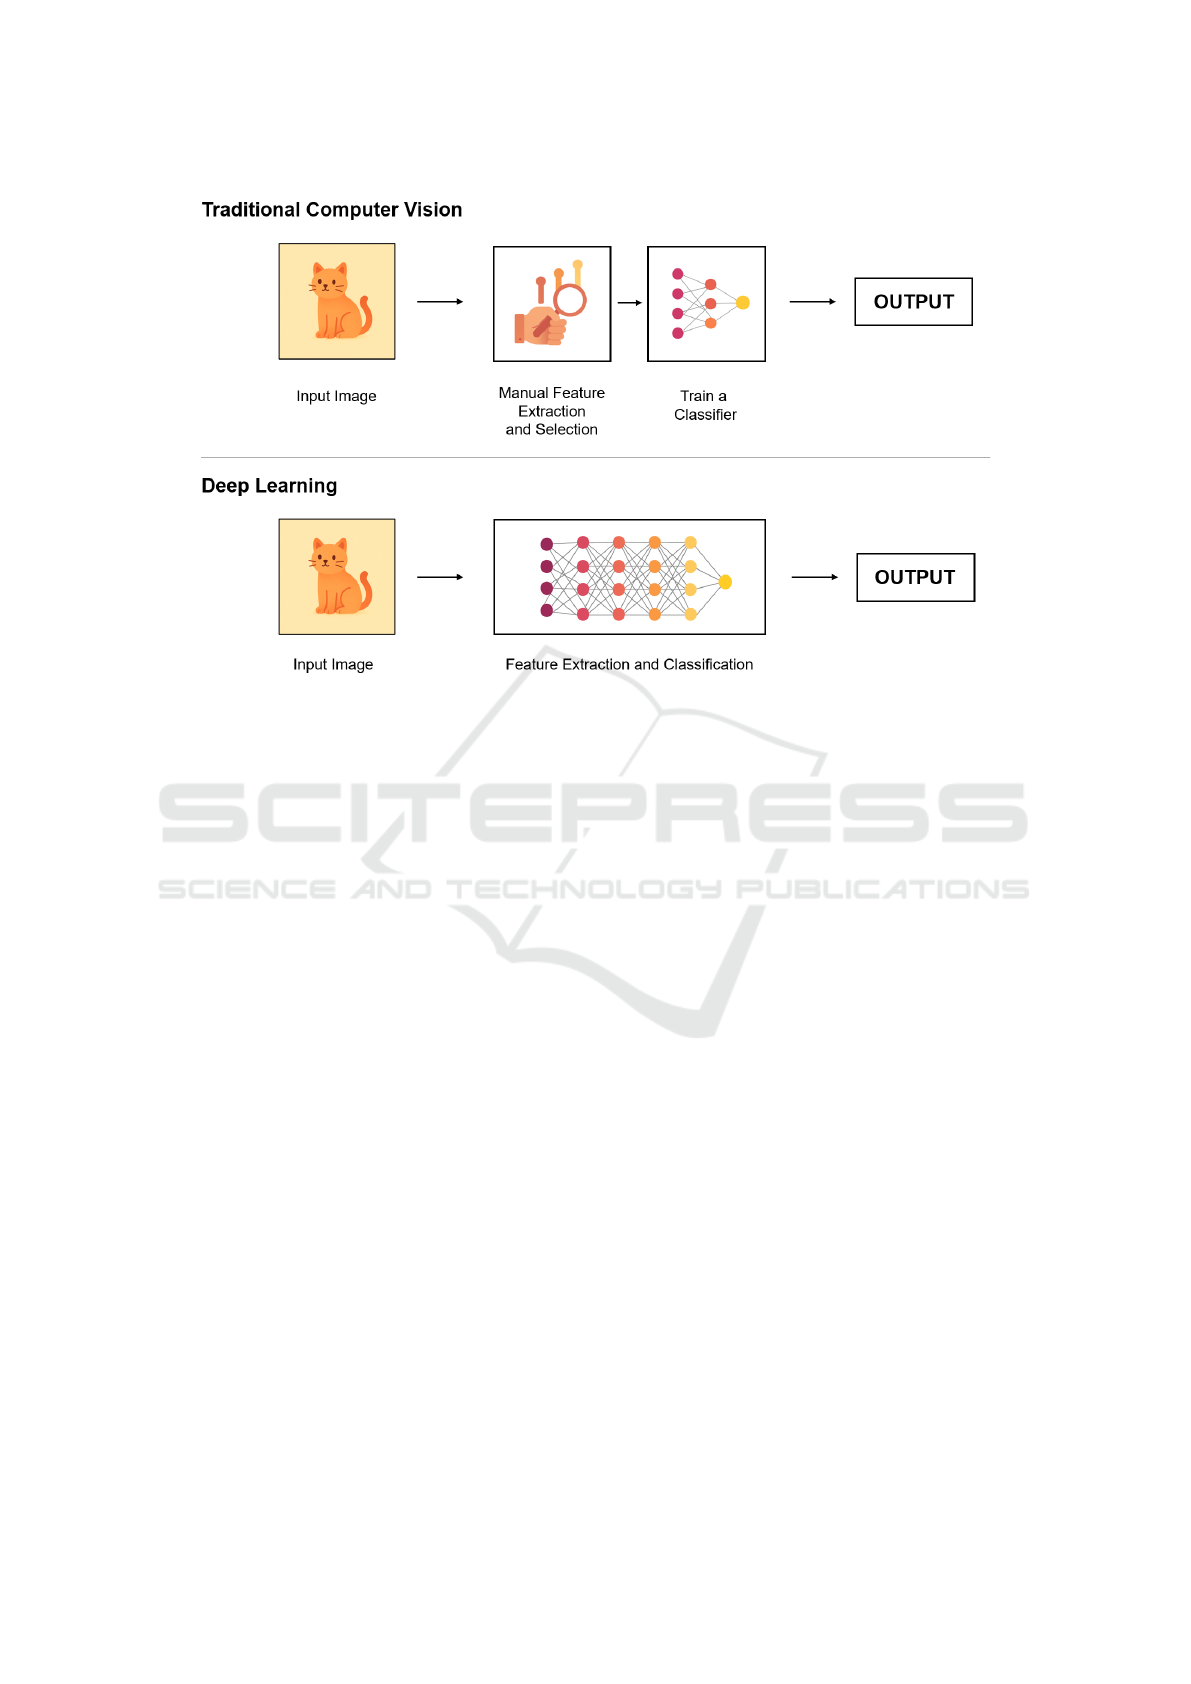
Figure 1: Traditional computer vision versus deep learning workflow.
bining descriptors). Results showed that combining
spectral bands, especially incorporating information
beyond the visible spectrum, significantly improved
classification performance compared to using visible
images alone.
Similarly, S
´
a et al. (de S
´
a et al., 2022) proposed
a technique for quality control, focusing on six de-
fect types: stains, paper displacement or detachment,
attached material, wrinkled paper, and folded paper.
The method followed a traditional CV approach, us-
ing feature extraction techniques, specifically Local
Binary Pattern (LBP) histograms, combined with an
SVM classifier. NIR imaging was used due to its ef-
fectiveness in highlighting surface irregularities.
To address the class imbalance in the dataset,
an undersampling strategy was applied, limiting the
training set based on the size of the minority class.
The system achieved strong performance, with preci-
sion, recall, and F1-score values above 74% across all
defect classes.
Finally, Mehta et al. (Mehta and Klarmann, 2024)
introduce a hybrid unsupervised approach for detect-
ing surface defects on melamine-faced panels using
high-resolution images captured with a fixed field-
of-view (FOV) RGB camera. To prepare the train-
ing data, the described method slices the images into
smaller crops, extracts features using a pre-trained
VGG16 model, and applies K-Means clustering to
group similar regions. Artificial defects were added
by overlaying texture segments, and data augmenta-
tion techniques, such as rotation, flipping, scaling,
and cropping, were applied.
For defect detection, an autoencoder network with
skip connections was trained to reconstruct image
patches. Defects are identified based on reconstruc-
tion errors, as the model learns to reproduce only nor-
mal patterns. This approach enabled precise and accu-
rate detection of surface defects, including irregulari-
ties on edges, corners, holes, and flat surfaces, without
relying on pre-defined regions of interest.
3 METHODOLOGY
This Section details the specific application scenario
of the system, along with its architecture, including
the hardware and software setup.
3.1 Use Case Description
Decorative surfaced panels are wood-based panels
coated on both surfaces with paper impregnated with
melamine resin, as illustrated in Figure 2, to enhance
resistance and durability. The manufacturing process
of these panels is complex, primarily involving the
precise cutting of panels and a pressing stage, where
heat and pressure are applied to bond the impregnated
paper to the surface.
After impregnation, the panels undergo manual
inspection by factory operators to detect any surface
ICINCO 2025 - 22nd International Conference on Informatics in Control, Automation and Robotics
448

Figure 2: Decorative surfaced panel (Akij Board, 2023).
or visible defects. Common issues include torn paper,
uneven glue distribution within the paper that causes
creases after pressing, and small stains caused by dust
or other particles present during production. Exam-
ples of these defect types are illustrated in Figure 3.
Some of these defects, such as stains, can be ex-
tremely small, sometimes as little as 1mm
2
, while the
panels produced by Sonae Arauco can reach sizes up
to 6 meters by 3 meters. This disproportion between
panel size and defect scale makes the quality inspec-
tion process challenging for operators who are not po-
sitioned directly next to the entire surface of the panel,
as exemplified in Figure 4, increasing the risk of de-
fects going undetected.
3.2 System Architecture
After analyzing the requirements for the system, an
initial hardware setup was selected for experimen-
tal testing before deployment. The main require-
ment was that the solution should function as a non-
destructive inspection (NDI) system and operate en-
tirely independently from the company’s network and
production line infrastructure. To meet this constraint,
an NVIDIA Jetson Nano was chosen to enable local
image processing and CV model deployment, with an
RGB camera attached to capture real-time footage of
the panels (Figure 5). The camera features a high-
resolution 4056 x 3040 pixel sensor and captures only
visible light. The entire system, including the Jetson
Nano and the camera, is enclosed in a metal case to
protect it from dust, sparks, and other environmental
factors.
Supported by this hardware configuration, the
software pipeline processes the live images captured
by the camera frame-by-frame. Due to the size of the
panels and the constraints of the existing infrastruc-
ture, the camera cannot exclusively capture only the
panel in each frame. Therefore, each frame under-
goes segmentation to isolate the panel from the back-
ground. Once the panel area is identified, the system
detects and segments any surface defects present. The
final output is a live video stream where the detected
defects are highlighted with bounding boxes, provid-
ing real-time visual feedback. A simplified overview
of this pipeline is illustrated in Figure 6.
For this experimental phase and proof of concept,
the system focuses exclusively on white panels, the
most commonly produced type, to simplify initial de-
velopment and validation. The focus is on detecting
scratches and stains, as they are frequent and visu-
ally distinct defects. According to the factory quality
standards, any defect larger than 1mm
2
is considered
relevant, therefore this threshold was adopted during
development. Additionally, at this initial stage, the
system will also be limited to visible light inspection.
4 IMPLEMENTATION
As previously mentioned, two approaches were com-
pared: one based on traditional CV techniques and
the other on DP methods. Due to the limited avail-
ability of real images and defective panel samples,
a synthetic dataset was first created to support the
model’s development and evaluation. This Section
begins with a description of the dataset generation
process, followed by an explanation of the implemen-
tation of both panel segmentation and defect detection
processes.
4.1 Synthetic Dataset
Due to the limited number of real-world images, a
synthetic dataset was generated to supplement the
training and testing of the system’s models. As de-
scribed earlier, the real-time system involves two
stages: panel segmentation and defect detection on
the isolated panel. These stages require two distinct
datasets.
For the segmentation model, simple augmentation
techniques such as blurring and contrast adjustment
were applied to enhance the dataset. For defect detec-
tion, a synthetic dataset was created by exploring mul-
tiple image augmentation and blending techniques to
simulate realistic surface defects on panel images.
Two categories of images were required to train
the detection algorithm:
1. Defect-Free Panel Images: capturing variations
in angles, panel sizes, lighting conditions, and
other contextual factors.
2. Panel Images With Simulated Surface Defects:
incorporating different defect formats, sizes, and
locations.
For the first category, a combination of geomet-
ric transformations and blending techniques was ap-
Real-Time Automated Visual Inspection of Decorative Wood Panels for Zero Defects Manufacturing
449
(a) Stains caused by impurities on
the paper surface during pressing.
(b) Paper crease caused by uneven
glue distribution.
(c) Stains caused by the pressing
plate.
Figure 3: Examples of typical surface defects observed during the production process.
Figure 4: Manual quality inspection of decorative surfaced
panels at Sonae Arauco’s factory (Ricardo Castelo, 2024).
plied. Geometric transformations included rotation,
translation, scaling, and flipping, which helped simu-
late different perspectives and contexts. In addition,
a variety of blending and composition methods were
explored to create realistic lighting and texture varia-
tions. These included:
• Alpha Blending.
• Gradient and Radial Gradient Blending.
• Fourier Transform (FFT) Blending.
• Poisson Image Editing (Seamless Cloning).
• Perlin Noise and Gaussian Blur.
• Image Tiling and Patch-Based Composition.
For the second category, to simulate surface de-
fects on the panels, two main strategies were ex-
plored:
• Synthetic Dot-Based Defects: This method in-
volved overlaying randomly distributed black dots
of varying sizes and densities onto defect-free
Figure 5: Image acquisition system featuring an NVIDIA
Jetson Nano in an industrial enclosure, paired with an RGB
camera.
panel images. Although simple and efficient, it
often produced unrealistic defects that lacked the
texture and complexity of real defects.
• Patch-Based Defects: To improve realism, actual
defect regions were extracted from the limited set
of real-world images. These defect patches were
then augmented through random scaling, rotation,
and blending before being placed on clean panel
backgrounds, resulting in more natural and con-
vincing defect simulations.
4.2 Panel Segmentation
This Section outlines the implementation process of
the panel segmentation step for both the traditional
CV and DL approaches.
ICINCO 2025 - 22nd International Conference on Informatics in Control, Automation and Robotics
450
Figure 6: Simplified pipeline of the computer vision system for real-time defect detection.
4.2.1 Traditional Computer Vision Approach
The traditional CV approach to panel segmentation
relies on color and contour analysis to isolate the
panel from the background in each frame. This pro-
cess begins by converting the input RGB image to the
HSV color space for more effective color-based fil-
tering. A binary mask is then generated by threshold-
ing the HSV image within predefined lower and upper
bounds corresponding to the white tones of the panel,
as specified in Table 1.
Table 1: HSV threshold values used for the white panel’s
segmentation.
Lower Bound Upper Bound
Hue (H) 0 180
Saturation (S) 0 50
Value (V) 180 255
Following that, contours are extracted from this
mask using OpenCV’s cv.findContours method.
These contours are approximated to polygons, and
only those with four vertices are considered as pos-
sible panel shapes. The bounding rectangles of these
polygons are then evaluated based on their aspect ra-
tio, filtering out shapes that do not match the expected
panel proportions. Finally, from the remaining ones,
the contour with the largest area is selected as the
panel, which is then segmented.
4.2.2 Deep Learning Approach
The DL approach to panel segmentation employed a
YOLO-based instance segmentation model, eliminat-
ing the need for color-based and contour-driven tech-
niques. The model was trained using the configura-
tion parameters listed in Table 2. As this was the
initial phase of the project, only a single set of hy-
perparameters was used to assess the feasibility of the
method.
During training, both real and synthetic panel im-
ages were resized to 640×640 pixels and paired with
their instance masks before being fed into the model.
Table 2: YOLOv8 model training configuration for panel
segmentation.
Parameter Value
Architecture YOLOv8 instance segmen-
tation (yolov8n-seg.pt)
Weights COCO pre-trained segmen-
tation weights
Input Resolution 640×640
Confidence
Threshold
0.25
Training Epochs 100
Batch Size 16
IoU Threshold 0.7
Learning Rate Initial lr
0
= 0.01, final lr
f
=
0.01
Training ran for 100 epochs with batches of 16 im-
ages. The model was initialized with COCO pre-
trained weights, which come from training on a large
dataset of common objects. This helped the model
learn general visual features faster and improved ac-
curacy during fine-tuning on panel images. Training
optimization was carried out using Stochastic Gradi-
ent Descent (SGD). Finally, model performance was
monitored using metrics such as Intersection over
Union (IoU) and confidence scores, with a detection
being considered positive if its IoU exceeded 0.7.
At inference time, the model outputs multiple in-
stance masks with associated confidence scores. The
largest mask by pixel area is selected, assuming the
panel is the dominant object in the image. This seg-
mentation mask is then used as input for the subse-
quent defect detection stage.
4.3 Defect Detection
This Section outlines the implementation process of
the defect detection step for both the traditional CV
and DL approaches.
Real-Time Automated Visual Inspection of Decorative Wood Panels for Zero Defects Manufacturing
451
4.3.1 Traditional Computer Vision Approach
In the traditional CV approach, the defect detection
process starts by applying to the input segmented
panel an adaptive Gaussian threshold, producing a bi-
nary image that highlights potential defects by invert-
ing the pixel intensities. From this image, contours
are extracted using OpenCV’s cv.findContours
method. To reduce false positives caused by noise or
small irrelevant surface details, only contours exceed-
ing a certain size threshold corresponding to defects
larger than a minimum relevant size are considered as
defects. This filtering process takes advantage of the
company’s quality standards, which specify that only
defects above a specific physical size are meaningful
for quality assessment. Lastly, for each detected de-
fect, a bounding box is drawn to highlight the affected
area in the original frame.
4.3.2 Deep Learning Approach
The DL defect detection uses a YOLO-based object
detection model trained to identify and localize sur-
face stains in various lighting and distance settings.
The model was trained using the configuration param-
eters listed in Table 3.
Table 3: YOLOv8 model training configuration for defect
detection.
Parameter Value
Architecture YOLOv8 (yolov8n.pt)
Weights COCO pre-trained segmen-
tation weights
Input Resolution 640×640
Confidence
Threshold
0.25
Training Epochs 100
Batch Size 16
IoU Threshold 0.7
Learning Rate Initial lr
0
= 0.01, final lr
f
=
0.01
The training dataset consisted of panel images
pre-segmented to isolate the relevant region, with
each image annotated with bounding boxes around
the defects. As with the segmentation task, both real
and synthetic data were used to increase variability.
Similarly, the model was initialized with COCO pre-
trained weights to improve generalization, and opti-
mization was performed using SGD.
During inference, the defect detection model takes
the segmented panel image as input and returns a set
of bounding boxes with confidence scores. Predic-
tions below a confidence threshold of 0.50 were dis-
carded to reduce false positives. The final output is
an annotated image with all identified defects clearly
marked for visual inspection. If no defects are de-
tected, the input image is returned unchanged, indi-
cating a defect-free panel surface.
5 RESULTS
This Section presents the results of the synthetic
dataset generated and a comparison of the outcomes
of the two approaches under two different settings:
using the dataset and their real-time performance.
5.1 Synthetic Dataset
For the segmentation model, 83 real-world images
were collected at various distances, angles, and light-
ing conditions. These images were augmented using
techniques such as flips, brightness, and saturation ad-
justments, resulting in a final dataset of 199 images.
An example of augmentation applied to a real panel
image is shown in Figure 7.
(a) Original panel image. (b) Augmented image
(flipped and brightness-
adjusted).
Figure 7: Example of data augmentation applied to a real
panel image for the segmentation dataset.
For the defect detection dataset, among the meth-
ods described in Section 4.1, the most effective ap-
proach was tiling sections of clean panels combined
with augmented defect patches extracted from real-
world defective panel images. These synthetic de-
fective panels were further enhanced with geomet-
ric transformations, noise addition, and contrast ad-
justments to maximize defect diversity. Starting with
26 real-world defective images, the dataset was ex-
panded to 138 images. Two examples of syntheti-
cally generated defective panel images are illustrated
in Figure 8.
ICINCO 2025 - 22nd International Conference on Informatics in Control, Automation and Robotics
452

(a) Generated
through patch
tiling.
(b) Generated
through patch
tiling and contrast
adjustment.
Figure 8: Example of synthetically generated defective
panel images.
5.2 Comparison of Traditional and
Deep Learning Approaches
Both approaches were evaluated and compared in two
settings: using static images from the dataset and
through real-time video capture and processing.
5.2.1 Evaluation Through Images
To evaluate the performance of the traditional ap-
proach, metrics such as precision, recall, and IoU
were calculated. The IoU metric measures the overlap
between predicted bounding boxes and actual boxes,
and the greater the overlap, the more accurate the pre-
diction.
For panel segmentation, the results were very
poor, with all metrics close to zero. This is mainly
due to fixed threshold values, such as the HSV ranges
and panel proportions, that make the approach highly
sensitive to lighting conditions and panel positioning.
Consequently, the method lacks the flexibility needed
to generalize effectively across the diverse synthetic
dataset.
In contrast, for defect detection, the results
showed a mean IoU of 0.584, an average precision
of 55.1%, an average recall of 62.1%, and an average
F1-Score of 60.2% (Table 4). These results suggest
that the approach performs reasonably well at detect-
ing defects, though there is room for improvement,
particularly in increasing precision to reduce the num-
ber of false positives. Figure 9 presents examples of
annotated detection results: in (a) only 1 of 3 defects
was detected; in (b) 1 of 4; and in (c) all defects were
successfully detected.
Table 4: Performance metrics of the traditional computer
vision defect detection approach.
Metric Value (%)
Mean Precision 55.1
Mean Recall 62.1
Mean IoU 58.4
Mean F1-Score 60.2
Despite the moderate detection performance, the
poor segmentation results compromise the overall ef-
fectiveness of the traditional CV approach, making it
not suitable for application across diverse conditions.
The DP approach was also evaluated by assessing
the panel segmentation and defect detection models
separately. For both models, approximately 20% of
the total data was reserved and used for testing.
Table 5 presents the performance metrics of the
YOLO-based panel segmentation model. The high
scores across the considered metrics indicate that the
model is highly effective. In particular, the results
suggest a strong alignment between the predicted
panel locations and the ground truth annotations. This
confirms that the model is precise, making it a reliable
predecessor to the defect detection model and suitable
for integration into the automated inspection system.
Table 5: Performance metrics of the YOLO-based panel
segmentation model.
Metric Value (%)
Mean Precision 99.3
Mean Recall 100.0
Mean F1-Score 99.6
Real-Time Automated Visual Inspection of Decorative Wood Panels for Zero Defects Manufacturing
453
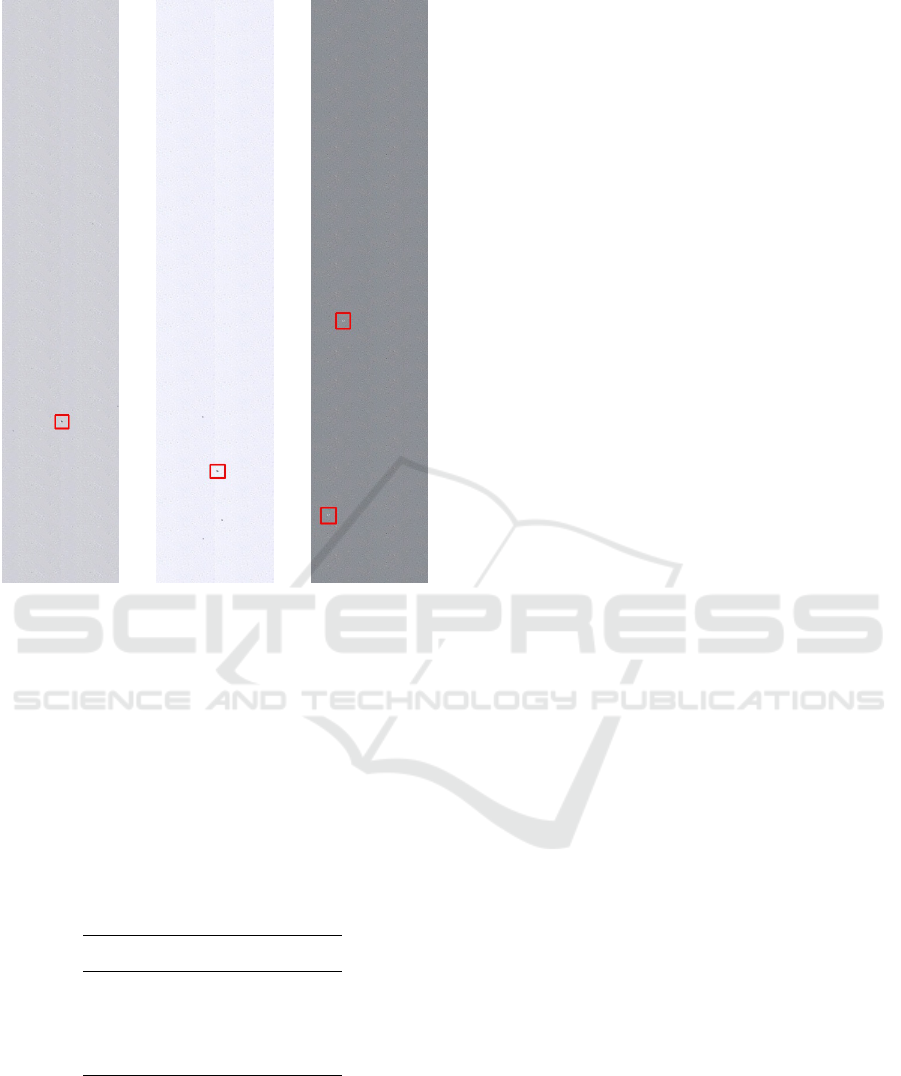
(a) Panel with 3
defects.
(b) Panel with 4
defects.
(c) Panel with 2
defects.
Figure 9: Example results from traditional computer vision
defect detection approach.
Table 6 presents the performance metrics of the
YOLO-based defect detection model. The results
show a strong overall performance, with high values
for all metrics. In this context, both precision and re-
call are equally relevant, as minimizing false positives
and false negatives is essential to the reliability of the
inspection process.
Table 6: Performance metrics of the YOLO-based defect
detection model.
Metric Value (%)
Mean Precision 80.0
Mean Recall 86.9
Mean F1-Score 83.3
Figure 10 shows an example of the YOLO-based
pipeline applied to a panel image. Despite the promis-
ing results of this DL approach, the models were
trained and tested on a relatively small dataset, with
most of the data being synthetic. Therefore, it is im-
portant to note that further work is needed to validate
and refine these models using larger and more diverse
real-world datasets.
Nonetheless, in both panel segmentation and de-
fect detection tasks, the DL approach clearly outper-
forms the traditional CV method. The YOLO-based
models achieve higher precision, recall, and F1-score,
demonstrating greater robustness and generalization
across different conditions. As expected, the tradi-
tional approach struggles, especially in segmentation,
due to its dependence on hard-coded parameters and
its sensitivity to environmental variations.
5.2.2 Evaluation with Live-Video
To perform the real-time evaluation, a set of sample
panels was used under various conditions, including
different lighting setups and panel angles (tilted ver-
sus upright positioning). Under each scenario, the
maximum range, measured as the distance from the
camera to the panel at which the approach remained
functional, was recorded in meters (m). These results
are summarized in Table 7.
The results indicate that the traditional CV ap-
proach is highly sensitive to both the lighting and
the positioning of the panel, with the performance
degrading significantly under the suboptimal condi-
tions. This outcome was expected, as previously
noted, since the relies heavily on fixed thresholds,
which are difficult to maintain consistently in variable
environments. In contrast, the YOLO-based method
demonstrates more robustness, maintaining reliable
panel segmentation and defect detection even when
the lighting is lower or the panel is tilted. These
results are further supported by the previously dis-
cussed performance metrics obtained on the static
image dataset. In terms of processing time, there
were no significant differences between the two ap-
proaches.
6 CONCLUSIONS AND FUTURE
WORK
This paper presented an automated visual inspection
system for melamine-faced wood panel production,
designed to support operators and enhance inspection
efficiency and reliability. The system integrates the
Detection strategy into a broader ZDM framework,
alongside existing Prediction and Prevention compo-
nents.
The proposed solution emphasizes a non-
destructive, non-disruptive architecture that runs
entirely on-device, using an NVIDIA Jetson Nano
paired with an RGB camera to capture real-time
footage of the production line. The image processing
ICINCO 2025 - 22nd International Conference on Informatics in Control, Automation and Robotics
454
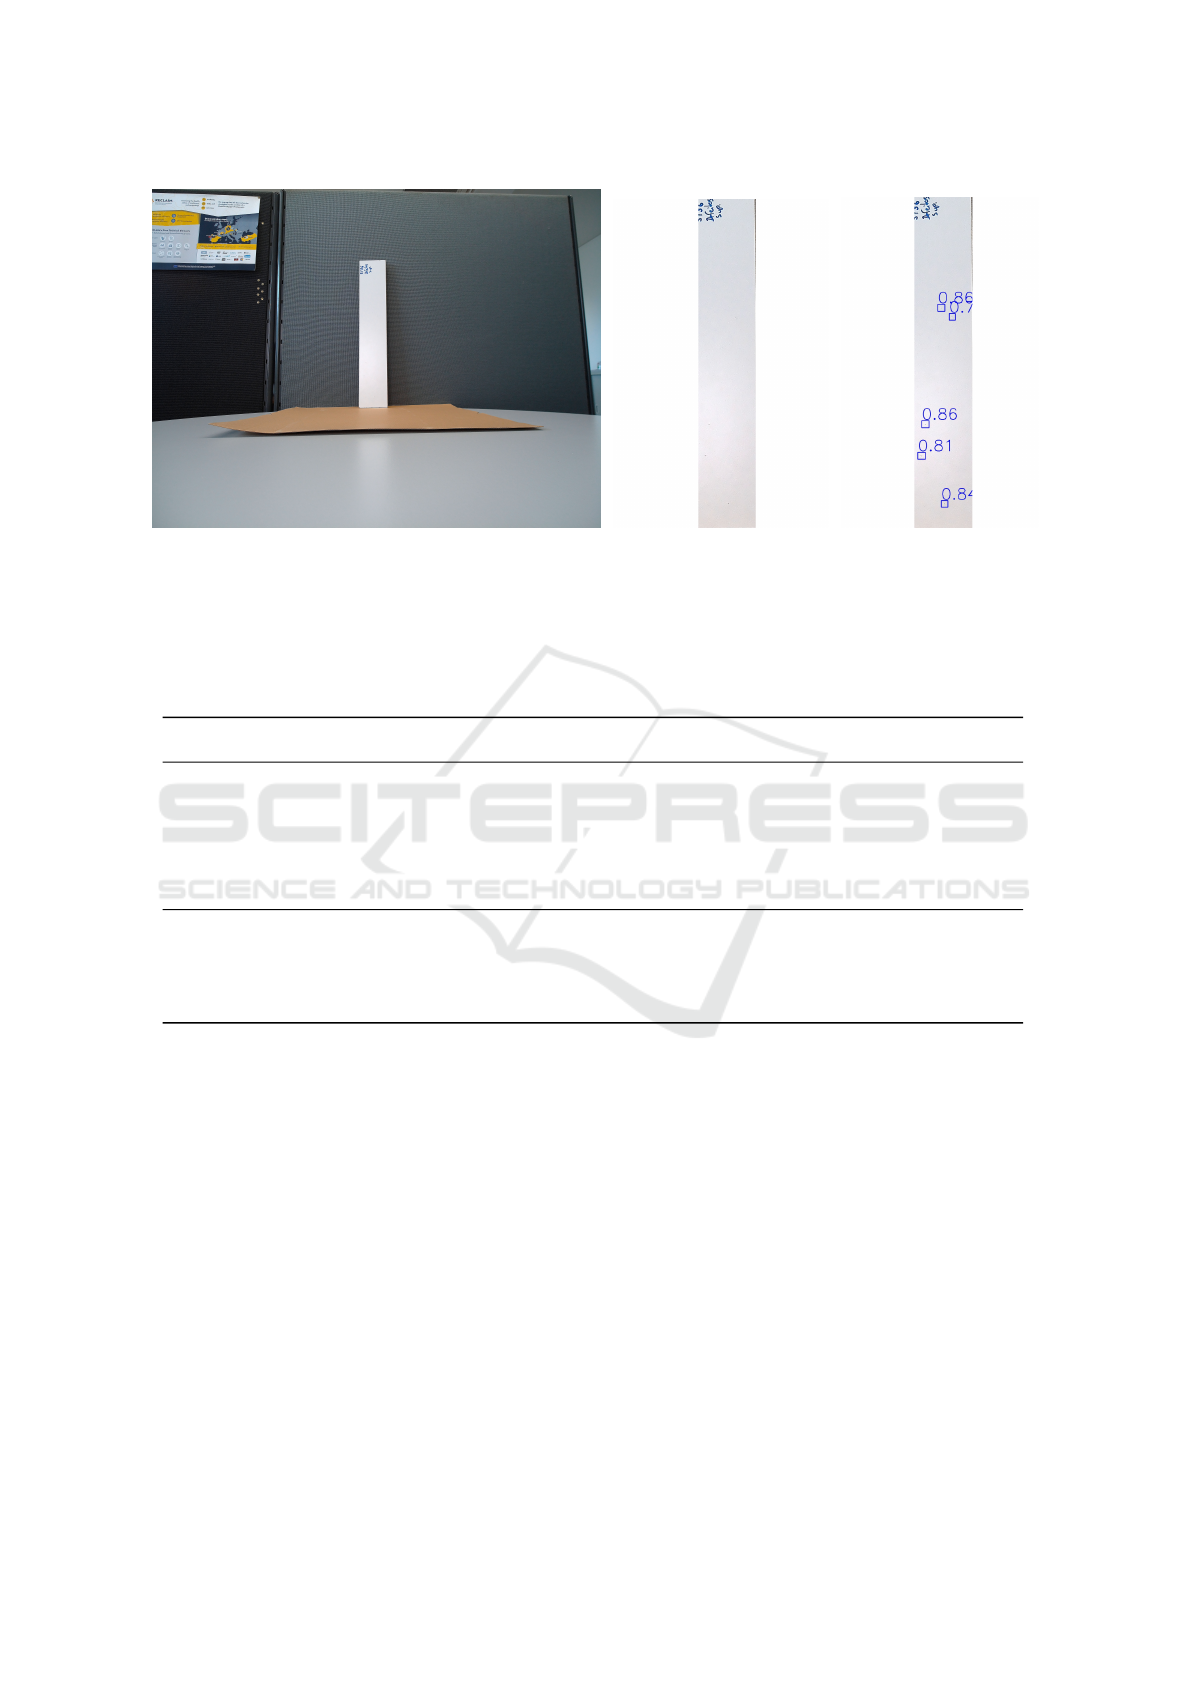
(a) Original image. (b) After panel segmentation. (c) After defect detection
and annotation, showing
the detection confidence
score.
Figure 10: Example of the YOLO-based approach pipeline applied to a panel image.
Table 7: Comparison of real-time performance between traditional CV and YOLO-based methods for panel segmentation and
defect detection.
Traditional CV YOLO
Panel Segmentation
Upright Panel under Enhanced Lighting Up to 1.9 m Up to 2.7 m
Upright Panel under Normal Room Lighting Up to 1.1 m Up to 2.7 m
Tilted Panel under Enhanced Lighting Not Functional Up to 2.1 m
Tilted Panel under Normal Room Lighting Not Functional Up to 2.1 m
Defect Detection
Detection of All Defect Types Up to 1.3 m Up to 1.7 m
Detection of Major Defects Only Up to 1.9 m Up to 2.7 m
Detection Failure Threshold Beyond 1.9 m Beyond 2.7 m
pipeline performs both panel segmentation and
surface defect detection, highlighting any identified
defects for operator review. Two implementation
strategies were compared: a traditional CV approach
based on thresholding and contour analysis, and a
DL approach based on YOLOv8 models. Due to the
limited availability of real defect data, a synthetic
dataset was generated using patch blending and data
augmentation techniques to support model training
and evaluation.
Experimental results from static and real-time
video inputs showed that the traditional approach is
highly sensitive to lighting and positioning variations,
resulting in inconsistent performance. In contrast, the
YOLO-based solution consistently delivered more ac-
curate and robust results, making it the more suitable
approach for practical deployment.
Future work will focus on:
• Extending the detection capabilities to a wider va-
riety of panel textures, colors, and defect types.
• Evaluating different camera types and lighting
setups (e.g., visible, infrared) under various ac-
quisition conditions to enhance defect visibility.
This includes exploring multi-camera systems for
broader spectral coverage.
• Expanding both real-world and synthetic datasets
to improve model generalization.
• Fine-tuning the DL models and optimizing hyper-
parameters for improved performance.
• Deploying and testing the system directly on the
production line.
Real-Time Automated Visual Inspection of Decorative Wood Panels for Zero Defects Manufacturing
455

ACKNOWLEDGEMENTS
This work was partially supported by the HORIZON-
CL4-2021-TWIN-TRANSITION-01 openZDM
project, under Grant Agreement No. 101058673.
REFERENCES
Aguilera, C. A., Aguilera, C., and Sappa, A. D. (2018).
Melamine faced panels defect classification beyond
the visible spectrum. Sensors, 18.
Akij Board (2023). Melamine Faced Board. https://akijboar
d.com/melamine-board/. Last Accessed: 2024-05-27.
Caiazzo, B., Nardo, M. D., Murino, T., Petrillo, A., Piccir-
illo, G., and Santini, S. (2022). Towards zero defect
manufacturing paradigm: A review of the state-of-the-
art methods and open challenges. Computers in Indus-
try, 134.
Coutinho, B., Pereira, E., and Gonc¸alves, G. (2024). 0-
dmf: A decision-support framework for zero defects
manufacturing. In Proceedings of the 21st Interna-
tional Conference on Informatics in Control, Automa-
tion and Robotics, pages 253–260. SCITEPRESS -
Science and Technology Publications.
de S
´
a, F. P., Aguilera, C., Aguilera, C. A., and Conci, A.
(2022). Melamine Faced Panel Inspection, Towards
an Efficient Use of Natural Resources, volume 224,
pages 165–183. Springer Science and Business Media
Deutschland GmbH.
Fragapane, G., Eleftheriadis, R., Powell, D., and Antony, J.
(2023). A global survey on the current state of prac-
tice in zero defect manufacturing and its impact on
production performance. Computers in Industry, 148.
Hoffmann, R. and Reich, C. (2023). A systematic literature
review on artificial intelligence and explainable artifi-
cial intelligence for visual quality assurance in manu-
facturing. Electronics, 12(22).
Jia, Z., Wang, M., and Zhao, S. (2024). A review of
deep learning-based approaches for defect detection
in smart manufacturing. Journal of Optics (India),
53:1345–1351.
Lario, J., Mateos, J., Psarommatis, F., and
´
Angel Ortiz
(2025). Towards zero defect and zero waste manu-
facturing by implementing non-destructive inspection
technologies. Journal of Manufacturing and Materi-
als Processing, 9.
Li, R., Xu, Z., Yang, F., and Yang, B. (2024). Defect detec-
tion for melamine-impregnated paper decorative par-
ticleboard surface based on deep learning. Wood Ma-
terial Science and Engineering.
Mehta, D. and Klarmann, N. (2024). Autoencoder-based
visual anomaly localization for manufacturing quality
control. Machine Learning and Knowledge Extrac-
tion, 6:1–17.
O’Mahony, N., Campbell, S., Carvalho, A., Harapanahalli,
S., Hernandez, G. V., Krpalkova, L., Riordan, D., and
Walsh, J. (2020). Deep learning vs. traditional com-
puter vision. In Advances in Intelligent Systems and
Computing, volume 943, pages 128–144. Springer
Verlag.
Psarommatis, F., May, G., and Azamfirei, V. (2023). The
role of human factors in zero defect manufacturing: A
study of training and workplace culture. In Alfnes,
E., Romsdal, A., Strandhagen, J. O., von Cieminski,
G., and Romero, D., editors, Advances in Production
Management Systems. Production Management Sys-
tems for Responsible Manufacturing, Service, and Lo-
gistics Futures, pages 587–601, Cham. Springer Na-
ture Switzerland.
Ricardo Castelo (2024). Sonae Arauco quer “domesticar as
f
´
abricas” para serem mais eficientes. https://eco.sapo
.pt/reportagem/sonae-arauco-quer-domesticar-as-f
abricas-para-serem-mais-eficientes/. Last Accessed:
2025-05-21.
ICINCO 2025 - 22nd International Conference on Informatics in Control, Automation and Robotics
456
