
Machine Learning-Based Stroke Segmentation in Kayaking Using
Integrated IMU and EMG Data
G
´
abor Nagy
1
, P
´
eter Katona
2
, Levente Gannorouwa
2
and L
´
aszl
´
o Grand
1
1
P
´
azm
´
any P
´
eter Catholic University, Faculty of Information Technology and Bionics, 40 Pr
´
ater Str, Budapest, Hungary
2
Hungarian University of Sports Science, 42-48 Alkot
´
as Str, Budapest, Hungary
Keywords:
Kayaking, Electromyography, Inertial Measurement Unit, Boat Acceleration, Machine Learning Models,
Ensemble Learning.
Abstract:
Accurate classification of stroke side in rowing motions is essential for performance monitoring and injury
prevention. This study evaluates three machine learning models — Naive Bayes (NB), Logistic Regression
(LR), and Gradient Boosting Decision Trees (GBDT) — using biomechanical and electromyographic (EMG)
features. A core set of 25 features was identified, with normalized joint coordinates and latissimus dorsi
EMG activity among the most influential. The NB model achieved 92.21% cross-validation accuracy using
only three coordinate-based features, while the full feature set improved accuracy modestly by 1.94%. The
LR model attained 94.48% accuracy, slightly outperforming NB. The GBDT model achieved the highest
accuracy with 96.18% on the test set, alongside the lowest mean absolute stroke onset detection error of 24.6
± 51.6 ms, corresponding to just 4.5% of average stroke duration. Classification accuracy remained stable
across stroke paces. A strong negative correlation (R = -0.935) between classification accuracy and onset
detection error was observed across subjects, indicating that poorer spatial classification corresponds with
greater temporal imprecision. Significant inter-subject variability was found, with accuracy ranging from
91.89% to 98.9%, likely reflecting individual differences in stroke technique and muscle activation patterns. A
core set of biomechanical features were identified, such as normalized joint coordinates of th eulnar styloid and
right olecranon, latissimus dorsi EMG activity among the most influential, vertical pelvis lateral bending and
bilateral shoulder flexion. Tempo-based relative time averages of these features reveal clear phase-dependent
patterns that contribute strongly to model decision-making. These results demonstrate that accurate stroke
side classification can be achieved using a relatively small set of biomechanical features, with GBDT models
providing superior performance.
1 INTRODUCTION
Measuring kayaking technique is inherently complex,
requiring the integration of biomechanical, kinematic,
and neuromuscular analyses. Recent advancements
have expanded the use of technologies such as motion
capture systems, surface electromyography (sEMG),
and machine learning (ML) models to assess perfor-
mance more accurately. Kinematic analysis helps
quantify joint and segment movement, while sEMG
offers insight into muscle coordination and fatigue
during paddling, particularly in key upper-body mus-
cles such as the latissimus dorsi, triceps brachii, and
anterior deltoid (Lauder and Kemecsey, 1999).
Studies such as Garnier et al. have demonstrated
that combining sEMG with kinematic data allows for
a more complete understanding of how fatigue im-
pacts paddling performance (Garnier et al., 2023).
Similarly, McDonnell et al. proposed refined stroke
models to address inconsistencies in stroke descrip-
tions, further enhanced by tools like the e-Kayak
system for performance feedback (McDonnell et al.,
2012; Bonaiuto et al., 2020). Other research has
emphasized the value of three-dimensional analyses
and recognized inherent movement asymmetries in
kayaking that affect force transmission and efficiency
(Li, 2017; Vasiljev et al., 2024).
Importantly, multiple studies have reported sig-
nificant differences between on-water and ergometer-
based kinematics. Klitgard et al. found variations in
joint movement and increased thoracolumbar motion
during on-water trials, while Harbour et al. identified
large discrepancies in timing and force parameters
across environments (Klitgaard et al., 2021; Harbour
256
Nagy, G., Katona, P., Gannorouwa, L. and Grand, L.
Machine Learning-Based Stroke Segmentation in Kayaking Using Integrated IMU and EMG Data.
DOI: 10.5220/0013781200003988
Paper published under CC license (CC BY-NC-ND 4.0)
In Proceedings of the 13th International Conference on Sport Sciences Research and Technology Support (icSPORTS 2025), pages 256-264
ISBN: 978-989-758-771-9; ISSN: 2184-3201
Proceedings Copyright © 2025 by SCITEPRESS – Science and Technology Publications, Lda.

et al., 2021). These findings suggest that ergometer-
based assessments may not fully capture the biome-
chanical realities of on-water performance.
Despite the widespread use of sEMG and motion
tracking, our review identified a lack of studies that
combine these modalities in on-water kayaking sce-
narios. This represents a key research gap in under-
standing how muscle activation and movement inter-
act under real-world conditions.
In parallel, the application of machine learning in
sports biomechanics has rapidly progressed. IMU-
based data capture combined with ML models has
shown strong potential in real-time movement clas-
sification, including in kayaking (Kranzinger et al.,
2023; Liu et al., 2021). For example, Liu et al.
achieved 98% accuracy in segmenting kayak stroke
phases using ML validated against video analysis.
Similar methodologies have also been successfully
applied to gesture recognition tasks using sEMG data,
despite challenges such as electrode shift (Kim et al.,
2021).
In this study, we investigate whether sEMG and
motion capture data can be used to develop an accu-
rate ML model to classify left and right kayak strokes.
We also examine the role of input features and ex-
plore between-subject variability in classification ac-
curacy. Our hypothesis is that some athletes exhibit
more consistent and repeatable stroke patterns, lead-
ing to higher classification accuracy, while others dis-
play more variation, resulting in reduced model per-
formance. Since classification models perform best
with well-separated and consistent input patterns, this
work aims to better understand how stroke consis-
tency affects model outcomes and which features are
most influential in side prediction and also provide a
basis for further analysis.
2 METHODS
2.1 Participants and Environment
The study involved nine male participants, aged 17
to 21, all of whom were experienced kayakers with
notable athletic achievements in the sport. The ex-
periments were conducted over two consecutive days
at the Kolonics Gy
¨
orgy Watersport Center, located
on the Danube River. These trials took place during
mid-summer, under favorable weather conditions. It
is noteworthy that the section of the Danube River
where the study was conducted is regulated by the
Kvassay Dam, which ensures modest presence of nat-
ural water currents in the area.
2.2 Motion Capture System
A wireless inertial motion capture system (Xsens
MVN Link, Xsens Technologies BV, Enschede,
Netherlands) and its software (Xsens MVN Studio
version 4.2.4, Xsens Technologies BV, Enschede,
Netherlands) was utilized to record on water kayaker
motion at a sampling rate of 60 Hz. The measure-
ment system consists of small (47 × 30 × 13 mm, 16
g) box shaped measurement units that are placed on
both shoulders, upper arms, forearms, hands, thighs,
shanks and feet, with one additional sensor placed on
the head, chest and on the sacrum of the athlete with
Velcro straps.
The measurement units communicate with a base
station called Awinda, that are on a boat 5-20 me-
ters away from the athlete. The technology provider
claims 50 meter open air wireless range, however in
our studies it was significantly less than that, which
resulted in signal loss. For better reception a bigger
antenna was used in the base station, that somewhat
improved signal stability.
Before each recording session a strict IMU unit
calibration procedure provided by the manufacturer
was strictly followed to avoid electromagnetic fields.
The inertial motion capture systems’ data fusion
algorithm employed an extended Kalman filter to pro-
vide accurate positional readings of body segments
and joint angles. In this study we use features from
the positional coordinates and joint angles. The
XSense biomechanical model consists of 23 segments
linked through 22 joints. (Technologies, 2025)
2.3 EMG Signal Acquisition
Cometa Miniwave wireless sensors with a WavePlus
base station were used to acquire EMG signals and
was also used as the boat and paddle accelerometers.
The manufacturer claims 40 meters of indoor range.
Tested in an outside environment, it is notable that the
basestaion was far more reliable than the IMU mea-
surement base station in terms of signal acquisition.
Sensors are able to collect EMG data at 2 kHz and
also employ an accelerometer that is capable to trans-
fer 3-axis accelerometer data at a sampling rate of 140
Hz.
During the exercise sessions, surface electromyo-
graphy (EMG) signals were collected from various
muscles on both the right (abbreviated as ”R”) and
left (abbreviated as ”L”) sides of the participants. In
total 14 sensors were used to collect data from the fol-
lowing specific muscles:
1. Latissimus dorsi
2. Trapezius (middle fibers)
Machine Learning-Based Stroke Segmentation in Kayaking Using Integrated IMU and EMG Data
257

3. Deltoideus Anterior (anterior deltoids)
4. Pectoralis Major
5. Obliquus Externus Abdominis
6. Rectus Femoris
7. Flexor Carpi Radialis
These muscles were strategically chosen to capture a
comprehensive representation of the muscular activity
involved in the kayaking exercise.
In accordance with the international protocol
recommendations established by SENIAM (Surface
EMG for Non-Invasive Assessment of Muscles), we
positioned the surface electrodes on the muscles,
specifically targeting the area between the tendon
and the motor point. This standardized placement
aimed to ensure consistency and reliability in cap-
turing electromyographic signals, facilitating accurate
assessment of muscle activity during the kayaking
motions under investigation. Adhering to SENIAM
guidelines enhances the comparability of our findings
with broader scientific literature and contributes to
the overall validity of our electromyographic analy-
ses. (Stegeman and Hermens, 2007)
The boat-mounted accelerometer was positioned
directly behind the kayaker, aligned with the longitu-
dinal axis of the kayak. From this setup, we utilized
acceleration data from the axis parallel to the boat’s
heading to capture forward motion dynamics. Sim-
ilarly, the paddle accelerometer was mounted at the
midpoint of the paddle shaft, with the relevant axis
also aligned parallel to the paddle. This configura-
tion enabled consistent detection of stroke direction
and intensity. The parallel axis readings from both
devices were essential for accurately deriving stroke
side and synchronizing movement phases.
Both the Awinda and WavePlus base stations sup-
port hardware synchronization, which we used dur-
ing the recording process. This hardware sync en-
sured that both systems began recording at the same
time, with their internal clocks aligned. As a result,
the timestamps recorded by each system were already
synchronized when saved to the computer, enabling
accurate temporal alignment of data across devices.
The recording was initiated via the WavePlus data ac-
quisition software, which triggered the start of data
collection in Xsens as well.
2.4 Protocol
Participants were instructed to paddle at a fixed stroke
rate for multiple, short, sustainable recording ses-
sions. Stroke rates began at 80 strokes per minute
(SPM), representing a low-to-intermediate training
load, and increased with 10 SPM incrementally up to
120 SPM, which is considered highly demanding for
the athletes. The duration of each recording session
was adjusted based on the target stroke rate, allowing
for the collection of approximately 60 stroke cycles
per session. Specifically, the session lasted 45 sec-
onds at 80 SPM, 40 seconds at 90 and 100 SPM, 35
seconds at 110 SPM, and 30 seconds at 120 SPM. No-
tably, the 30-second duration at 120 SPM was physi-
cally demanding for some athletes, given the high in-
tensity of the effort. A rest period of 60 to 120 sec-
onds was provided between recording sessions to al-
low for adequate recovery. The protocol ensured that
we can gather samples from low-intermediate training
scenarios to very demanding intensities. Some ath-
letes performed two runs successively.
An on-land reference trial was conducted to de-
termine the maximum EMG values required for sub-
sequent signal normalization. During this trial, the
athlete was instructed to apply maximal force to the
kayak paddle while it was held stationary by a helper.
This was performed separately for the left and right
arms, resulting in isometric contractions that engaged
the relevant muscle groups. The resulting EMG max-
ima provided a consistent and reproducible reference
point for normalizing muscle activity recorded during
the on-water paddling sessions.
3 SIGNAL PROCESSING
3.1 IMU Readings
All IMU-derived body segment positions were ex-
ported in C3D format for further analysis. Due to the
absence of a fixed track, the kayak could not maintain
a perfectly straight trajectory during recordings. As
a result, the heading and tilt of the athletes were nor-
malized to account for variations in orientation. The
center of the pelvis was defined as the origin, and all
positional data were translated accordingly.
Motion capture systems are inherently subject to
positional drift, a phenomenon that is further ampli-
fied in on-water conditions due to the kayak’s con-
tinuously shifting heading. To mitigate this drift,
the biomechanical model was dynamically rotated.
Specifically, the model was aligned such that the
vector connecting the midpoint between the athlete’s
heels and the midpoint between the ischial tuberosi-
ties (sit bones) was made parallel to the kayak’s head-
ing, which in this context is considered the X-axis
of the coordinate system. The Z-axis was defined as
pointing upward, and the Y-axis pointed leftward rel-
ative to the athlete. The biomechanical model of the
athlete was rotated within the XY plane such that the
icSPORTS 2025 - 13th International Conference on Sport Sciences Research and Technology Support
258

line connecting the seventh cervical vertebra (C7) and
the midpoint of the ischial tuberosities was aligned
parallel to the Y-axis.
To account for inter-individual differences in body
dimensions, per-athlete z-score standardization was
applied to the body part coordinate data. These stan-
dardized coordinates were then used as features in the
subsequent analysis, ensuring comparability across
athletes. Joint angles were also normalized on a per-
athlete base with z-score standardization.
3.2 EMG, Boat and Paddle
Accelerometer Preprocessing
To enhance EMG signal quality and minimize the im-
pact of various artifacts, a series of standard prepro-
cessing techniques were applied. A bandpass filter
was implemented with cutoff frequencies set at 20
Hz (low) and 400 Hz (high) to remove movement
artifacts and high-frequency electrical noise, respec-
tively. The filter was designed as a second-order But-
terworth filter to retain the physiologically relevant
frequency content of the EMG signals (Raez et al.,
2006).
Following filtering, full-wave rectification was
performed using a centered moving window of 100
ms. The rectified signal was then smoothed using a
Savitzky–Golay filter (window size: 100 ms; polyno-
mial order: 1) to further enhance signal clarity while
preserving temporal features.
Finally, all EMG signals were normalized to the
maximum EMG amplitude recorded during each ath-
lete’s respective on-land reference trial. This normal-
ization allowed for inter-participant comparisons and
reduced variability due to individual differences in
signal amplitude.
Both boat and paddle accelerometer readings in
all axes were preprocessed and smoothed with a Sav-
itzky–Golay filter (window size: 50 ms, polynomial
order: 2). High frequency noise does not interfere
with resulting measurements.
To ensure uniformity across recordings and facil-
itate subsequent analysis, all sensor data were resam-
pled to a standardized frequency of 1 kHz. This re-
sampling was carried out using linear interpolation,
which estimates intermediate data points to produce
evenly spaced time series, thereby allowing consistent
comparison and processing across all runs.
3.3 Outlier Filtering
Outlier strokes were removed from the analysis using
the interquartile range (IQR) method applied to sev-
eral key stroke metrics. A multiplier of 2 was used to
define the lower and upper bounds for outlier detec-
tion, identifying strokes with values lying outside this
range as outliers. The measurements considered in-
cluded stroke duration (time taken to complete a sin-
gle stroke), tempo duration (time taken to complete
a full left-right stroke cycle), air phase duration, and
the durations of the catch, pull, and recovery phases.
Out of 1509 recorded strokes across all athlete runs,
125 strokes were identified as outliers and excluded,
resulting in 1384 strokes retained for analysis.
4 MODELING
4.1 Target Variable
The target variable was computed using synchronized
data from both the boat and paddle accelerometers.
Stroke segmentation was performed using the boat
accelerometer’s x-axis — aligned with the kayak’s
heading — by identifying zero-crossings in the for-
ward acceleration signal, which marked the beginning
of new stroke segments. To determine stroke side, we
used the paddle accelerometer axis that was parallel to
the paddle shaft. For each segmented stroke, we cal-
culated the mean acceleration along this axis. Based
on the measurement orientation, strokes with negative
mean acceleration values were labeled as left-handed,
while those with positive values were labeled as right-
handed.
4.2 Training and Test Dataset
Preparation
A total of 74 runs were collected from nine athletes
across varying intensities. Of these, 44 runs were used
for model training, feature selection, and parameter
optimization, while the remaining 30 runs were re-
served for final testing. Each subset maintained a rep-
resentative distribution of stroke paces, ranging from
80 to 120 strokes per minute, ensuring consistent pro-
portions across all pace classes. Additionally, data
from all athletes were included in both training and
testing sets to preserve subject diversity. This bal-
anced sampling approach ensured that model evalu-
ation reflected a comprehensive range of performance
conditions.
We employed a 6-fold grouped cross-validation
across 18 available training runs. Grouping ensured
that all samples from the same run (i.e., from the
same subject and session) remained entirely within ei-
ther the training, validation or test set for each fold,
thereby preventing data leakage. This approach is
Machine Learning-Based Stroke Segmentation in Kayaking Using Integrated IMU and EMG Data
259

particularly appropriate when dealing with repeated
measures or correlated observations — such as multi-
ple recordings from the same athlete — as it reduces
the risk of overfitting to individual-specific patterns.
Furthermore, non-overlapping runs of varied intensi-
ties were selected to enhance independence between
training and validation subsets, improving generaliza-
tion to unseen conditions.
We have chosen accuracy as the error metric for
all because of interpretability. We also employed
the error metric mean absolute stroke on-set differ-
ence (MAEOSD): that is the mean absolute difference
measured in samples between the true onset of a suc-
cessive stroke and the predicted onset of the stroke.
4.3 Models
We compare results of 3 classifiers: Gaussian Naive
Bayes, Logistic Regression, Gradient Boosting Deci-
sion Tree.
Gaussian Naive Bayes (NB) is a probabilistic clas-
sifier based on Bayes’ Theorem, assuming indepen-
dence between features and that they follow a normal
(Gaussian) distribution. It is simple, fast, and works
well with small datasets or when the independence as-
sumption roughly holds.
Logistic Regression (LR) is a linear model used
for binary classification, which estimates the proba-
bility of a class label using the logistic (sigmoid) func-
tion. It assumes a linear relationship between input
features and the log-odds of the outcome, and it’s ef-
fective for well-separated classes with linearly sepa-
rable boundaries.
Gradient Boosting Decision Trees (GBDT) is an
ensemble method that builds a series of decision
trees sequentially, where each new tree corrects errors
made by the previous ones. It combines the strengths
of multiple weak learners to produce a strong classi-
fier, often achieving high accuracy on complex, non-
linear datasets. GBDT is more computationally inten-
sive but generally offers superior performance com-
pared to simpler models. (Chen and Guestrin, 2016)
A Gaussian Naive Bayes classifier was employed
as a baseline to benchmark the performance of more
complex models. Performance metrics are reported as
the average classification accuracy across six cross-
validation folds and on the held-out test set.
The classifiers operated on a per-sample basis, as-
signing a confidence score to each time point, indicat-
ing the likelihood of it corresponding to a left or right-
hand stroke. Training was also conducted at the per-
sample level, enabling the model to learn fine-grained
temporal patterns specific to stroke side. Accordingly,
the accuracy metric can be interpreted as the propor-
tion of time during which the classifier correctly iden-
tified the stroke side.
4.4 Feature Selection
To reduce dimensionality and improve performance
feature selection techniques were implemented: for
Naive Bayes and Logistic Regression forward selec-
tion and backward elimination were both used. These
stepwise feature selection techniques commonly used
in machine learning. Forward selection begins with
an empty model and iteratively adds the feature that
improves the error metric (accuracy in this case). In
contrast, backward elimination starts with the full set
of features and progressively removes the least signif-
icant ones, continuing until no further improvement in
model performance is observed. We used backward
elimination on the feature set obtained with forward
selection to reduce the feature space. Once no further
improvement was observed, Greedy Backward Elim-
ination was applied to remove any features whose ex-
clusion resulted in improved accuracy. This process
of forward selection followed by backward elimina-
tion continued iteratively until no additional modifi-
cations improved model performance.
4.5 Feature Importance
Following feature selection, permutation importance
was employed to further evaluate and interpret feature
contributions. This model-agnostic technique esti-
mates feature importance by randomly permuting fea-
ture values and measuring the resulting drop in per-
formance. Features causing greater reductions in ac-
curacy were deemed more important. This provided
a robust and interpretable measure of feature rele-
vance, especially beneficial for understanding com-
plex or non-linear models, but also helps with simple
models that do not provide an intrinsic feature impor-
tance such as Naive Bayes. Features with negative
permutation importance scores were discarded.
5 RESULTS
5.1 Naive Bayes
The final selected feature set contained 25 features
and achieved a cross-validation accuracy of 94.71%
± 0.01 and 94.48% on the test set. Among all
features, the most influential were the normalized
Z-coordinates of the left olecranon and both left
and right ulnar styloid markers. Remarkably, using
just these three features, the Naive Bayes classifier
icSPORTS 2025 - 13th International Conference on Sport Sciences Research and Technology Support
260

achieved 92.21% accuracy in cross-validation. The
additional 23 features contributed a modest 2.5% im-
provement, suggesting that the model performs effec-
tively even with a very minimal feature set. This find-
ing has practical implications for applications where
data collection capabilities are limited. This finding
shows that using only joint coordinates would be suf-
ficient to classify stroke sides.
5.2 Logistic Regression
The final model contained 28 features the validation
set accuracy was 94.38% ± 0.005, slightly worse than
the NB classifier and achieved 94.53% on the test
set. The model used features from all three fea-
ture sets. The final model parameters used were L2-
penalty, C=100.0 (inverse of regularization strength,
smaller values specify stronger regularization). Inter-
estingly the top-5 most important features would pro-
duce a 93.46% ± 0.01 accuracy, and the top-3 would
only achieve 88.72% ± 0.02. The top 5 features in-
clude T8-right upper arm lateral bending and verti-
cal pelvis axial bending, along with normalized EMG
readings of the latissimus dorsi and the right olecra-
non Z-coordinate.
5.3 Gradient Boosting Decision Tree
We first trained a base model of GBDT with all fea-
tures and selected the top-50 most important features,
after that we gradually decreased the number of fea-
tures until accuracy improved. The final model used
33 features. After hyperparameter tuning, the best
validation accuracy was achieved with: 15 leaves, a
learning rate of 0.050, colsample = 0.75, and subsam-
ple = 0.50. The best model achieved 96.02%± 0.01
on the validation set and 96.18% on the test set. The
top-5 most important features produce a model with
94.83% ± 0.01 accuracy. The used features are left
ulnar stiloid Z-coordinate and right top of hand Z-
coordinate, with left and right latissimus dorsi and left
shoulder abduction adduction joint angles.
5.4 Feature Importances
A core set of features (Figure 1) was identified as im-
portant across all three models, including the normal-
ized left ulnar styloid Z coordinate, right olecranon
Z coordinate, bilateral latissimus dorsi EMG activity,
vertical pelvis axial bending, left flexor carpi radialis
EMG activity, bilateral shoulder flexion/extension,
and bilateral knee abduction/adduction. When ex-
panding the analysis to features selected by at least
two models, additional relevant variables include
T8–right upper arm lateral bending, right ulnar styloid
(particularly important for the Naive Bayes model),
and left shoulder abduction/adduction, along with
several lower-importance features. Notably, in the
best-performing GBDT model, the right top of hand
Z coordinate had high relative importance, despite not
being selected by the other models.
The identified feature set reveals a clear anatomi-
cal and functional grouping relevant to kayaking per-
formance. Upper limb features, including wrist and
elbow positions, shoulder joint angles, and upper-
body EMG activity, contribute primarily to paddle
control and propulsion. Trunk features, such as verti-
cal pelvis axial bending and upper spinal lateral bend-
ing, reflect core stability and rotational control dur-
ing the stroke. Lower limb features, notably knee ab-
duction/adduction, indicate the role of leg position-
ing in anchoring and force transfer. These findings
highlight the interdependence of upper body mechan-
ics, trunk stability, and lower limb engagement in
accurately distinguishing stroke sides using machine
learning models.
Figure 1: List of most important features by model.
In terms of feature utilization, both NB and LR
models rely on a smaller but more discriminative fea-
ture set, while GBDT makes use of a broader range of
features—likely due to its use of random resampling
during training. Interestingly, the NB model showed
strong performance using only coordinate-based fea-
tures, suggesting that, in resource-constrained scenar-
ios, coordinate data alone may suffice for side classifi-
cation. GBDT achieved the highest overall accuracy,
benefiting from its ability to model feature interac-
tions, though this advantage resulted in only a 2.5%
improvement. While NB slightly outperformed LR in
the validation set and underperformed it in the test set,
the marginal accuracy gain does not justify its higher
complexity.
Tempo-based relative time averages — calculated
across all available data (training and test sets com-
bined) — are shown in Figure 2 for the five most im-
portant features: normalized left ulnar styloid Z coor-
Machine Learning-Based Stroke Segmentation in Kayaking Using Integrated IMU and EMG Data
261

dinate, right olecranon Z coordinate, bilateral latis-
simus dorsi EMG activity, and vertical pelvis axial
bending. The blue vertical line indicates the midpoint
of the tempo, separating right and left hand strokes.
These features consistently ranked highest in impor-
tance across all classifiers, reflecting their reliability
and discriminative power for stroke side classifica-
tion.
The temporal profiles of these features reveal dis-
tinct and interpretable biomechanical patterns. For
example, the bilateral latissimus dorsi muscles show
unilateral activation that aligns with the stroke side,
being active only during the corresponding stroke
phase. Shoulder flexion/extension patterns also show
a clear alternation across the tempo midpoint, with the
left shoulder exhibiting positive values during right-
hand strokes and negative values during left-hand
strokes. Notably, the normalized Z coordinates of
the left ulnar styloid and right olecranon cross over
at the stroke transition. The right olecranon Z coor-
dinate remains below 0.25 during right strokes and
rises above 0.25 during left strokes, while the left ul-
nar styloid shows the inverse pattern. These coordi-
nated shifts across features illustrate a synchronized
change in posture and muscle engagement, reinforc-
ing their significance in stroke classification. These
profiles may be used as templates for stroke separa-
tion and to identify systematic errors in athletes.
Figure 2: Tempo relative time feature averages.
5.5 Statistical Analysis of Errors
Model performances are summarized in Table 1.
To evaluate the differences in classification accuracy
among the three models—Logistic Regression (LR),
Naive Bayes (NB), and Gradient Boosting Decision
Trees (GBDT)—we conducted statistical tests on the
cross-validation results. Normality of the pairwise
differences in model accuracies was assessed using
the Shapiro-Wilk test. The results indicated no sig-
nificant deviation from normality for any model pair:
LR vs. NB (W=0.922, p=0.543), NB vs. GBDT
(W=0.899, p=0.404), and LR vs. GBDT (W=0.999,
p=0.9998). These results justify the use of parametric
tests for further comparisons.
Three paired-sample t-tests were performed to
compare model accuracies. There was no statistically
significant difference between LR and NB (t=-0.964,
p=0.390). However, GBDT showed significantly
higher accuracy compared to both LR (t=13.816,
p=0.0001) and NB (t=7.564, p=0.0016). These find-
ings suggest that GBDT outperforms both LR and NB
in classification accuracy under the tested conditions.
Table 1: Stroke side classification accuracy of machine
learning models on validation and test set (%).
Accuracy
Model Val. set Test set
NB 94.71 94.48
LR 94.38 94.53
GBDT 96.02 96.18
Table 2 summarizes the MAEOSD of the classi-
fiers in milliseconds. As expected, the GBDT model
achieved the best performance, with a mean absolute
onset difference of 24.6 ± 51.6 ms. Considering that
the average stroke duration in the test set is 639.6
± 88.4 ms, this corresponds to an average onset de-
tection error of only 4.5%, highlighting the GBDT
model’s suitability for real-time classification scenar-
ios. The results show that the GBDT model achieves
tolerable stroke onset duration error.
Table 2: Mean absolute onset differences on the test set
(ms).
Model MAEOSD
NB 36.5 ± 56.4
LR 35.5 ± 49.7
GBDT 24.6 ± 51.6
Per-sample predictions were also aggregated at
the stroke level to evaluate whether any entire strokes
were misclassified. On the validation set, 14 mis-
classified strokes were observed for both the NB and
LR models, while the GBDT model misclassified 12
strokes. Notably, no misclassified strokes were found
in the test set for any of the models. These results
indicate that all three models achieve high aggregate
accuracy at the stroke level.
Figure 3 illustrates the classification accuracy of
left and right hand strokes across the normalized
stroke cycle for the GBDT model. The two curves are
nearly identical, indicating symmetrical model per-
formance between stroke sides. As anticipated, clas-
sification accuracy declines in the first and last 10%
icSPORTS 2025 - 13th International Conference on Sport Sciences Research and Technology Support
262
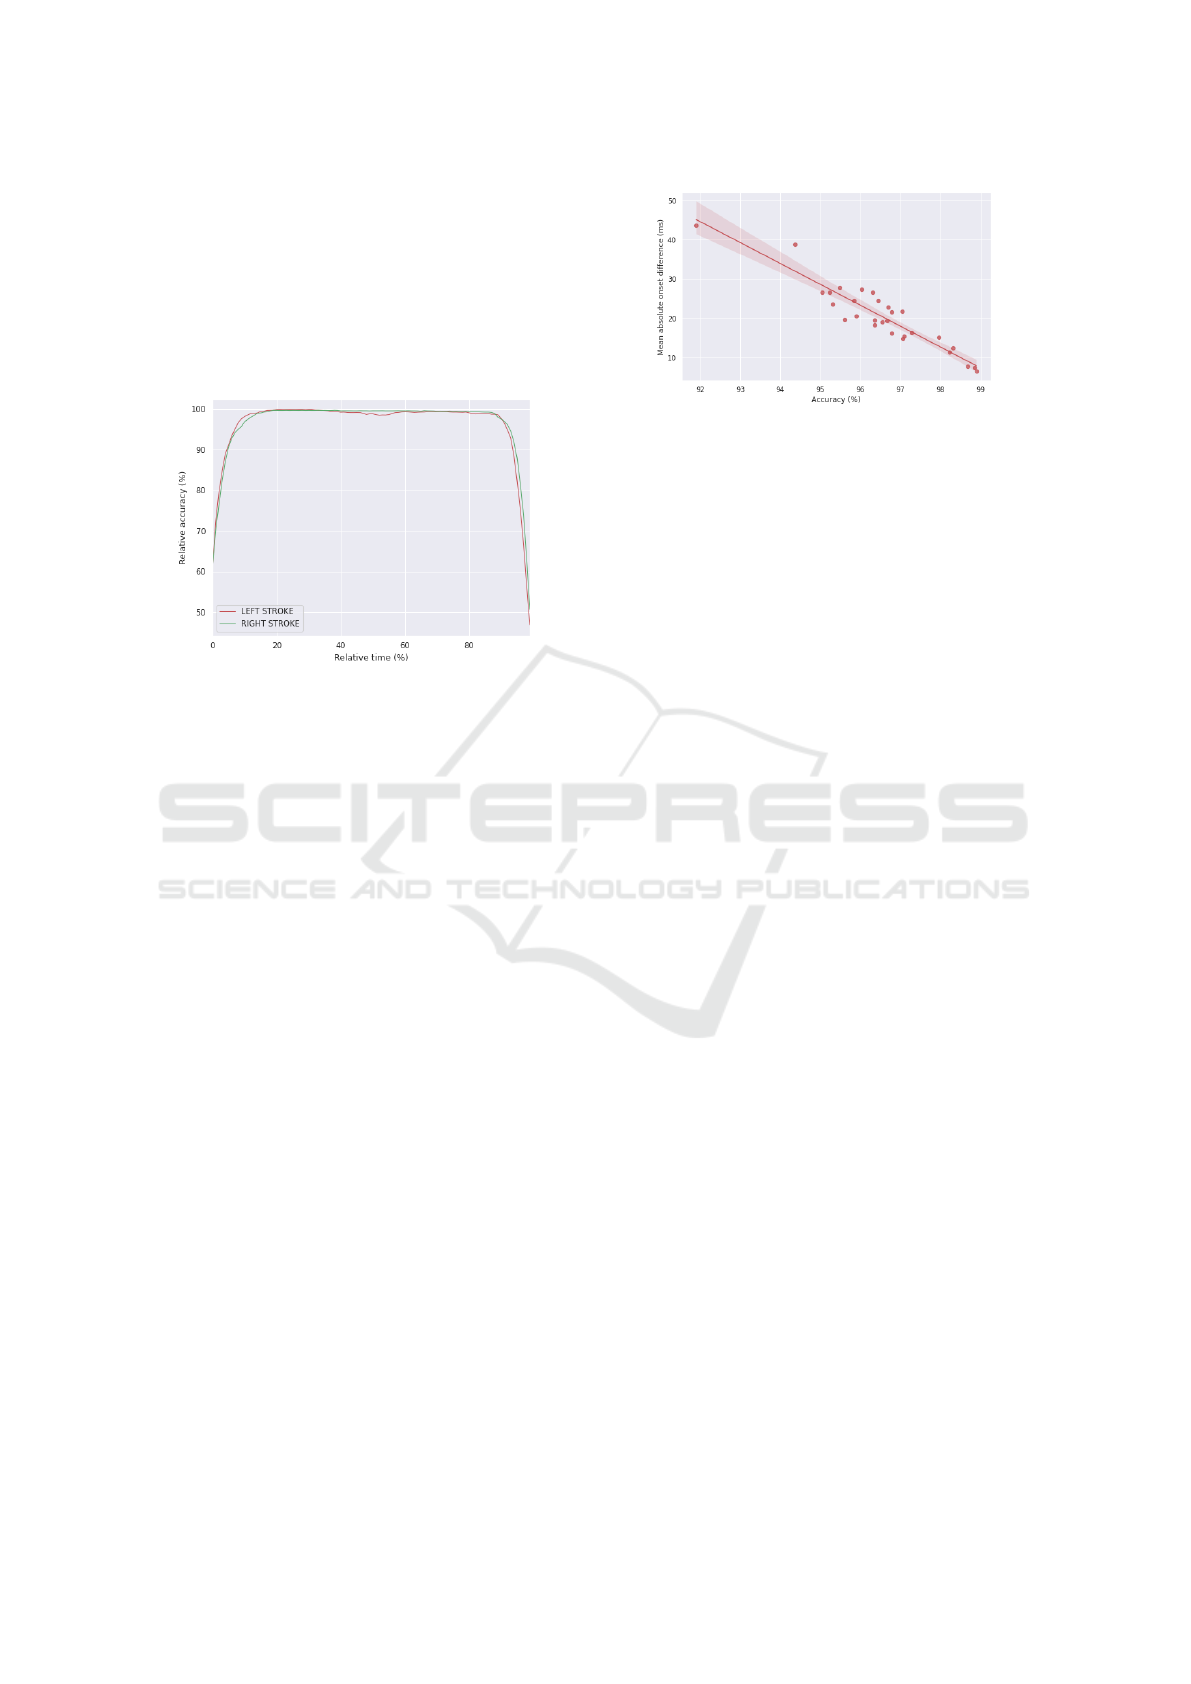
of the stroke cycle — regions associated with greater
motion variability and transitional dynamics. This ob-
servation aligns with earlier findings on stroke onset
detection error, which is most pronounced at stroke
boundaries. In contrast, the central 80% of the stroke
is consistently classified with high accuracy, suggest-
ing that mid-stroke movement patterns are more sta-
ble and distinguishable.
Figure 3: Relative time accuracy for left and right hand
strokes of GBDT model.
An increase in stroke pace does not appear to sig-
nificantly impact the overall classification efficiency
of the models. Interestingly, the 90 strokes per minute
(SPM) condition yields the highest average stroke on-
set detection error and the lowest classification ac-
curacy among all tested stroke rates for the best-
performing GBDT model. This decrease in accuracy
is primarily due to an outlier on-water measurement
test that yielded only 88% accuracy. When this outlier
is excluded, stroke pace does not have a statistically
significant effect on classification accuracy, indicat-
ing that the model generalizes well across a range
of movement speeds and model performance is sta-
ble and robust with respect to variations in stroke fre-
quency.
Figure 4 presents the per-subject classification ac-
curacy (x-axis) plotted against the mean absolute on-
set detection error (y-axis). A very strong nega-
tive correlation is observed between these two met-
rics (Pearson’s R=-0.9346). The fitted regression line
has a slope of -8.55, meaning that for every 1% in-
crease in classification accuracy, the mean absolute
onset detection error decreases by approximately 8.55
milliseconds. This result suggests that improvements
in classification performance are directly associated
with greater temporal precision in detecting stroke on-
set.
In practical terms, subjects for whom the model
struggles to correctly classify stroke sides also tend
to show larger deviations in onset timing. This high-
lights the interdependence of spatial and temporal as-
Figure 4: Per-subject accuracy and mean absolute onset dif-
ference (outlier removed).
pects of stroke recognition, and suggests that efforts
to improve classification accuracy may also yield ben-
efits in onset timing accuracy.
This relationship is further supported by the trends
observed in Figure 3, which shows classification ac-
curacy across the normalized time course of a stroke.
Accuracy is lowest at the earliest (0–10%) and latest
(90–100%) segments of a stroke, where motion tends
to be more variable and transitions are more subtle.
These boundary regions likely contribute dispropor-
tionately to onset detection error, reinforcing the con-
nection between reduced accuracy and timing impre-
cision.
The primary factor affecting classification error
appears to be inter-subject variability, with accuracy
rates differing significantly between athletes, ranging
from 91.89% to 98.9%, when the outlier is removed.
This variability likely reflects individual differ-
ences in technique and style concentrated in the tran-
sitional period between two strokes, which warrants
further investigation in future research.
We hypothesize that subjects exhibiting lower ac-
curacy rates demonstrate greater variability in the fea-
tures utilized by the GBDT model. Such variabil-
ity may arise from inconsistent stroke techniques, a
wider range of hand movement patterns, or variations
in muscle activation timing and intensity, all of which
can challenge the model’s ability to generalize and
accurately classify stroke sides. Conversely, athletes
with a more stable and consistent style are likely to
produce more homogeneous training data, resulting in
higher classification accuracy. Furthermore, we pro-
pose that athletes with higher classification accuracy
may display a reduced number of distinct muscle ac-
tivation sequences, potentially due to less variability
in technique or lower muscle fatigue. These insights
emphasize the importance of individual biomechani-
cal factors in classifier performance and highlight av-
enues for personalized model optimization.
Machine Learning-Based Stroke Segmentation in Kayaking Using Integrated IMU and EMG Data
263

6 CONCLUSION
This study evaluated and compared the performance
of three machine learning models — Naive Bayes
(NB), Logistic Regression (LR), and Gradient Boost-
ing Decision Trees (GBDT) — for classifying stroke
sides based on biomechanical and electromyographic
features. A core set of features, primarily normal-
ized joint coordinate data and Latissimus Dorsi EMG
activity, was found to be highly informative across
all models. Remarkably, the NB classifier achieved
strong accuracy using only a minimal feature set con-
sisting of three coordinate-based variables, highlight-
ing its potential utility in scenarios with limited data
acquisition capabilities.
Among the models, GBDT demonstrated the
highest classification accuracy (96.69% on the test
set) and the lowest stroke onset detection error (24.6 ±
51.6 ms), indicating its suitability for real-time appli-
cations despite increased model complexity. Logistic
Regression offered a modest improvement over NB
but with only marginal gains relative to the additional
complexity involved. The strong negative correlation
between classification accuracy and onset detection
error suggests that improvements in spatial classifi-
cation directly enhance temporal precision.
Stroke pace and side had minimal effect on model
performance, whereas significant inter-subject vari-
ability was observed. This variability likely reflects
individual differences in stroke technique and mus-
cle activation patterns, which influence classifier ac-
curacy. Athletes with more consistent movement
patterns exhibited higher accuracy, underscoring the
importance of personalized biomechanical factors in
model generalization.
Importantly, since the most critical features in-
clude joint coordinates, these results suggest that pose
estimation models applied to video feeds could pro-
vide a practical and non-invasive means of acquiring
the necessary data for stroke side classification. This
opens the possibility of implementing the classifica-
tion pipeline in real-world settings without the need
for extensive sensor instrumentation.
Finally, we plan to test our hypotheses regarding
muscle activation order and per-subject variability in
future research to better understand their impact on
classification performance and to improve model per-
sonalization.
Overall, these findings demonstrate that effective
stroke side classification can be achieved using a rela-
tively small set of biomechanical features, with gradi-
ent boosting methods providing the best performance.
Future work should explore subject-specific adapta-
tions, further investigate biomechanical sources of
inter-subject variability, and evaluate the integration
of video-based pose estimation for broader applica-
bility.
REFERENCES
Bonaiuto, V., Gatta, G., Romagnoli, C., Boatto, P., Lanotte,
N., and Annino, G. (2020). A pilot study on the e-
kayak system: A wireless daq suited for performance
analysis in flatwater sprint kayaks.
Chen, T. and Guestrin, C. (2016). Xgboost.
Garnier, Y. M., Hilt, P. M., Sirandre, C., Ballay, Y., Lep-
ers, R., and Paizis, C. (2023). Quantifying paddling
kinematics through muscle activation and whole body
coordination during maximal sprints of different du-
rations on a kayak ergometer: A pilot study. Interna-
tional Journal of Environmental Research and Public
Health, 20(3).
Harbour, E., McAlpine, P., and Neville, J. (2021). Pad-
dle mechanics differ between on-water and ergometer
sprint kayaking.
Kim, J., Koo, B., Nam, Y., and Kim, Y. (2021). semg-based
hand posture recognition considering electrode shift,
feature vectors, and posture groups.
Klitgaard, K. K., Hauge, C., Oliveira, A. S., and Heinen,
F. (2021). A kinematic comparison of on-ergometer
and on-water kayaking. European Journal of Sport
Science, 21(10):1375–1384. PMID: 33001757.
Kranzinger, C., Bernhart, S., Kremser, W., Venek, V.,
Rieser, H., Mayr, S., and Kranzinger, S. (2023). Clas-
sification of human motion data based on inertial mea-
surement units in sports: A scoping review.
Lauder, M. and Kemecsey, I. (1999). Kayak technique di-
agnosis and remedies, part two. Canoe Focus, pages
18–19.
Li, M. (2017). The progress of biomechanical researches in
kayaking.
Liu, L., Wang, H., Qiu, S., Zhang, Y., and Hao, Z.-D.
(2021). Paddle stroke analysis for kayakers using
wearable technologies.
McDonnell, L. K., Hume, P., and Nolte, V. (2012). An
observational model for biomechanical assessment of
sprint kayaking technique.
Raez, M. B., Hussain, M. S., and Mohd-Yasin, F. (2006).
Techniques of emg signal analysis: detection, pro-
cessing, classification and applications. Biological
Procedures Online, 8:11–35. Epub 2006 Mar 23.
Erratum in: Biol Proced Online. 2006;8:163. doi:
10.1251/bpo124.
Stegeman, D. and Hermens, H. (2007). Standards for suface
electromyography: The european project surface emg
for non-invasive assessment of muscles (seniam). 1.
Technologies, M. (2025). Xsens biomechanical model.
Vasiljev, R., Vasiljev, I., Voronin, D. I., and Zhigalina, A.
(2024). Features of pressure asymmetry manifestation
on the seat of kayakers on a rowing ergometer.
icSPORTS 2025 - 13th International Conference on Sport Sciences Research and Technology Support
264
