
Classification of Augmented Reality Design Recommendations on User
Experience Dimensions: Preliminary Study Results
Stefan Graser
1 a
, Jessica Kollmorgen
2 b
, Martin Schrepp
3 c
,
Mar
´
ıa Jos
´
e Escalona
4 d
and Stephan B
¨
ohm
1 e
1
CAEBUS Center for Advanced E-Business Studies, RheinMain University of Applied Sciences, Wiesbaden, Germany
2
University of Applied Sciences Emden/Leer, Emden, Germany
3
SAP SE, Walldorf, Germany
4
University of Seville, Seville, Spain
Keywords:
Augmented Reality (AR), Corporate Training (CT), AR Design Recommendations, AR Guidelines, User
Experience (UX), UXARcis.
Abstract:
Augmented Reality (AR) in Corporate Training (CT) enables immersive and interactive learning scenarios,
resulting in a new user experience (UX). Within software development, UX is a crucial success factor. While
numerous AR-specific design recommendations exist, it remains unclear how these contribute to the actual user
experience perceived by learners. This misalignment between intended and actual UX highlights the challenge
for AR authors. Concerning UX evaluation, questionnaires can be used to collect data from target groups and
produce reliable quantitative data describing UX quality. However, a questionnaire should not include too
many items to capture the UX impression of users to avoid being too time-consuming. Since UX question-
naires typically capture only high-level impressions, their results often do not provide clear suggestions for
designers or developers on how to improve an application. Linking design recommendations to questionnaire
scales would help connect UX evaluation results more directly to design changes that are likely to improve
users’ UX impressions. We describe a study establishing such a mapping for the application domain of AR in
corporate training. Preliminary results provide an initial classification of AR design recommendations across
relevant UX dimensions.
1 INTRODUCTION
Augmented Reality (AR) supplements the real world
with virtual content (Azuma, 1997). Digital infor-
mation (for example, directions, labels, or 3D mod-
els) integrates into the user’s view of the real world
through smart glasses or smartphone displays. This
enables a new way of conducting and experiencing
tasks across various application domains, such as edu-
cation, training, or cultural heritage. The field of Cor-
porate Training (CT), in particular, shows great poten-
tial for applying AR as the technology enables inter-
active and immersive learning scenarios. As a result,
a
https://orcid.org/0000-0002-5221-2959
b
https://orcid.org/0000-0003-0649-3750
c
https://orcid.org/0000-0001-7855-2524
d
https://orcid.org/0000-0002-6435-1497
e
https://orcid.org/0000-0003-3580-1038
various aspects, such as training engagement, motiva-
tion, and effectiveness, can be improved (Billinghurst
and Duenser, 2012; Chang et al., 2020; Criollo-C
et al., 2021).
AR introduces new learning formats differing
from classical methods, resulting in a distinct user
experience (UX) for learners. In the software devel-
opment process, UX is a key factor for the accep-
tance, use, and success of digital systems (Hinderks
et al., 2019). Thus, it is essential to ensure a positive
UX (Rauschenberger et al., 2013). Therefore, prod-
uct designers and developers typically apply design
recommendations as standards and best practices for
system design and development, intending to achieve
a good UX by designing the product features in ac-
cordance with the respective guidelines (Hassenzahl,
2004). Regarding AR, a large number of AR-specific
design recommendations exist in the literature (Fu
et al., 2016; Krauß et al., 2021a; Krauß et al., 2021b).
Graser, S., Kollmorgen, J., Schrepp, M., Escalona, M. J. and Böhm, S.
Classification of Augmented Reality Design Recommendations on User Experience Dimensions: Preliminary Study Results.
DOI: 10.5220/0013778000003985
Paper published under CC license (CC BY-NC-ND 4.0)
In Proceedings of the 21st International Conference on Web Information Systems and Technologies (WEBIST 2025), pages 511-520
ISBN: 978-989-758-772-6; ISSN: 2184-3252
Proceedings Copyright © 2025 by SCITEPRESS – Science and Technology Publications, Lda.
511

However, the actual UX perceived by the users may
differ significantly from the designer’s intention (Has-
senzahl, 2004). Understanding and gathering insights
into the actual experience, therefore, requires apply-
ing methods of UX measurement. However, current
research highlights different challenges in integrating
UX into the software development process (Petters-
son et al., 2018; Kashfi et al., 2019; Kollmorgen et al.,
2025).
Various methods for measuring and quantifying
the UX exist in literature (Albert and Tullis, 2022).
Standardized UX questionnaires are the most com-
monly applied. These, however, often lack context
specificity. As the relevant UX dimensions differ de-
pending on the product, it is crucial to apply context-
specific methods. Only a limited number of AR-
specific UX measurement methods are available, dif-
fering in structure and focus (Graser et al., 2024a;
Graser et al., 2025c). Moreover, empirical findings
from UX evaluation methods are often challenging
to interpret and translate into actionable design im-
provements. Quantitative results, which are usually
based on concise and time-efficient questionnaires,
often capture only high-level impressions and may
indicate dissatisfaction without revealing underlying
causes. On the other hand, qualitative data is often too
general and lacks clear references to specific system
weaknesses. This highlights a fundamental misalign-
ment: While designers rely on design recommenda-
tions to develop AR applications, it remains unclear
whether these recommendations actually enhance the
UX, as they often lack the tools to validate this. In
turn, there is a lack of understanding of the applica-
tion of empirical measurement methods and the in-
terpretation of their results (Pettersson et al., 2018;
Kashfi et al., 2019).
To sum up, even with domain-specific ques-
tionnaires, it often remains unclear how measured
weaknesses and problems can be specifically reme-
died. There is often an insufficient connection
between empirical UX measurement and concrete
design measures. Although numerous design rec-
ommendations exist, their impact on specific UX
dimensions has not been proven, making it challeng-
ing for designers and software developers to select
the most suitable recommendation for the respective
UX weakness. Mapping design recommendations to
UX dimensions is, therefore, useful and necessary.
To our knowledge, no approach exists combining
development recommendations with measurement
scales in research. This study addresses this gap in
the specific context of AR in CT. We aim to bridge
the gap between AR authors and users. Therefore,
our objective is to provide an initial setup for a
bidirectional, more evidence-based way to develop
AR applications in CT while fostering a positive
UX. We classify AR-specific design recommenda-
tions based on empirically validated, relevant UX
dimensions. By empirically mapping AR design
recommendations to UX dimensions, we aim to
provide actionable insights supporting both the
development and evaluation of AR applications in
CT. We present preliminary findings from a quan-
titative online survey. Based on this, we propose a
structured approach for linking design improvements
to measured UX deficiencies. Thus, this research
contributes to closing the gap between AR design
theory and practical UX evaluation in the domain of
Corporate Training. Moreover, this contributes to the
innovative development of user-centric, interactive
systems within the field of Human-Computer Inter-
action (HCI). This article is based on our previous
research (Graser et al., 2025a; Graser et al., 2025c).
Against this background, we address the following
research question:
RQ: Which relationships exist between AR design
recommendations and the relevant UX dimen-
sions?
The article is structured as follows: Section 2 in-
troduces the related work regarding our previous re-
search relevant for this study. Section 3 describes the
methodological approach of this study. Preliminary
study results are presented in Section 4. Section 5
provides the discussion. Section 6 concludes includ-
ing insights for future work.
2 RELATED RESEARCH
This section presents an overview of the related re-
search, providing the basis of this pre-study. We intro-
duce UX evaluation in 2.1. Based on this, we present
the UXARcis questionnaire in 2.2. Moreover, we il-
lustrate existing design recommendations for AR in
CT (see 2.3).
2.1 Quantifying UX
UX is defined as the ”user’s perceptions and re-
sponses that result from the use and/or anticipated
use of a system, product or service” (ISO9241-210,
2020). Thus, UX does not describe objective quality
criteria, but rather the individual subjective impres-
sions of users, including emotions and beliefs, result-
ing from their interaction with an application. Users
have corresponding expectations for interaction with
WEBIST 2025 - 21st International Conference on Web Information Systems and Technologies
512
systems, which raises the question of how individual
UX can be continuously evaluated in iterative soft-
ware development and how generalizable conclusions
can be drawn (Kollmorgen et al., 2024).
UX questionnaires are an established evaluation
method for this purpose. They enable systematic eval-
uation to identify weaknesses, strengths, and poten-
tial improvements, and to design user-centered devel-
opment (Lohse, 2011). The evaluation is carried out
using so-called UX dimensions or scales. These are
one-dimensional constructs that can positively or neg-
atively influence the user’s perception of the product
(Provost and Robert, 2013).
Depending on the system and use case, various
UX dimensions may be relevant. For example, while
users of online banking tools place a high value on di-
mensions such as trust and dependability, stimulation
and novelty are more relevant for online games (Koll-
morgen et al., 2024). UX questionnaires such as the
UEQ+, therefore, allow the relevant dimensions to be
individually compiled and queried depending on the
system (Schrepp and Thomaschewski, 2019). Over
the years, different dimensions have been added, such
as those specifically related to voice user interfaces
(Klein et al., 2020). Attempts have also been made to
develop domain-specific questionnaires, such as for
virtual reality (Tcha-Tokey et al., 2016). Research
highlights the necessity of domain-specific measure-
ment approaches (Pettersson et al., 2018). The ad-
vantage lies in quantitatively evaluating perception-
related and system-related UX dimensions and mak-
ing them comparable at the same time (Mortazavi
et al., 2024).
2.2 UXARcis Questionnaire
Only a limited number of AR-specific questionnaires
exist in research, also differing in structure and fo-
cus (Graser et al., 2024a). Against this background,
we identified the relevant UX dimensions for AR in
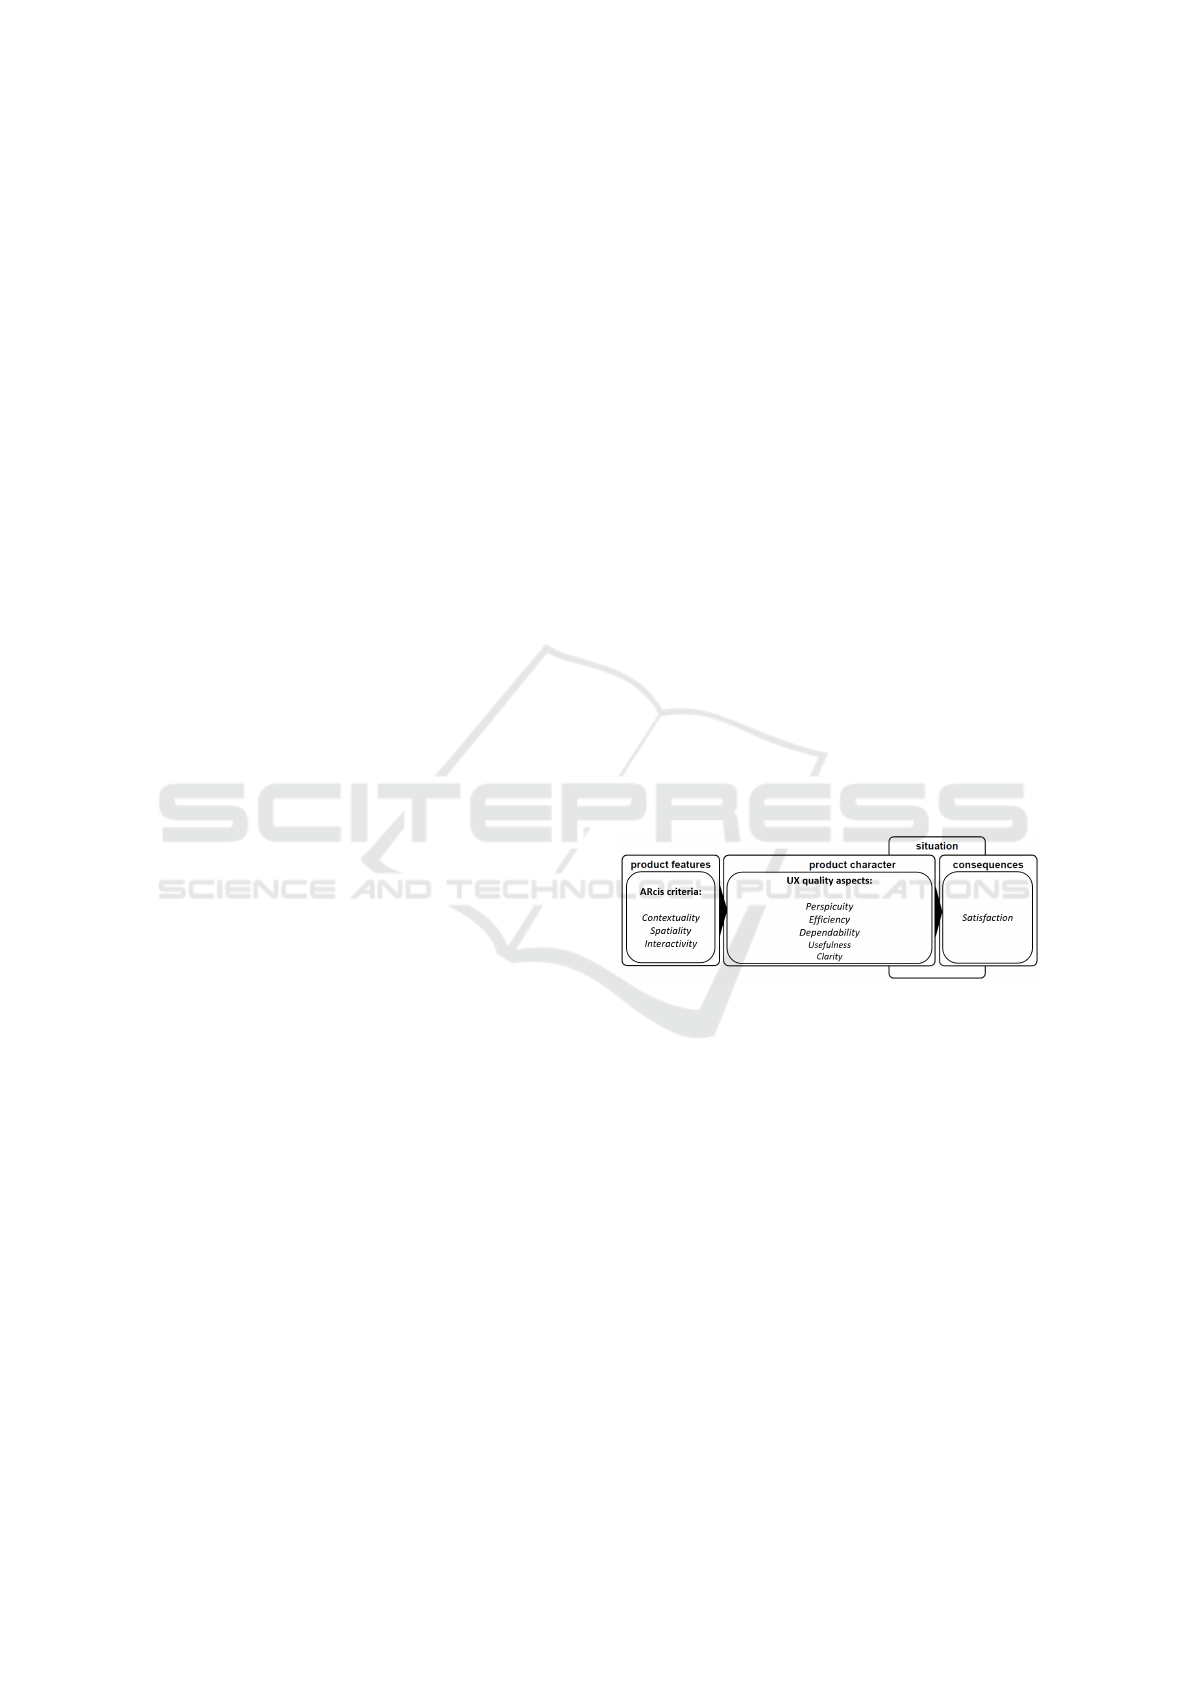
CT. Based on the UX model by (Hassenzahl, 2004),
we follow the understanding of breaking the UX di-
mensions down into product features and product
character. Regarding the product features, the AR-
cis criteria by (Kr
¨
uger et al., 2019; Kr
¨
uger, 2023)
represent the relevant system characteristics of AR
in relation to the display of information (Azuma,
1997) re-framed from a user’s perspective. Concern-
ing the product character, we followed the approach
by (Schrepp et al., 2023) describing UX with a set of
UX Quality Aspects (UX-QA). We evaluated the im-
portance of the UX-QA in relation to AR in CT and
identified five relevant UX-QAs (Graser et al., 2024c;
Graser et al., 2024b). The descriptions of the UX di-
mensions are shown in the following:
• Contextuality (Con): Integrated presentation of
virtual and physical elements.
• Spatiality (Spa): Assignment of unique spatial
properties to virtual elements by positioning them
within the physical environment.
• Interactivity (Int): Modification and manipula-
tion of virtual components by interacting with
physical objects.
• Perspicuity (PE): The user easily gets familiar
with the product and to learn how to use it.
• Efficiency (EF): The user can solve their tasks
without unnecessary effort. The product reacts
fast.
• Dependability (DE): The user feels in control of
the interaction. The product reacts predictably
and consistently to user commands.
• Usefulness (US): Using the product brings advan-
tages to the user. Using the product saves time and
effort.
• Clarity (CL): The user interface of the product
looks ordered, tidy, and clear.
Both product features and character were com-
bined, resulting in an adjusted UX model for AR in
CT (Graser and B
¨
ohm, 2025) (see Figure 1).
Figure 1: Adjusted UX model for AR in CT (Graser and
B
¨
ohm, 2025).
Based on this, the UXARcis questionnaire repre-
sents a context-specific UX questionnaire for AR in
CT, measuring both product features and character
(Graser et al., 2025c).
2.3 AR Design Recommendations
AR authoring as part of software engineering refers
to the development of AR applications. Within the
software engineering process, requirements engineer-
ing is an initial step in the development process
(Brooks, 1987; Hull et al., 2011; Pacheco et al., 2018;
de Almeida Pacheco et al., 2019). Over time, design
practices and lessons learned emerge based on expe-
rience gained during the development of the respec-
tive technology. This results in so-called design rec-
ommendations (sometimes referred to as ”guidelines”
Classification of Augmented Reality Design Recommendations on User Experience Dimensions: Preliminary Study Results
513

or even ”heuristics”), which serve as orientation and
standards for designers and developers. Similar to
the UX evaluation, it is necessary to apply context-
specific design recommendations to avoid neglecting
the specifics of a particular technology (Krauß et al.,
2021a; Krauß et al., 2021b).
In the context of AR, various design recommen-
dations exist. (Krauß et al., 2021b) identified a com-
prehensive set of recommendations regarding mixed
reality applications. They classified all design rec-
ommendations into thematically similar topics. How-
ever, due to technological development, AR is devel-
oping rapidly, resulting in new design practices and
recommendations. We applied the dataset by (Krauß
et al., 2021b) as a foundation. Based on a multi-
method approach, we identified new design recom-
mendations regarding AR published since 2020. We
further classified them into thematically similar top-
ics. For this, we applied an NLP approach, measur-
ing the semantic textural similarity between the state-
ments. Moreover, all resulting topics were evaluated
based on the importance of AR in CT. This results
in a total of 32 relevant topics. Lastly, for all topics
and the corresponding design recommendations, we
added summarizing descriptions to make them com-
municable (Graser et al., 2025a). The comprehensive
data set, including all topic descriptions, is available
online (See (Graser et al., 2025b)).
3 METHODOLOGICAL
APPROACH
This article presents a preliminary study based on our
prior research (Graser et al., 2025a; Graser et al.,
2025c). We aim to identify the relationships between
the identified AR design recommendation topics (see
2.3, (Graser et al., 2025a; Graser et al., 2025b)) and
the UX dimensions of the UXARcis (2.2, (Graser
et al., 2025c)). In particular, AR authors with expe-
rience in developing and designing AR applications
evaluate the influence of the design recommendation
topics on the UX dimensions when applied.
We conducted a quantitative online survey using
Unipark. To gather participants, we shared the sur-
vey on LinkedIn within our professional environment,
including different international AR-related develop-
ment groups. To ensure that only AR authors with ex-
pertise in developing and designing AR applications
were eligible to participate, we filtered based on their
experience with AR. We ensured this by asking two
filter questions. We considered whether the partici-
pant had already developed an AR application, fol-
lowed by the question of how long participants have
worked in the field of AR authoring. Participants who
had not yet created an application and therefore had
no experience were excluded. Moreover, participants
were asked to specify their role within the authoring
process, and we examined the specific AR applica-
tion domain. Afterwards, the participants were auto-
matically divided into two groups. The assignment
was performed randomly. Each group was shown 16
topic descriptions (Group 1: Topic descriptions 1–16;
Group 2: Topic descriptions 17–32) to be evaluated
in terms of their influence on the UX dimensions. In
particular, the participants could select the four op-
tions: (1) product features (ARcis), (2) product char-
acter (UX quality aspects), (3) both product features
and product character, or (4) none. Option (1) means
that the application of the respective topic only im-
pacts the ARcis criteria, whereas option (2) indicates
an influence solely on the UX quality aspects. Option
(3) implies an influence on both. Choosing option (4)
means that the topic has no influence on any UX di-
mension and, thus, is irrelevant. An illustrative ex-
ample from the survey is shown in the Appendix. A
quality assurance question was included in the mid-
dle of each group after the eighth topic. The group
division was performed to reduce the survey duration
and, thus, the abandonment rate. Finally, demograph-
ics regarding the age group, level of education, and
employment relationship were considered.
As the survey is still ongoing to collect more
data, we will present a preliminary empirically de-
rived classification between design recommendation
topics and related UX dimensions.
4 STUDY RESULTS
This section presents the preliminary results of this
study. We illustrate demographics and information
regarding the study participants in Section 4.1. More-
over, we provide the initial classification of the topics
on the UX dimensions in Section 4.2.
The results were collected between June 18 and
June 30, 2025. In summary, 207 people started the
questionnaire, and 138 submitted it. We conducted
data cleaning by dropping all participants who failed
to answer the filter and quality question correctly.
This results in a final sample size of 106. These are
divided into 56 participants for group 1 (N1) and 50
participants for group 2 (N2).
4.1 Demographics & Experience
The age distribution, based on the 95 that provided an
answer for this question in the total sample (N=106),
WEBIST 2025 - 21st International Conference on Web Information Systems and Technologies
514

highlights a focus on the so-called ”Generation Y,”
which was born between 1981 and 1996 and thus
ranges in age from 29 to 44. Two respondents be-
longed to ”Generation Z” (aged 18-28), while nine
participants belonged to ”Generation X” (aged 45-
60). No person of the ”Baby Boomer” generation (61-
79) was represented.
In terms of educational attainment, the majority
of respondents had an academic degree. No partici-
pant stated that a high school diploma was their high-
est level of education. Thirteen people had completed
an apprenticeship. The majority of the sample had
a bachelor’s degree (76 participants), followed by 15
participants with a master’s degree. Two people had a
doctorate.
There was also a wide range of professional back-
grounds. 23 participants were employed in small
or medium-sized companies, 28 in corporations, and
another 28 in (media) agencies. Forty respondents
worked at research institutions, and eight at public in-
stitutions, such as universities. Two people were self-
employed.
We further examined the participants’ experience
as AR authors. It should be noted that multiple as-
signments were possible, as many participants take on
several roles in AR projects. For this, we followed the
classification into four roles by (Krauß et al., 2021a):
• Concept developers: They create the first con-
cepts and drafts of an application. In some cases,
they manage to ignore technical limitations and
focus on the problem to be solved. 52 participants
(49.06%) assigned themselves to this role.
• Interaction designers: They focus on the mechan-
ics and interactivity of the application, with an
emphasis usually on the conceptual level. Their
tasks include conceiving mechanisms for locomo-
tion, navigation, and input and output, as well
as designing the interaction between the various
modalities used in AR systems. With 66 men-
tions (62.26%), this was the most frequently cho-
sen role.
• Content author: They focus on the creation of
animations, 3D models, visualizations, and ele-
ments such as shadows, textures, color schemes,
or sound design. 33 participants (31.13%) chose
this option.
• Technical developer: They do not focus exclu-
sively on the production of code and the de-
velopment of functions, but are usually also in-
volved in the technical feasibility and practicality
of concepts. This role was chosen by 29 people
(27.36%).
With regard to experience in developing AR appli-
cations, the distribution was as follows: the majority
of respondents (n = 42; 39.62%) had one to two years
of experience. Eighteen people reported two to three
years of experience, while 15 participants had three
to four years of professional experience. Another 17
authors had four to five years of experience, and 14
reported more than five years of experience in devel-
oping AR applications. Overall, the distribution of
authors with more than two years of experience is rel-
atively balanced.
There was a wide range of application contexts in
which the participants implemented AR projects: 42
people were active in academic teaching, 38 in the
context of cultural heritage (e.g., museums), 43 in the
field of games, 48 in industry and business, 32 in cor-
porate training, 34 in marketing and entertainment,
three people in the field of medicine, and a few men-
tions in the field of “digital twins” (other). This again
underscores the diversity of application fields in the
sample.
The broad range of professional backgrounds,
roles, and areas of application of the participants pro-
vides a comprehensive picture of the requirements
and challenges involved in designing AR applica-
tions. This diversity increases the validity of the fol-
lowing classification, as different perspectives and ex-
periences have been incorporated into the evaluation
of the design recommendations. Building on this ba-
sis, the next section presents the preliminary assign-
ment of the design recommendations to the UX di-
mensions.
4.2 Preliminary Classification
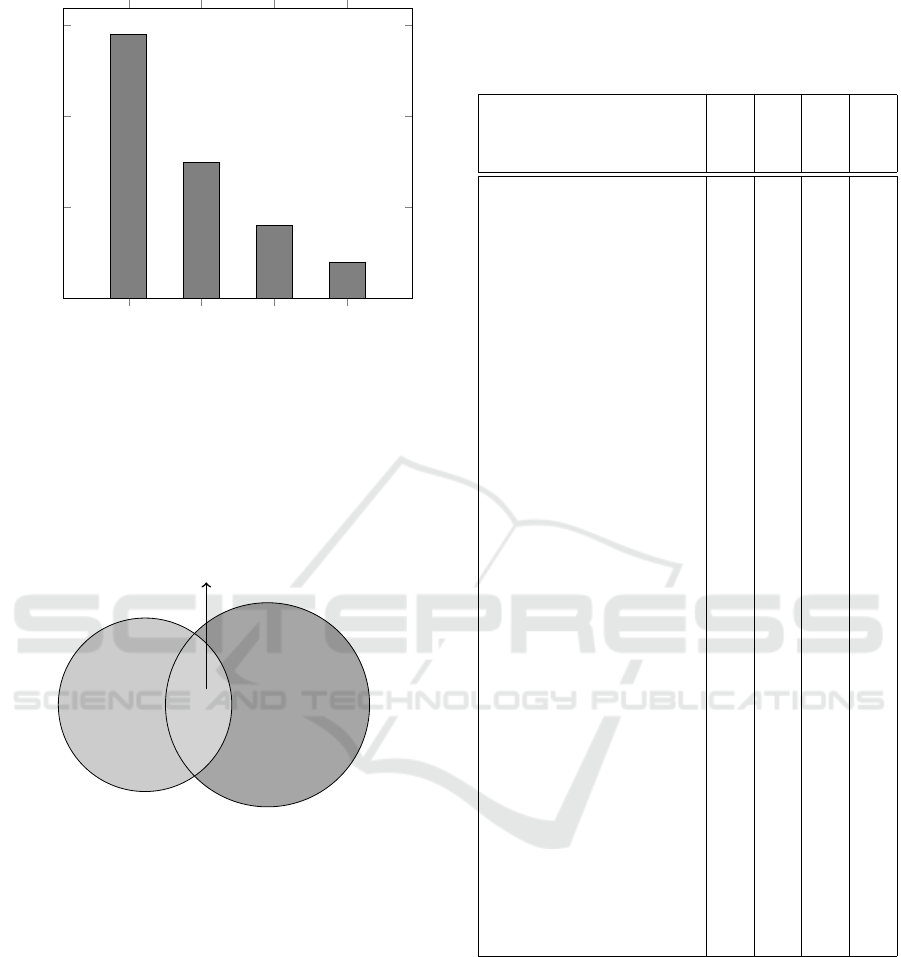
In the following, we present a preliminary classifica-
tion. Figure 2 illustrates the distribution of evaluation
results by the authors, exemplarily for topic (1). This
indicates that AR authors assume that the topic (1)
Appropriate interplay of virtual content and physical
environments mainly influences the product features
(ARcis criteria) of AR applications.
Table 1 presents a comprehensive classification of
all topics in relation to the UX dimensions. We high-
lighted the category with the most ratings in bold. In
summary, five topics were evaluated to influence the
product features (ARcis criteria), whereas 13 topics
refer to the product character (UX Quality Aspects,
short: UX-QA). Moreover, 13 topics were assigned to
both product features and character. Topic (31) Head-
locked content has the same number of ratings (n =
16) concerning product features and character, simi-
lar to topic (15) Encourage to explore, which has a
rating of 19 each. Thus, we chose both. In this case,
Classification of Augmented Reality Design Recommendations on User Experience Dimensions: Preliminary Study Results
515
ARcis UX-QA Both
None
0
10
20
30
29
15
8
4
Number of ratings of the AR authors
Figure 2: Distribution of classification by AR authors for
topic (1) Appropriate interplay of virtual content and phys-
ical environments.
a chi-square test would be necessary to reject the as-
sumption of a random distribution. Figure 3 shows
the topic distribution among the UX dimensions. A
comprehensive classification, including topic names,
is presented in the Appendix.
ARcis
UX-QA
5
13
14
Both
Figure 3: Classification of the 32 AR design recommenda-
tion topics to the UX dimensions.
5 DISCUSSION
The refinement and practical applicability of the iden-
tified relationships to improve the UX must be tested
in case studies involving AR authors. Design recom-
mendations naturally align with various UX criteria.
Thus, if we want to improve a dedicated UX scale,
a checklist of potential design improvements will re-
sult. If this checklist is manageable and interpretable,
allowing for clear design decisions, and if AR authors
are comfortable with the method, it can be effectively
applied in practical applications.
We currently have only a limited number of re-
sponses. This will be enhanced by further data col-
lection. Moreover, our study focuses on the applica-
Table 1: Overview of the classification of the AR design
recommendation topics to the UX dimensions. The num-
bers represent the number of authors rated for this classifi-
cation option.
AR Design Recommendation
Topics
ARcis
UX-QA
Both
None
(1) Appropriate interplay of vir-
tual content and physical envi-
ronments
29 15 8 4
(2) Attention directors 12 20 21 3
(3) Instructions 15 17 18 6
(4) Onboarding 19 14 21 2
(5) Hand & finger gestures 19 17 16 4
(6) Textures – Visual Realism
and Appearance of Objects
19 14 17 6
(7) Occlusion 18 16 18 4
(8) Image detection 17 16 19 4
(9) Handling Interruptions / Re-
localization
15 20 19 2
(10) Surface Detection 14 18 22 2
(11) Affordance 14 16 23 3
(12) Visual cues for object ma-
nipulation
17 18 16 5
(13) Object Placement 15 21 17 3
(14) Object Manipulation 17 17 20 2
(15) Encourage to explore 19 19 18 0
(16) Keep the focus on AR ex-
perience, but use 2D-UI On-
Screen elements when needed
15 19 20 2
(17) Error prevention & recov-
ery
22 16 10 2
(18) Consider and show User’s
required Effort
16 15 12 7
(19) Law of practice 13 21 13 3
(20) Inform about Waiting Time 11 14 20 5
(21) Text / Font 11 16 14 9
(22) Accessibility (visuals) 14 15 14 7
(23) Ergonomics (avoid muscle
fatigue)
16 18 16 0
(24) Ergonomics (avoid head &
neck fatigue)
14 19 11 6
(25) Pause / Breaks 8 21 17 4
(26) Performance 15 19 11 5
(27) Audio Feedback 13 15 17 5
(28) Feedback 16 18 12 4
(29) FOV 11 18 14 7
(30) Content Placement 15 20 14 1
(31) Headlocked content 16 16 12 6
(32) Anchored UI 14 16 17 3
tion domain of AR in CT. However, applications from
this domain are not so different from other learning
applications (for example, AR applications that sup-
port learning in museums or exhibitions). Thus, it
is promising to investigate whether this approach can
also be applied to other AR domains. Even if this may
not always be possible, the developed method can be
used to provide a similar mapping. Moreover, we did
not consider the classification results in relation to the
different roles of AR authors or the professional ex-
perience. This could also provide interesting differ-
ences.
WEBIST 2025 - 21st International Conference on Web Information Systems and Technologies
516

5.1 Implications
From a practical perspective, this further enables a
bidirectional application: On the one hand, it be-
comes evident how specific design recommendations
and their implementation affect the resulting UX. This
provides AR authors with concrete starting points for
enhancing the UX. On the other hand, when UX
deficits are identified, AR authors can trace them back
to associated design recommendations and adapt their
AR applications accordingly. This contributes to a
more evidence-based development, design, and eval-
uation process of AR applications. The internal com-
munication within the team among all participants is
facilitated, as the relationship between weaknesses
and approaches for improvement becomes transpar-
ent and clear.
In terms of interpretation, we want to illustrate a
concrete example by revisiting the topic (1) Appro-
priate interplay of virtual content and physical en-
vironments. Concerning the first classification, topic
(1) refers to the product features of AR applications.
If the UX evaluation revealed a deficit in the ARcis
criteria, one approach would be to consider the re-
spective guidelines for this topic. In particular, practi-
tioners should check whether the scenes and objects
are natural, realistic, and simple in design. In this
way, the classification can serve as a basis for itera-
tive product improvement, and even when resources
are scarce, it can be utilized in a way that positively
impacts the UX. This can be applied to all topics and
their classification (see Appendix for the comprehen-
sive results). Thus, this provides an initial under-
standing of which topics are relevant for which UX
dimensions. Moreover, mapping the UX evaluation
to the design recommendations facilitates communi-
cation within the team, as the relationship between
the weakness and the solution is made transparent.
From a research perspective, this can serve as a
sound empirical basis for future studies on the in-
terplay between UX evaluation and design practices
as well as the development of new methods. The
mapping enables researchers to systematically inves-
tigate the effectiveness of individual design recom-
mendations in improving specific UX dimensions, for
instance, through correlation or regression analyses.
Moreover, the results allow for the derivation of new
hypotheses regarding the impact of design decisions
on UX, such as the comparison of topic (1) to topic
(15) Encourage to explore. In this context, the respec-
tive design recommendations can be applied to an AR
application and thus systematically modified. Fur-
thermore, a UX evaluation can be conducted. Based
on the evaluation results, the hypotheses could be
tested. Thus, the impact of the design recommen-
dations on the UX could be verified. Moreover, this
could be useful in identifying interdependencies be-
tween both aspects.
5.2 Limitations
Some limitations of this work should also be men-
tioned. During classification, potential overlaps may
exist between individual UX dimensions or multiple
assignments, making interpretation difficult. How-
ever, this was addressed by explicitly allowing multi-
ple assignments and making them transparent in order
to reflect the complexity of the design in practice.
6 CONCLUSION & FUTURE
WORK
This article is a pre-study extending our previous re-
search on AR design recommendations and context-
specific UX evaluation of AR in CT. We aimed to
classify AR design recommendations on relevant UX
dimensions. In particular, we conducted a quantita-
tive online survey. AR authors were asked to evaluate
the influence of the design recommendation topics on
the UX dimensions. As preliminary results, we pro-
vide an initial classification. Thus, mapping design
recommendations to UX dimensions bridges the gap
between research and practice, as the findings of UX
evaluation become actionable. This closes the exist-
ing gap in research regarding the UX integration in
software development.
As this is a pre-study, we aim to further enhance
this approach by gathering additional data within the
online survey regarding the classification. This is the
first step in a multi-method approach. Based on this,
we aim to map the design recommendation topics to
the eight specific UX dimensions related to product
features and character in a second step. This allows us
to achieve a more specific differentiation. In the third
step, we aim to evaluate the classified design recom-
mendation topics in terms of their importance for each
respective UX dimension. By doing so, we will ob-
tain a prioritized, fine-grained mapping of AR design
recommendation topics to the structure of the UXAR-
cis. This will enable AR authors to identify which
design aspects are most critical for achieving and im-
proving a positive UX based on identified UX deficits.
Thus, this framework supports strategic and effective
design decisions, fostering the development of AR ap-
plications that are both user-centered and empirically
grounded.
Classification of Augmented Reality Design Recommendations on User Experience Dimensions: Preliminary Study Results
517

REFERENCES
Albert, W. B. and Tullis, T. T. (2022). Measuring the User
Experience. Collecting, Analyzing, and Presenting UX
Metrics. Morgan Kaufmann.
Azuma, R. T. (1997). A survey of augmented reality. Pres-
ence: Teleoperators & Virtual Environments, 6:355–
385.
Billinghurst, M. and Duenser, A. (2012). Augmented Real-
ity in the Classroom. Computer, 45(7):56–63.
Brooks (1987). No silver bullet essence and accidents of
software engineering. Computer, 20(4):10–19.
Chang, Y.-S., Hu, K.-J., Chiang, C.-W., and Lugmayr, A.
(2020). Applying Mobile Augmented Reality (AR)
to Teach Interior Design Students in Layout Plans:
Evaluation of Learning Effectiveness Based on the
ARCS Model of Learning Motivation Theory. Sen-
sors, 20(1):105.
Criollo-C, S., Abad-V
´
asquez, D., Martic-Nieto, M.,
Vel
´
asquez-G, F. A., P
´
erez-Medina, J.-L., and Luj
´
an-
Mora, S. (2021). Towards a New Learning Experi-
ence through a Mobile Application with Augmented
Reality in Engineering Education. Applied Sciences,
11(11):4921.
de Almeida Pacheco, B., Guimar
˜
aes, M., Correa, A. G.,
and Farinazzo Martins, V. (2019). Usability evalu-
ation of learning objects with augmented reality for
smartphones: A reinterpretation of nielsen heuris-
tics. In Agredo-Delgado, V. and Ruiz, P. H., editors,
Human-Computer Interaction, pages 214–228, Cham.
Springer International Publishing.
Fu, K. K., Yang, M. C., and Wood, K. L. (2016). De-
sign principles: Literature review, analysis, and fu-
ture directions. Journal of Mechanical Design,
138(10):101103.
Graser, S. and B
¨
ohm, S. (2025). The influence of system
characteristics on the user experience of augmented
reality applications: An experimental approach in cor-
porate training. In Proceedings of the 2025 9th Inter-
national Conference on Virtual and Augmented Real-
ity Simulations, ICVARS ’25, New York, NY, USA.
Association for Computing Machinery. [Unpublished
manuscript, accepted for publication].
Graser, S., Kirschenlohr, F., and B
¨
ohm, S. (2024a). User
experience evaluation of augmented reality: A sys-
tematic literature review. CENTRIC 2024, The Sev-
enteenth International Conference on Advances in
Human-oriented and Personalized Mechanisms, Tech-
nologies, and Services.
Graser, S., Schrepp, M., and B
¨
ohm, S. (2024b). Construc-
tion of the UXAR-CT – A User eXperience Question-
naire for Augmented Reality in Corporate Training.
CENTRIC 2024, The Seventeenth International Con-
ference on Advances in Human-oriented and Person-
alized Mechanisms, Technologies, and Services.
Graser, S., Schrepp, M., and B
¨
ohm, S. (2024c). UXAR-CT
– An Approach for Measuring UX for Mobile Aug-
mented Reality Applications in Corporate Training.
In Wei, J. and Margetis, G., editors, Human-Centered
Design, Operation and Evaluation of Mobile Com-
munications, pages 211–234, Cham. Springer Nature
Switzerland.
Graser, S., Schrepp, M., and B
¨
ohm, S. (2025a).
Identification of design recommendations for aug-
mented reality authors in corporate training. arXiv.
https://arxiv.org/abs/2507.21722.
Graser, S., Schrepp, M., Kollmorgen, J., Escalona,
M. J., and B
¨
ohm, S. (2025b). Classification of
ar design recommendations on ux dimensions: Pre-
liminary study results: Research report & data.
10.13140/RG.2.2.28124.71047.
Graser, S., Schrepp, M., Kr
¨
uger, J. M., and B
¨
ohm, S.
(2025c). Development of an innovative ux mea-
surement approach for augmented reality in corpo-
rate training. [Unpublished manuscript, accepted for
publication in the HCII 2025 - Late Breaking Papers
Springer LNCS volumes of the Proceedings.
Hassenzahl, M. (2004). The Thing and I: Understanding the
Relationship Between User and Product, pages 31–
42. Springer Netherlands, Dordrecht.
Hinderks, A., Winter, D., Schrepp, M., and
Thomaschewski, J. (2019). Applicability of user
experience and usability questionnaires. Journal of
Universal Computer Science, 254(13):1717–1735.
Hull, E., Jackson, K., and Dick, J. (2011). Requirements
Engineering. Springer-Verlag, Berlin Heidelberg, 3
edition.
ISO9241-210 (2020). Ergonomics of human-system inter-
action - part 210: Human-centred design for interac-
tive systems.
Kashfi, P., Feldt, R., and Nilsson, A. (2019). Integrating ux
principles and practices into software development or-
ganizations: A case study of influencing events. Jour-
nal of Systems and Software, 154:37–58.
Klein, A. M., Hinderks, A., Schrepp, M., and
Thomaschewski, J. (2020). Construction of ueq+
scales for voice quality: measuring user experience
quality of voice interaction. In Proceedings of Mensch
Und Computer 2020, MuC ’20, page 1–5, New York,
NY, USA. Association for Computing Machinery.
Kollmorgen, J., Hinderks, A., and Thomaschewski, J.
(2024). Selecting the Appropriate User Experience
Questionnaire and Guidance for Interpretation: The
UEQ Family. International Journal of Interactive
Multimedia and Artificial Intelligence, pages 1–14.
Kollmorgen, J., Pilz, J., Silva da Silva, T., Thomaschewski,
J., and Sch
¨
on, E.-M. (2025). Reframing challenges
in agile and ux: A new categorization approach. In
Schrepp, M., editor, Design, User Experience, and
Usability, pages 101–111, Cham. Springer Nature
Switzerland.
Krauß, V., Boden, A., Oppermann, L., and Reiners, R.
(2021a). Current Practices, Challenges, and De-
sign Implications for Collaborative AR/VR Applica-
tion Development. In Proceedings of the 2021 CHI
Conference on Human Factors in Computing Systems,
CHI ’21, pages 1–15, New York, NY, USA. Associa-
tion for Computing Machinery.
Krauß, V., Jasche, F., Saßmannshausen, S. M., Ludwig, T.,
and Boden, A. (2021b). Research and practice recom-
WEBIST 2025 - 21st International Conference on Web Information Systems and Technologies
518

mendations for mixed reality design – different per-
spectives from the community. In Proceedings of the
27th ACM Symposium on Virtual Reality Software and
Technology, VRST ’21, New York, NY, USA. Associ-
ation for Computing Machinery.
Kr
¨
uger, J. M. (2023). Augmented Reality for Learning -
The Role of Contextuality, Interactivity, and Spatiality
for AR-based Learning Experiences. Doctoral disser-
tation, University of Duisburg-Essen.
Kr
¨
uger, J. M., Buchholz, A., and Bodemer, D. (2019). Aug-
mented reality in education: Three unique character-
istics from a user’s perspective. In Chang, M., So,
H.-J., Wong, L.-H., Yu, F.-Y., and Shih, J. L., edi-
tors, Proceedings of the 27th International Conference
on Computers in Education, pages 412–422, Taiwan.
Asia-Pacific Society for Computers in Education.
Lohse, M. (2011). Bridging the gap between users’ expec-
tations and system evaluations. In 2011 RO-MAN 20th
IEEE International Symposium on Robot and Human
Interactive Communication, pages 485–490.
Mortazavi, E., Doyon-Poulin, P., Imbeau, D., Taraghi, M.,
and Robert, J.-M. (2024). Exploring the landscape of
ux subjective evaluation tools and ux dimensions: A
systematic literature review (2010–2021). Interacting
with Computers, 36(4):255–278.
Pacheco, C., Garc
´
ıa, I., and Reyes, M. (2018). Require-
ments elicitation techniques: a systematic literature
review based on the maturity of the techniques. IET
Software, 12(4):365–378.
Pettersson, I., Lachner, F., Frison, A.-K., Riener, A., and
Butz, A. (2018). A Bermuda Triangle? A Review
of Method Application and Triangulation in User Ex-
perience Evaluation. In Proceedings of the 2018 CHI
Conference on Human Factors in Computing Systems,
CHI ’18, page 1–16, New York, NY, USA. Associa-
tion for Computing Machinery.
Provost, G. and Robert, J.-M. (2013). The dimensions of
positive and negative user experiences with interac-
tive products. In Marcus, A., editor, Design, User
Experience, and Usability. Design Philosophy, Meth-
ods, and Tools, pages 399–408, Berlin, Heidelberg.
Springer Berlin Heidelberg.
Rauschenberger, M., Schrepp, M., Cota, M. P., Olschner, S.,
and Thomaschewski, J. (2013). Efficient measurement
of the user experience of interactive products. how to
use the user experience questionnaire (ueq).example:
Spanish language version. Int. J. Interact. Multim. Ar-
tif. Intell., 2:39–45.
Schrepp, M., Kollmorgen, J., Meiners, A.-L., Hinderks,
A., Winter, D., Santoso, H., and Thomaschewski, J.
(2023). On the Importance of UX Quality Aspects for
Different Product Categories. International Journal
of Interactive Multimedia and Artificial Intelligence,
8:1.
Schrepp, M. and Thomaschewski, J. (2019). Design and
validation of a framework for the creation of user ex-
perience questionnaires. International Journal of In-
teractive Multimedia and Artificial Intelligence, 5(7).
Tcha-Tokey, K., Loup-Escande, E., Christmann, O., and
Richir, S. (2016). A questionnaire to measure the
user experience in immersive virtual environments. In
Proceedings of the 2016 Virtual Reality International
Conference, VRIC ’16, New York, NY, USA. Associ-
ation for Computing Machinery.
Classification of Augmented Reality Design Recommendations on User Experience Dimensions: Preliminary Study Results
519
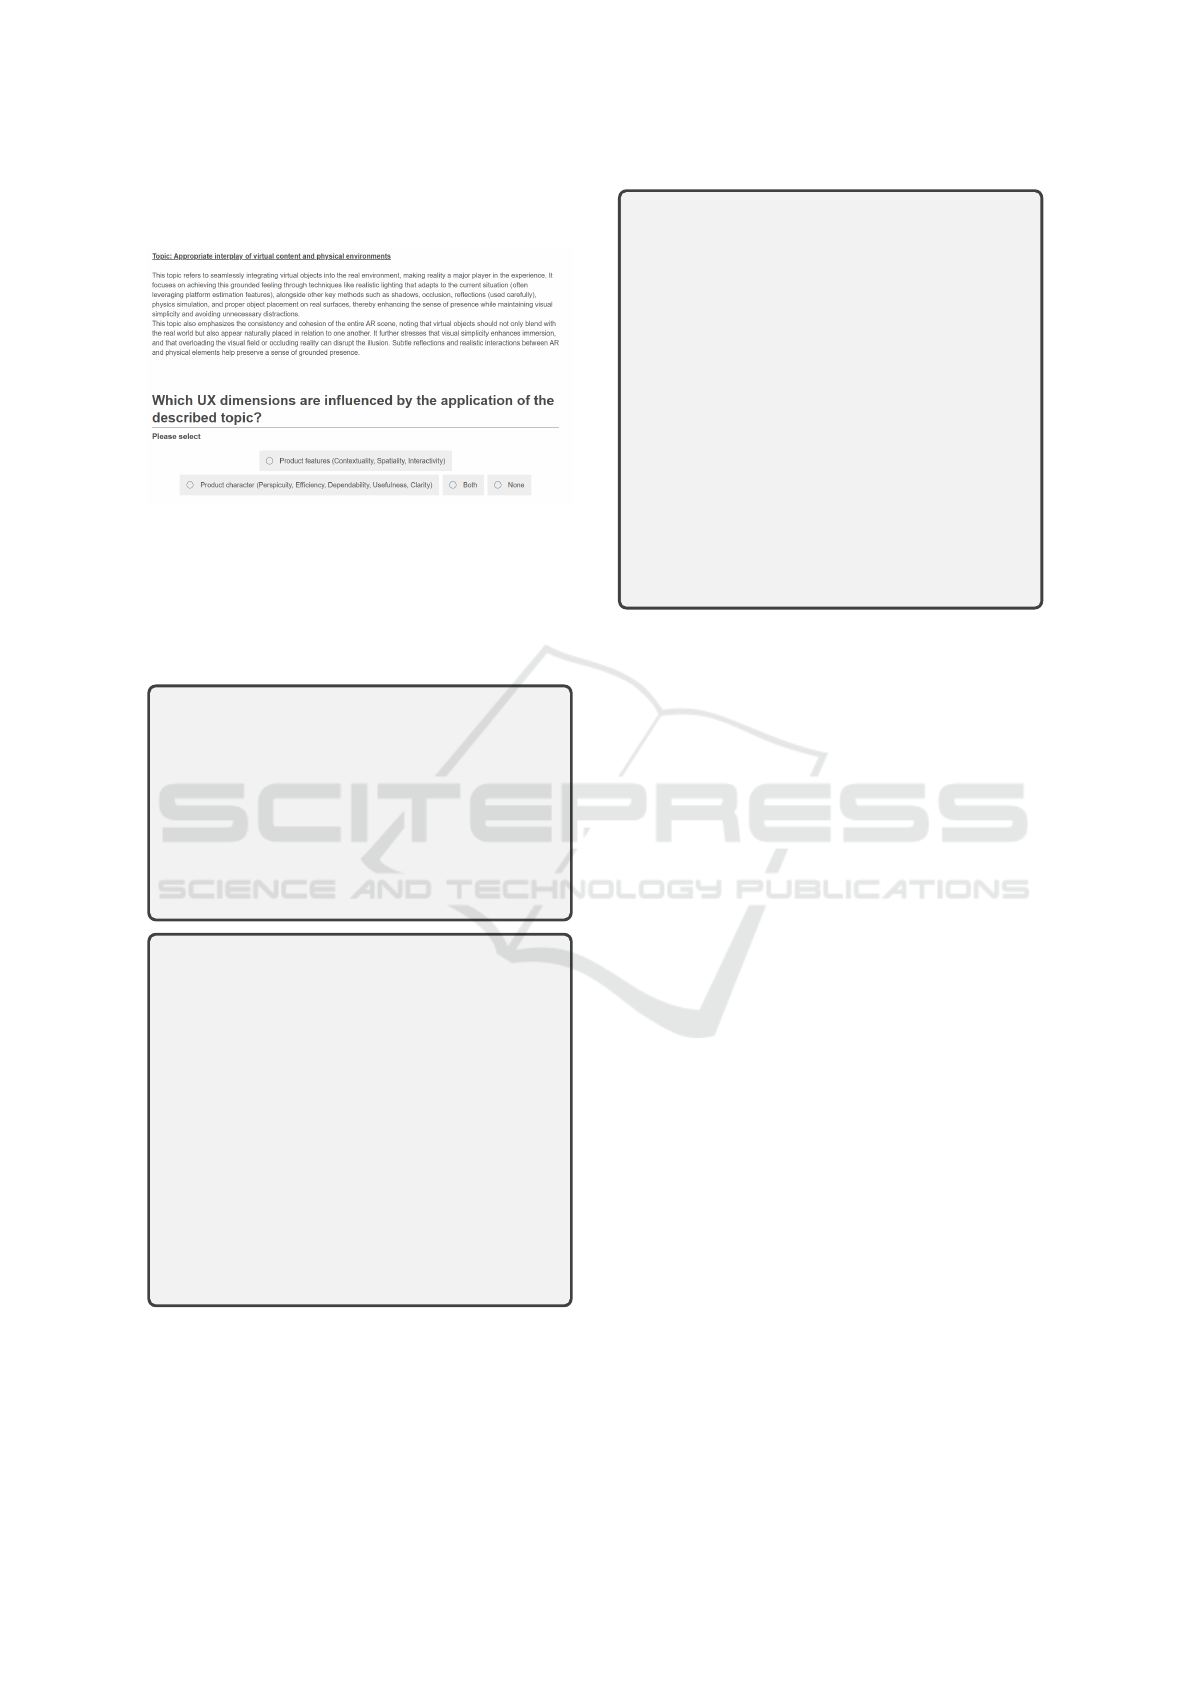
APPENDIX
Exemplary excerpt from the survey. AR design
recommendation topics were presented to the partici-
pants, followed by the classification question. At the
end of each questionnaire page, the UX dimensions
and their descriptions were listed, allowing partici-
pants to refer back to them as needed.
Product features (ARcis):
(1) Appropriate interplay of virtual content
and physical environments
(5) Hand & finger gestures
(6) Textures – Visual Realism and Appear-
ance of Objects
(17) Error prevention & recovery
(18) Consider and show User’s required Effort
Product character (UX Quality Aspects):
(9) Handling Interruptions / Relocalization
(12) Visual cues for object manipulation
(13) Object Placement
(19) Law of practice
(21) Text / Font
(22) Accessibility (visuals)
(23) Ergonomics (avoid muscle fatigue)
(24) Ergonomics (avoid head & neck fatigue)
(25) Pause / Breaks
(26) Performance
(28) Feedback
(29) FOV
(30) Content Placement
Product features and character (Both):
(2) Attention directors
(3) Instructions
(4) Onboarding
(7) Occlusion
(8) Image detection
(10) Surface Detection
(11) Affordance
(14) Object Manipulation
(15) Encourage to explore
(16) Keep the focus on AR experience, but
use 2D-UI On-Screen elements when needed
(20) Inform about Waiting Time
(27) Audio Feedback
(31) Headlocked content
(32) Anchored UI
WEBIST 2025 - 21st International Conference on Web Information Systems and Technologies
520
