
Decision Rule-Based Learning of Terrorist Threats
Nida Meddouri
1 a
, Lo
¨
ıc Salmon
2 b
, David Beserra
1 c
and Elloh Adja
1
1
Laboratoire de Recherche de l’EPITA, Le Kremlin-Bic
ˆ
etre, France
2
Institut des Sciences Exactes et Appliqu
´
ees, University of New-Caledonia, France
fi
Keywords:
Data Mining, Machine Learning, Decision Rule, Criminality, Terrorist Threats.
Abstract:
Artificial Intelligence (AI) offers powerful tools for analyzing criminal data and predicting security threats.
This paper focuses on the interpretable prediction of terrorist threats in France using official crime datasets
from 2012 to 2021. We propose a preprocessing methodology to aggregate and label spatio-temporal crime
data at the departmental level, addressing challenges such as data imbalance and structural heterogeneity. To
ensure explainability, we adopt symbolic learning approaches based on decision rule generators implemented
in WEKA, including MODLEM, NNge, and MOEFC. We evaluate these models through nine experiments
simulating real-world prediction scenarios, using metrics such as misclassification rate, Recall, Kappa statistic,
AUC-ROC, and AUPR. Results show that rule-based models achieve stable performance across periods, with
Recall averaging 96% and AUPR close to 0.93, despite severe class imbalance. Among the tested methods,
NNge and MOEFC provide the best trade-off between interpretability and predictive accuracy. These findings
highlight the potential of interpretable rule-based models for supporting counter-terrorism strategies.
1 INTRODUCTION
Over the past two decades, criminal activity in France
has evolved, leading to a significant rise in acts of
malice, particularly in connection with social and
labor movements, riots, and terrorism (Mucchielli,
2008). In this complex landscape, integrating arti-
ficial intelligence techniques presents promising op-
portunities to enhance public and private security sys-
tems. Studies conducted in various countries, includ-
ing Brazil (Da Silva et al., 2020), the Middle East
(Tolan et al., 2015), and others (Saidi and Trabelsi,
2022), have already demonstrated the effectiveness of
spatio-temporal crime data analysis in this domain.
Building on this foundation, this work aims to adapt
and apply these approaches to the French context, fo-
cusing on developing an interpretable and explainable
terrorism threat prediction model, leveraging a recent
research (Meddouri and Beserra, 2024).
This work does not aim to introduce a new algo-
rithm but rather to address a critical gap in the litera-
ture: the lack of interpretable and explainable mod-
els for predicting terrorist threats using real-world,
highly imbalanced crime data. Our contribution lies
a
https://orcid.org/0000-0002-7815-630X
b
https://orcid.org/0000-0002-7267-6371
c
https://orcid.org/0000-0002-7450-8531
in (i) designing a reproducible preprocessing pipeline
for spatio-temporal aggregation of official French
crime datasets, (ii) systematically benchmarking a di-
verse set of state-of-the-art decision rule learners un-
der severe class imbalance, and (iii) providing an
interpretability-driven evaluation framework based on
rule complexity and similarity analysis. To preserve
interpretability, we deliberately avoided oversampling
or synthetic data generation and instead relied on
evaluation metrics robust to imbalance, such as Re-
call, AUPR, and Kappa statistic. These aspects are
essential for operational decision-making in security
contexts, where black-box models are often unsuit-
able.
In section 2, we present the record of criminality
in France. In section 3, we present the analysis and
preprocessing of criminality data and the challenge to
discover. In section 4, we propose the interpretable
learning of terrorist attacks in France. Finally, in sec-
tion 5, we present an experimental study based on in-
terpretable and explainable machine learning methods
(rules generators) from the labeled criminality data.
448
Meddouri, N., Salmon, L., Beserra, D. and Adja, E.
Decision Rule-Based Learning of Terrorist Threats.
DOI: 10.5220/0013774400004000
Paper published under CC license (CC BY-NC-ND 4.0)
In Proceedings of the 17th International Joint Conference on Knowledge Discovery, Knowledge Engineering and Knowledge Management (IC3K 2025) - Volume 1: KDIR, pages 448-456
Proceedings Copyright © 2025 by SCITEPRESS – Science and Technology Publications, Lda.

2 CRIME DATA IN FRANCE
(2012-2021)
Since October 9, 2015, crime-related data in France
has been available online under an Open Licence
1
.
Covering the period from 2012 to 2021, these datasets
encompass Metropolitan France, the Overseas De-
partments and Regions, and the Overseas Collec-
tivities. They provide crime and offense statistics
recorded by the national police and gendarmerie. Of-
fenses are grouped into seven major categories: of-
fenses against individuals, offenses against property,
drug-related offenses, offenses against public author-
ity, offenses related to public health and the envi-
ronment, offenses under labor and competition law,
and administrative and documentary offenses. This
database is a valuable resource for spatio-temporal
crime analysis, facilitating the modeling and interpre-
tation of crime trends, particularly the emergence of
specific offenses such as terrorist attacks.
The use and interpretation of these data require
consideration of several key factors. First, the statis-
tics account only for crimes and offenses, excluding
minor infractions. These acts are recorded at the time
they are first reported to security forces and brought
to the attention of judicial authorities. Additionally,
traffic offenses are not included in these counts.
Offenses are recorded by the administrative au-
thority that observes and documents them. However,
an offense is not necessarily reported or recorded in
the same location where it was committed. This dis-
crepancy particularly affects the Public Security Dis-
tricts, the Departmental Gendarmerie Units, the Bor-
der Police, and judicial police services such as the
Central Directorate of the Judicial Police, the Re-
gional Directorates of the Judicial Police, and the Na-
tional Directorate of the Judicial Police. This also
applies to the Republican Security Companies, which
operate across multiple departments or regions, as
well as to central offices with national jurisdiction.
Consequently, it is essential to distinguish between
the number of offenses recorded by a given service
and the actual number of crimes and offenses com-
mitted in the territory where that service is based.
Recorded offenses correspond to incidents docu-
mented within a given year. However, some offenses
may have been committed in the previous year or,
more rarely, even earlier but are accounted for in the
year they were recorded. Conversely, offenses occur-
ring late in the year may appear in the records of the
following year.
1
https://www.data.gouv.fr/fr/datasets/crimes-et-delits-
enregistres-par-les-services-de-gendarmerie-et-de-police-
depuis-2012/information
Depending on the type of offense, these data may
not fully reflect the level of insecurity perceived by
citizens. For offenses without direct physical or
moral victims—such as drug-related violations, la-
bor law infractions, immigration offenses, environ-
mental crimes, or prostitution-related offenses—the
recorded figures primarily indicate law enforcement
activity rather than the actual prevalence of such
crimes. These numbers reflect the intensity of efforts
to detect and prosecute offenses rather than a direct
measure of criminal trends.
The unit of measurement varies by offense type,
with each category assessed using the most relevant
metric. However, this inconsistency in measurement
methods makes direct aggregation of figures across
different categories inappropriate.
Additionally, crime recording systems have un-
dergone significant changes in recent years. Con-
sequently, some variations in statistical trends result
from modifications in data collection practices rather
than actual shifts in criminal activity.
Lastly, the organization of gendarmerie and po-
lice services evolves over time, with jurisdictions be-
ing created, abolished, or restructured. These changes
can complicate the interpretation of crime figures for
a given service. Modifications to service jurisdictions
are officially published in the Journal Officiel.
This database serves as a crucial resource for un-
derstanding and analyzing the evolution of crime in
France over time. We believe that these data can be
leveraged for spatio-temporal analyses to both ”pre-
dict” and ”interpret” the occurrence of terrorist at-
tacks in France.
3 ANALYSIS AND
PREPROCESSING OF
CRIMINAL DATA
Before using these data for learning purposes, pre-
processing is necessary to merge the statistics pro-
vided by the National Police and the National Gen-
darmerie on a year-by-year basis. The police services
are organized into directorates (either national or spe-
cific to the Paris metropolitan area), each with its own
territorial structure. In contrast, the organization of
gendarmerie units is centralized, with the territory di-
vided into gendarmerie companies.
The statistics are derived from 372 Departmen-
tal Gendarmerie Companies and 828 Public Security
Districts, aggregated at the departmental level. This
choice is based on two main reasons. First, secu-
rity perimeters in France have been modified since
Decision Rule-Based Learning of Terrorist Threats
449
2011, with additions, mergers, and divisions, among
other changes. Second, security policy in France
is defined at the central level, then implemented at
the departmental level before being applied to the
1,200 local and regional security perimeters. Al-
though the division of French territory into 101 de-
partments has remained unchanged since 2011, these
statistics also cover overseas territories, such as Saint-
Martin, French Polynesia, and New Caledonia, for the
period 2012-2021. However, data for Wallis and Fu-
tuna is only available until 2016. For simplicity, in
the remainder of this paper, these territories will be
referred to as departments. Thus, statistics will be ag-
gregated over 105 departments for the period 2012-
2016 and 104 departments for the period 2017-2021.
Finally, these data will be categorized based on the
occurrence of a terrorist attack, a foiled attack, or the
absence of such events in a department. An exception
is noted in one department, where a terrorist attack
occurred, followed by the foiling of another attack in
2016.
During the period 2012-2021, on average, 3.44%
of french departments and territorial collectivities
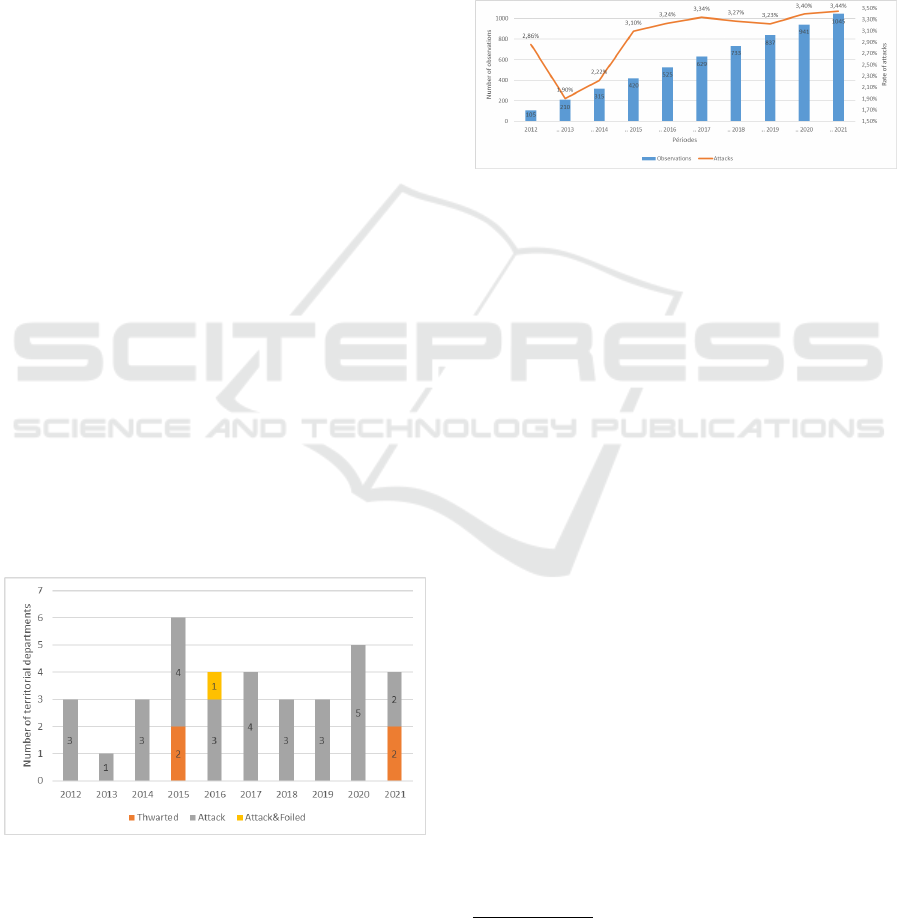
were affected by terrorist attacks. According to Fig-
ure 1, six departments were affected by these events
in 2015, five departments in 2020, and four depart-
ments in 2016, 2017, and 2021. Three departments
were impacted in other years, except for 2013, when
only one department was concerned. Foiled attacks
were recorded in only two departments in 2015, 2016,
and 2021. Figure 1 also shows, for each year from
2012 to 2021, the number of departments that were
affected by terrorist attacks (in gray), those that expe-
rienced foiled attacks (in orange), and those that both
suffered an attack and successfully foiled others (in
yellow).
Figure 1: Evolution of events related to terrorist attacks in
France (2012-2021).
In conclusion, although the average proportion
of French departments affected by terrorism between
2012 and 2021 remained relatively low, certain years
such as 2015 and 2020 saw a higher concentration of
attacks. This distribution indicates a persistent but ge-
ographically limited terrorist threat. Furthermore, the
low number of recorded foiled attacks suggests either
their rarity or a possible under-reporting or centraliza-
tion of counter-terrorism efforts.
For the purpose of this study, we grouped the
statistics into periods
2
, all starting from 2012. Fig-
ure 2 presents the number of observations per period
as well as the percentage of events related to terrorist
attacks.
Figure 2: Evolution of terrorist attacks by periods starting
from 2012.
Each period will be used as a training data. Our
learning models will aim to predict terrorist-related
events with the highest possible performance. It is im-
portant to note that these data are highly imbalanced.
For example, between 2012 and 2013, 210 observa-
tions were recorded, of which 4 were related to ter-
rorist attacks, accounting for 1.9%.
4 INTERPRETABLE LEARNING
OF TERRORIST ATTACKS IN
FRANCE
The objective of this work is to understand the evo-
lution of terrorist behavior based on labeled data (by
year and period). Initially, we propose to learn from
the data corresponding to each year to deduce a dis-
tinct behavior for each year. Using a supervised learn-
ing method, we generate 10 distinct models, each cor-
responding to a year from 2012 to 2021. To ensure ex-
plainability and interpretability of the results, we will
adopt a symbolic learning approach, based on tech-
niques such as decision trees (Quinlan, 1993), deci-
sion rule generators (Ghosh et al., 2022), or Formal
Concept Analysis (Meddouri and Maddouri, 2020).
We propose to use well-known decision rules gen-
erators from the literature, implemented in WEKA
3
.
Among the classifiers handling numerical and multi-
2
Period 1: 2012. Period 2: 2012-2013. Period 3: 2012-
2014 ... Period 10: 2012-2021
3
https://ml.cms.waikato.ac.nz/weka
KDIR 2025 - 17th International Conference on Knowledge Discovery and Information Retrieval
450

Table 1: Number of Decision Rules Computed Annually by Generators.
Year 2012 2013 2014 2015 2016 2017 2018 2019 2020 2021 Avg.(±Std.Dev.)
ConjunctiveRule 1 1 1 1 1 1 1 1 1 1 1 (±0)
DecisionTable 1 1 1 5 1 2 1 1 4 1 1,8 (±1.12)
DTNB 1 1 1 9 1 1 1 1 1 4 2,1 (±1.76)
FURIA 2 1 2 4 3 2 2 2 2 4 2,4 (±0.76)
JRIP 1 1 1 3 2 2 1 1 2 1 1,5 (±0.6)
MODLEM 8 3 7 6 6 2 6 7 8 6 5,9 (±1.36)
MOEFC 4 4 4 5 4 5 4 4 4 4 4,2 (±0.32)
NNge 6 3 6 5 5 2 5 4 6 6 4,8 (±1.08)
OLM 1 1 1 1 1 1 1 1 1 1 1 (±0)
OneR 1 1 1 2 2 2 2 2 2 2 1,7 (±0.42)
PART 4 1 1 4 2 2 2 2 3 4 2,5 (±1)
Ridor 1 1 1 3 1 2 1 1 1 1 1,3 (±0.48)
RoughSet 7 3 6 7 6 2 4 4 9 8 5,6 (±1.88)
ZeroR 1 1 1 1 1 1 1 1 1 1 1 (±0)
class data, we mention ConjunctiveRule (Kalmegh,
2018), DecisionTable (Kohavi, 1995), DTNB (Hall
and Frank, 2008), FURIA (H
¨
uhn and H
¨
ullermeier,
2009), JRIP (Cohen, 1995), Multi-Objective Evolu-
tionary Algorithms for Fuzzy Classification
4
(Jimenez
et al., 2014), NNge (Martin, 1995), OLM (Ben David,
1992), OneR (Holte, 1993), PART (Frank and Witten,
1998), Ridor (Gaines and Compton, 1995), RoughSet
(Wojna et al., 2023), and ZeroR (Sangeorzan, 2020).
The choice of these generators is motivated by their
interpretability and their relevance in the state-of-the-
art of symbolic learning.
The selection of decision rule generators was
based on two main criteria: interpretability and repre-
sentation of state-of-the-art symbolic learning meth-
ods. Rule-based models are inherently interpretable
because they express knowledge as human-readable
IF–THEN rules, which is essential in security-
sensitive domains such as counter-terrorism. To en-
sure diversity and relevance, we considered a set of
generators implemented in WEKA, a widely recog-
nized platform for benchmarking machine learning
models. This selection includes classical symbolic
learners such as OneR, PART, and JRIP, which serve
as standard baselines for rule induction; advanced
fuzzy and evolutionary approaches like FURIA and
MOEFC, designed to handle uncertainty and multi-
objective optimization; instance-based and hybrid
methods such as NNge and DTNB, which combine
rule induction with probabilistic reasoning; and rough
set or formal concept-based methods like RoughSet
and MODLEM, which are well-established in inter-
pretable knowledge discovery. Together, these meth-
ods cover different paradigms deterministic, proba-
bilistic, fuzzy, and evolutionary, while maintaining
the interpretability requirement. Moreover, their ex-
4
In the rest of this article, the classifier Multi-Objective
Evolutionary Algorithms for Fuzzy Classification will be
abbreviated as MOEFC.
tensive citation in recent literature on interpretable
machine learning and decision support systems con-
firms their relevance as state-of-the-art techniques.
We acknowledge that standard baselines such as
decision trees, logistic regression, and random forests
are commonly used in predictive modeling. However,
these methods were deliberately excluded from this
study because our primary objective is to ensure in-
terpretability and explainability, which are critical in
security-sensitive contexts. While tree-based and en-
semble methods often achieve higher predictive ac-
curacy, they typically may lack the transparency re-
quired for operational decision-making. Future work
will include these baselines to provide a broader com-
parison in terms of predictive performance versus in-
terpretability.
In Table 1, we present the number of decision
rules calculated by the previously mentioned gener-
ators for each year in the period 2012-2021. Regard-
less of the analyzed year, ConjunctiveRule, OLM, and
ZeroR produce only a single decision rule to describe
the annual behavior. DecisionTable, DTNB, FURIA,
JRIP, OneR, PART, and Ridor generate very few de-
cision rules (less than 3 on average). In contrast,
MOEFC, NNge, RoughSet, and MODLEM generate
an average of 4.2 (±0.32), 4.8 (±1.08), 5.6 (±1.88),
and 5.9 (±1.36) decision rules per year, respectively.
In Table 2, we present the number of decision
rules generated by the previously mentioned gener-
ators for different periods. Unlike the previous obser-
vations, the MODLEM and NNge generators produce
a significantly higher number of decision rules, with
an average of 26.4 (±10) and 48.3 (±31.41) rules,
respectively. Similarly, DTNB generates an average
of around a hundred decision rules (128.8 (±111.6)),
while RoughSet generates several hundred decision
rules, with an average of 3376.8 (±3940.07). The
number of decision rules generated by these gener-
ators adapts to the size of the training data.
Decision Rule-Based Learning of Terrorist Threats
451

Table 2: Number of Decision Rules generated per Period.
Year 2012 ..13 ..14 ..15 ..16 ..17 ..18 ..19 ..20 ..21 Avg.(±Std.Dev.)
ConjunctiveRule 1 1 1 1 1 1 1 1 1 1 1 (±0)
DecisionTable 1 1 1 2 9 1 1 3 32 6 5,7 (±5.43)
DTNB 1 1 1 22 23 111 155 254 309 411 128,8 (±111.6)
FURIA 2 4 5 4 8 13 10 9 11 14 8 (±3.09)
JRIP 1 2 2 3 1 2 2 1 3 2 1,9 (±0.49)
MODLEM 8 11 15 18 25 29 34 39 42 43 26,4 (±10)
MOEFC 4 4 4 4 4 4 7 7 5 8 5,1 (±1.21)
Nnge 6 7 13 23 28 40 55 70 104 137 48,3 (±31.41)
OLM 1 1 1 1 1 1 1 1 1 1 1 (±0)
OneR 1 1 1 2 2 2 2 2 2 3 1,8 (±0.43)
PART 4 3 8 5 6 9 8 16 15 12 8,6 (±3.2)
Ridor 1 1 1 1 2 1 2 1 2 7 1,9 (±0.98)
RoughSet 7 8 75 189 363 823 1619 2260 17855 10569 3376,8 (±3940.07)
ZeroR 1 1 1 1 1 1 1 1 1 1 1 (±0)
As shown in Tables 1 and 2, decision rule genera-
tors described in the literature produce models of dif-
fering sizes, measured by the number of decision rules
generated. The generators ConjunctiveRule, OLM,
and ZeroR generate only a single rule at a time, with
an average deviation equal to 0. In contrast, the other
rule generators exhibit highly variable average devia-
tions.
In conclusion, the use of decision rule generators
allows us to interpret and explain the generated learn-
ing models. For example, in the appendix of this
paper, we present the learning models produced by
MODLEM. For each year or period, a distinct learn-
ing model is obtained in the form of decision rules
set, ensuring the model’s explainability. In the case
of MODLEM, it describes criminal behavior in 2012
through 8 decision rules, whereas for the following
year, it requires only 3 decision rules (see Table 2).
The analysis of these models will help to better under-
stand and interpret the evolution of crime and threats,
such as unrest, riots, terrorist attacks, and other phe-
nomena. This analysis will consist of comparing the
generated sets of rules in pairs to measure their sim-
ilarity. If two sets of rules are highly similar, this
may indicate that criminal behavior has changed lit-
tle. Else, if the sets of decision rules are slightly or
not at all similar, this will suggest a significant evo-
lution in criminal behavior, specifying the differences
between the rules.
5 EXPERIMENTAL STUDY
The purpose of this section is to study the per-
formance of decision rule generators for predicting
events related to terrorist attacks, using the previously
generated learning models. To evaluate these per-
formances, we rely on standard classification crite-
ria, such as Error Rates, Recall/Sensitivity, ROC-Area
(AUC-ROC
5
), PRC Area (AUPR
6
), and Kappa Statis-
tic.
These indicators will allow us to analyze the effec-
tiveness of each decision rule generator to correctly
predict the departments and periods associated with
terrorist attacks, as well as their ability to avoid false
positives and false negatives. Each generator will be
evaluated based on its performance across different
periods in order to test the robustness of the mod-
els against data imbalances. The performances will
be compared among the generators to identify those
that offer the best trade-offs between model complex-
ity (number of decision rules) and prediction accu-
racy. Although the dataset is highly imbalanced, with
terrorist-related events representing less than 4% of
the observations, we deliberately avoided applying
oversampling or synthetic data generation techniques
such as SMOTE to preserve the interpretability and
fidelity of the models. Instead, we addressed class
imbalance at the evaluation stage by adopting metrics
that are robust to skewed distributions, including Re-
call, AUPR, and Kappa statistic. This methodologi-
cal choice ensures that the models remain explainable
while still providing meaningful performance indica-
tors for rare but critical events. The learning data is
detailed in Table 3 by period.
The data used for testing generalization is de-
scribed by 104 attributes. The number of observations
includes 105 for the data from the years 2012 to 2016,
and 104 from 2017 to 2021.
The experimental protocol consists of 9 experi-
ments, the details of each one are presented in table 4.
Each experiment is designed to test the ability of the
generated learning models to predict events in the fol-
lowing year, using training data from successive peri-
ods.
5
Area Under Curve - Receiver Operating Characteristic
6
Area Under Precision-Recall
KDIR 2025 - 17th International Conference on Knowledge Discovery and Information Retrieval
452
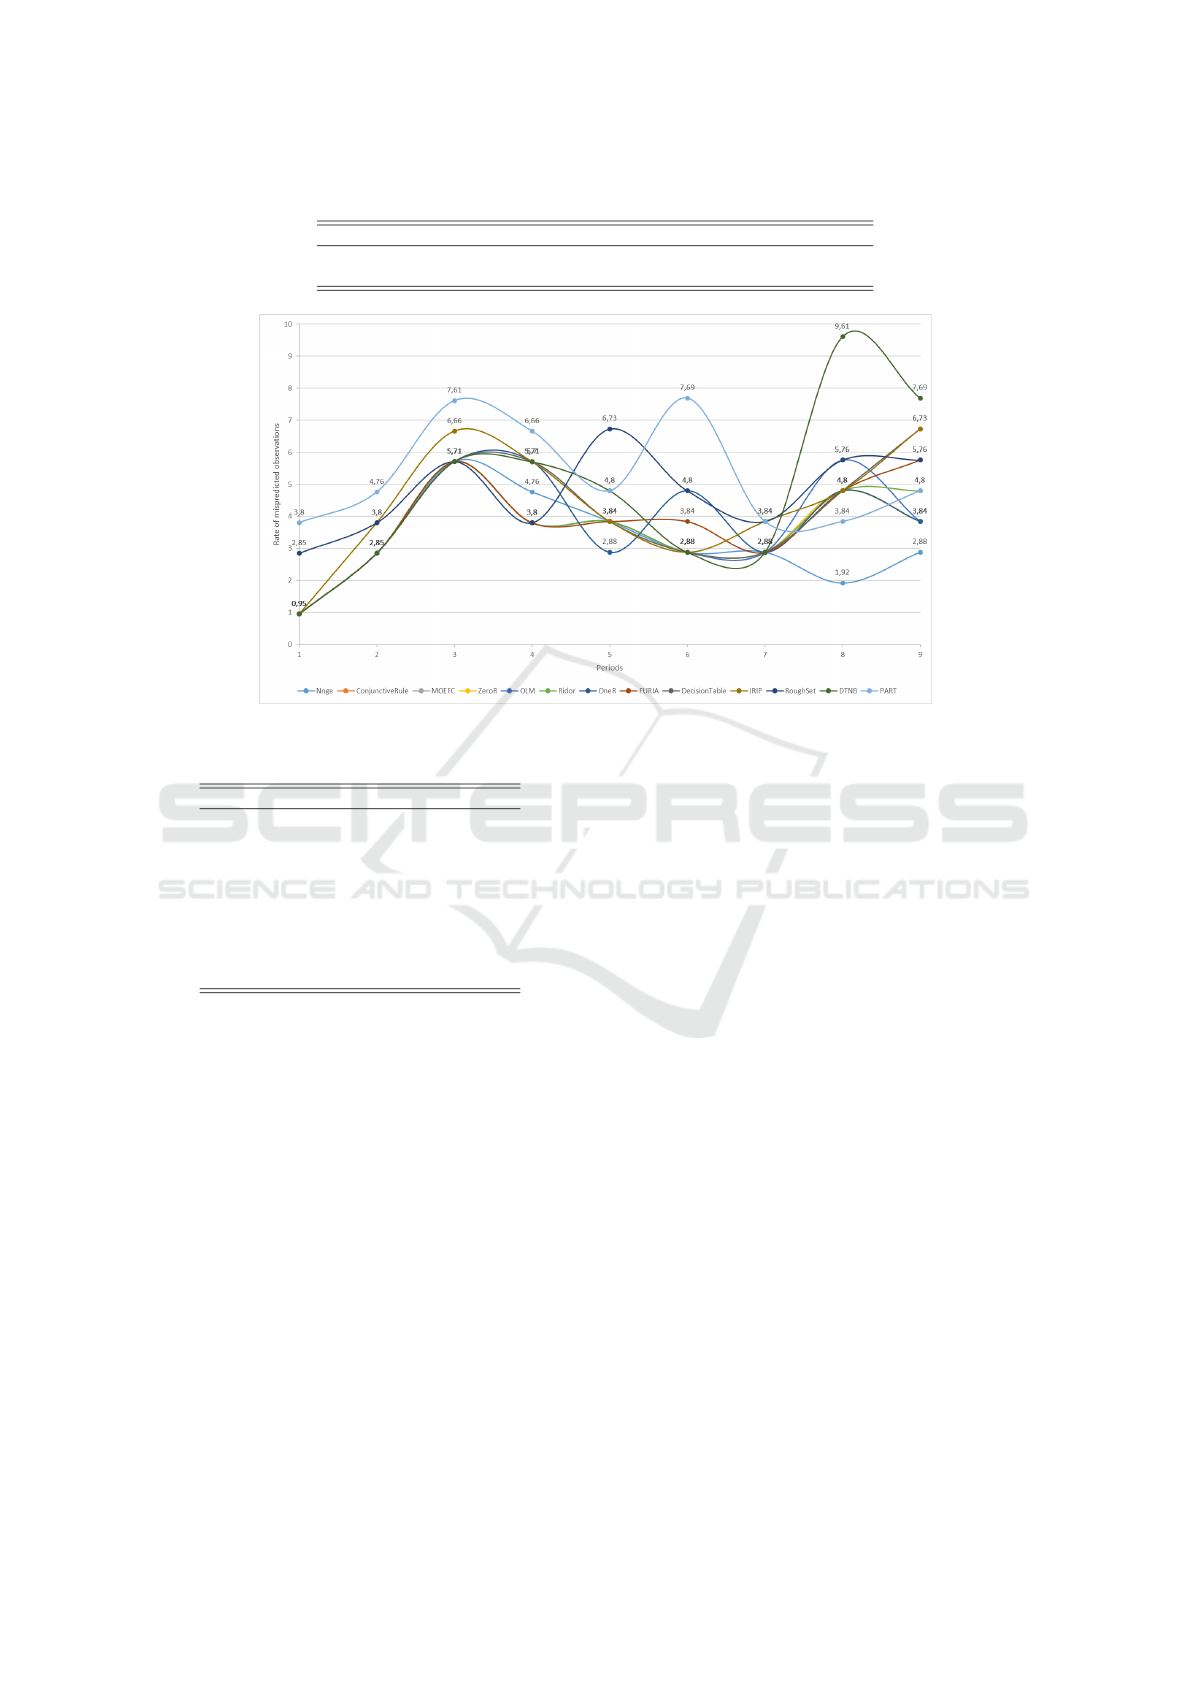
Table 3: Characteristics of the Learning Data.
Year 2012 ..2013 ..2014 ..2015 ..2016 ..2017 ..2018 ..2019 ..2020 ..2021
Characteristics 104 104 104 104 104 104 104 104 104 104
Observations 105 210 315 420 525 629 733 837 941 1045
Figure 3: Evolution of mispredicted observations rates.
Table 4: Learning and generalization sets of data.
Experimentation Learning Data Generalization Data
1 2012 2013
2 2012 .. 2013 2014
3 2012 .. 2014 2015
4 2012 .. 2015 2016
5 2012 .. 2016 2017
6 2012 .. 2017 2018
7 2012 .. 2018 2019
8 2012 .. 2019 2020
9 2012 .. 2020 2021
More specifically, in each experiment, the training
data covers a period from 2012 to a given year, and the
generated learning models are then evaluated on gen-
eralization data corresponding to the following year.
This approach allows testing the generalization of the
learning models to events that occur after the training
period, in order to assess their robustness and their
ability to predict future trends in safety and crime.
5.1 Analysis of Mispredicted
Observation Rates
According to Figure 3, the rates of incorrectly pre-
dicted observations by the decision rule generators
remain relatively stable throughout the 9 experimen-
tal periods. This confirms that these generators,
as supervised learning methods, offer stable predic-
tion/classification performance. Among the decision
rule generators, NNge minimizes the misclassifica-
tion rate, with an average of 3.19% (±1.06). It is
closely followed by ConjunctiveRule, MOEFC, and
ZeroR, which display similar performance, with an
average of 3.51% (±0.99). The highest rates are ob-
served for PART and DTNB, with 5.31% (±1.34) and
4.79% (±2.13), respectively. In summary, the aver-
age performance of the decision rule generators tested
varies between 3.19% and 5.31%, highlighting a gen-
eral stability in their prediction capabilities.
5.2 Recall/Sensitivity Rates Analysis
The Recall, or Sensitivity (Recall/Sensitivity) mea-
sure evaluates a learning model’s ability to identify
all actual positive observations. It indicates the pro-
portion of true positives correctly classified as such.
According to Figure 4, recall rates range between
0.9% and 0.99%, with an average of 0.96% and a
very low average deviation (±0.01). This shows that
the decision rule generators are able to identify most
of the actual positive observations. This capability is
even more important in the context of our application,
where the cost of false negatives is high, both eco-
nomically and sociologically.
5.3 Kappa Statistic Analysis
The Kappa Statistic measures the difference between
the observed agreement and the agreement expected
Decision Rule-Based Learning of Terrorist Threats
453
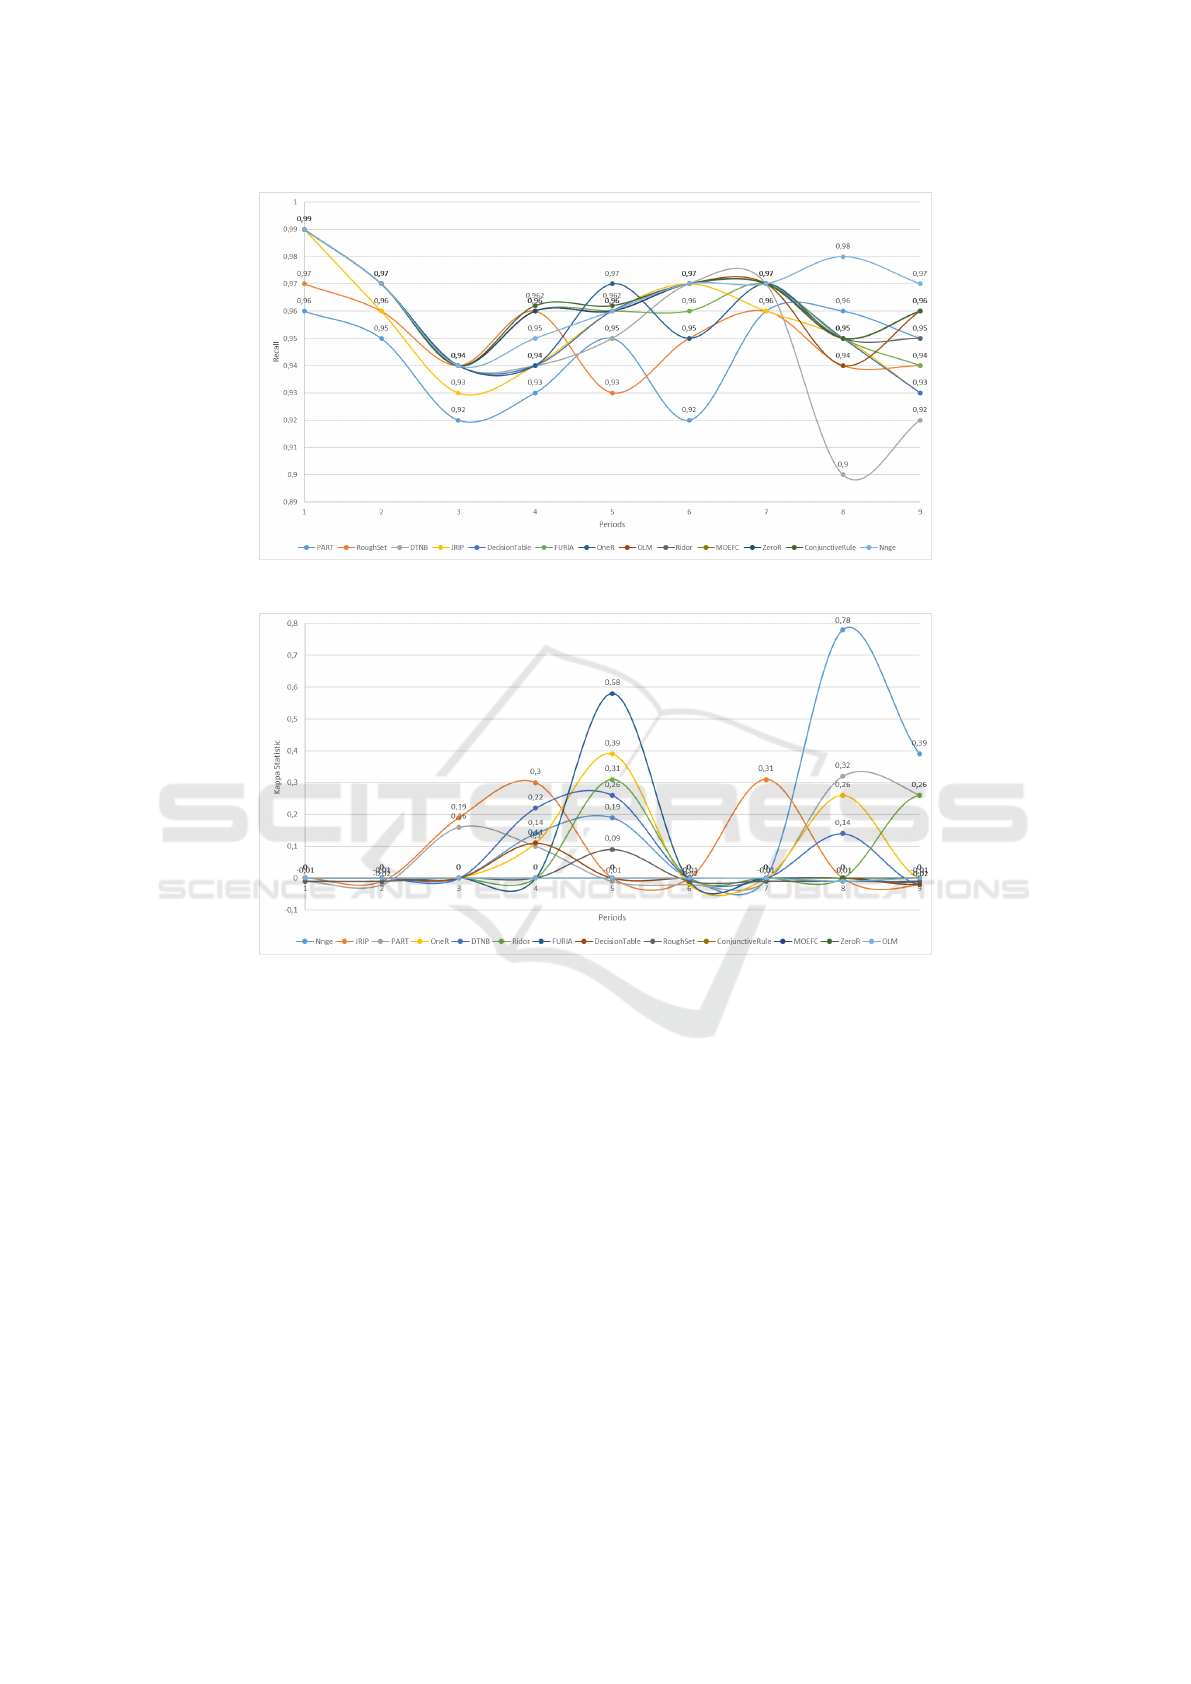
Figure 4: Evolution of Recall/Sensitivity Rates.
Figure 5: Kappa Statistic evolution.
by pure chance. When Kappa Statistic is close to 1,
it indicates that the model performs much better than
random chance. If Kappa Statistic is close to 0, it
means that the model performs no better than a ran-
dom prediction. A negative Kappa Statistic suggests
that the model performs worse than random chance.
According to Figure 5, most decision rule generators
have a Kappa value around 0.05 (±0.07), except for
NNge, which reaches an average of 0.17 (±0.19).
5.4 ROC Area (AUC-ROC) Analysis
The ROC curve (Receiver Operating Characteristic)
describes the evolution of Sensitivity (or true posi-
tive rate) as a function of 1 minus Specificity (anti-
specificity) as the decision threshold changes. The
term ROC comes from the intercommunication be-
tween systems, where these curves are used to ana-
lyze a model’s ability to separate the signal from the
background noise. The area under the ROC curve,
or AUC (Area Under the Curve), measures the area
under the ROC curve, which plots the true positive
rate against the false positive rate for different classi-
fication thresholds. It allows us to evaluate a model’s
ability to distinguish between positive and negative
classes. The AUC is also useful for comparing model
performances at different thresholds: a value of 1
indicates perfect classification, while a value of 0.5
suggests random performance. According to Fig-
ure 6, the decision rule generators ConjunctiveRule,
MOEFC, ZeroR, and OLM show a constant evolu-
tion throughout the experimental periods, with a sta-
ble rate of 0.5 and zero average deviation. In con-
trast, the generators DTNB, DecisionTable, and FU-
RIA achieve results above 0.5, with respective aver-
ages of 0.64 (±0.15), 0.62 (±0.14), and 0.61 (±0.13).
In summary, most of the rule generators experimented
with produce learning models whose performance is
KDIR 2025 - 17th International Conference on Knowledge Discovery and Information Retrieval
454
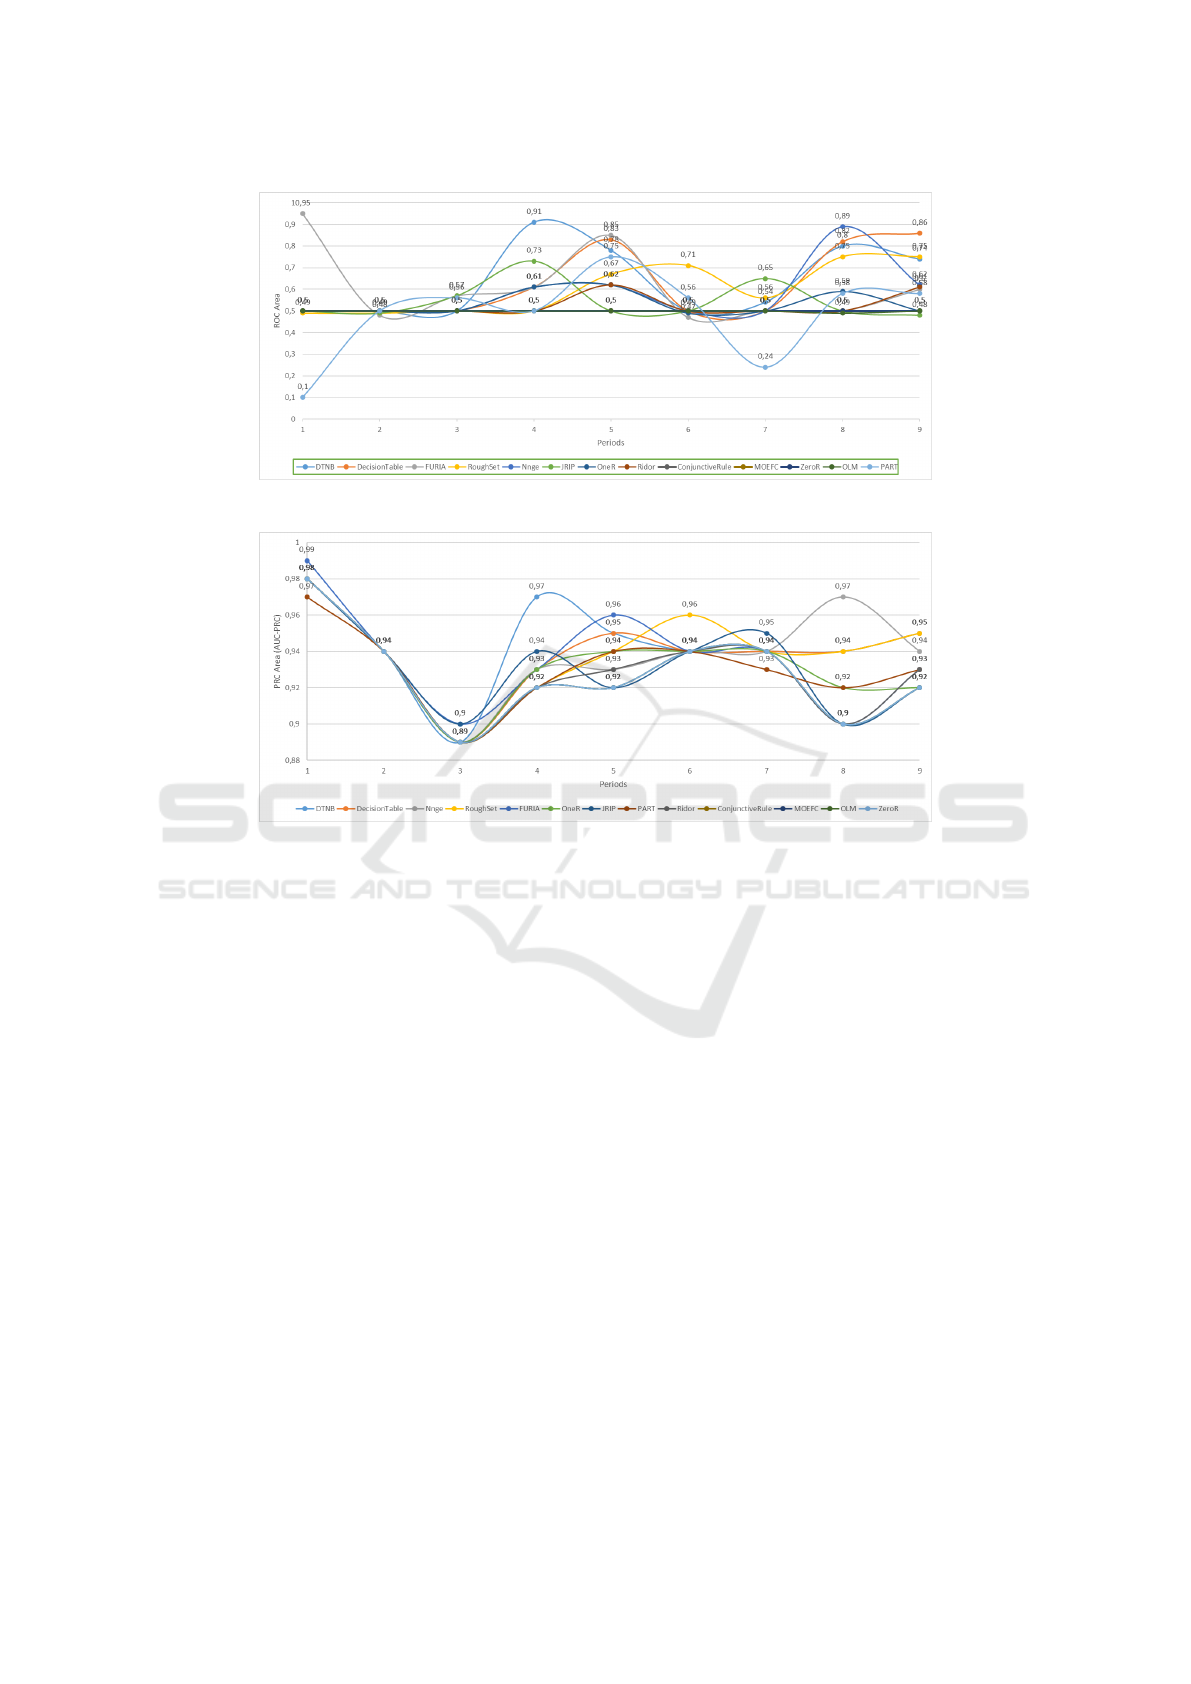
Figure 6: ROC Area (AUC-ROC) evolution.
Figure 7: PRC Area (AUPR) evolution.
close to random classification, with an average of
0.55 (±0.07), except for DTNB, DecisionTable, and
FURIA. Although ROC-AUC values are close to 0.5,
this is expected under severe class imbalance and does
not fully reflect the models’ ability to identify rare
positive events. Therefore, we emphasize Recall and
AUPR as more relevant metrics for this context.
5.5 PRC Area (AUPR) Analysis
The Precision-Recall Curve (PRC) often comple-
ments the ROC curve. It describes the evolution
of precision as a function of Recall as the deci-
sion threshold changes. To summarize this curve,
we use the area under it, called AUPR (Area Un-
der the Precision-Recall Curve). The AUPR is espe-
cially useful when there is an imbalance between the
classes, as is the case in our study. A higher score in-
dicates better performance in identifying the positive
class. According to Figure 7, the decision rule gen-
erators are near 1, with an average of 0.93 (±0.02).
This suggests that all rule generators perform well in
terms of Precision and Recall. The generators DTNB,
NNge, RoughSet, and FURIA achieve an average of
0.94 (±0.02), placing them among the best models in
terms of precision-recall.
6 CONCLUSION AND
PERSPECTIVES
This study evaluated the performance of decision
rule generators in predicting terrorist-related events
in France using data from 2012 to 2021. While
most generators showed stable performance, some
stood out in terms of precision and efficiency. No-
tably, NNge, MOEFC, and RoughSet achieved high
precision-recall and AUPR scores (approaching 1),
indicating strong capabilities despite class imbalance.
In contrast, DTNB and DecisionTable yielded lower
AUC and Kappa scores, reflecting weaker discrimi-
nation in imbalanced contexts. Low Kappa and RAE
values for certain models suggest limited but accept-
able agreement between predictions and actual out-
comes.
Although ROC-AUC and Kappa values remain
modest, limiting real-world predictive utility, this is
largely due to extreme class imbalance and the choice
to preserve interpretability by avoiding oversampling
Decision Rule-Based Learning of Terrorist Threats
455

and black-box models. Nevertheless, the models
achieve high Recall (≈ 96%) and AUPR (≈ 0.93),
crucial for minimizing false negatives in security-
sensitive applications. These findings highlight the
value of interpretable decision-support tools, even
with limited discriminative power.
To further investigate model interpretability, we
propose analyzing rule set similarities between
MOEFC and NNge, which generate an average of
4.2(±0.32) and 4.8(±1.08) rules respectively, balanc-
ing simplicity and performance. Conversely, methods
like OLM and Ridor, with fewer rules, offer lower
complexity. Interestingly, generators such as Con-
junctiveRule, OLM, and ZeroR maintain good perfor-
mance despite minimal spatial and temporal complex-
ity. Exploring sequential or parallel rule generation
could enhance robustness while managing complex-
ity, offering a promising trade-off between explain-
ability and performance.
Finally, while decision rule models are inherently
interpretable, understanding the generated rules is es-
sential to link predictions with underlying societal and
political factors. Enhancing model interpretability
can strengthen trust and support informed decision-
making in real-world scenarios.
REFERENCES
Ben David, A. (1992). Automated generation of symbolic
multiattribute ordinal knowledge-based dsss: Method-
ology and applications. Decision Sciences, 23:1357–
1372.
Cohen, W. W. (1995). Fast effective rule induction. In
Twelfth International Conference on Machine Learn-
ing, pages 115–123. Morgan Kaufmann.
Da Silva, A. R. C., de Paula J
´
unior, I. C., da Silva, T. L. C.,
de Mac
ˆ
edo, J. A. F., and Silva, W. C. P. (2020). Predic-
tion of crime location in a brazilian city using regres-
sion techniques. In Proceeding of IEEE 32nd Interna-
tional Conference on Tools with Artificial Intelligence
(ICTAI’20), pages 331–336.
Frank, E. and Witten, I. H. (1998). Generating accurate
rule sets without global optimization. In Shavlik, J.,
editor, Fifteenth International Conference on Machine
Learning, pages 144–151. Morgan Kaufmann.
Gaines, B. and Compton, P. (1995). Induction of ripple-
down rules applied to modeling large databases. Jour-
nal of Intelligent Information Systems, 5:211–228.
Ghosh, B., Malioutov, D., and Meel, K. S. (2022). Efficient
learning of interpretable classification rules. Journal
of Artificial Intelligence Research, 74:1823–1863.
Hall, M. and Frank, E. (2008). Combining naive bayes and
decision tables. In Proceedings of the 21st Florida
Artificial Intelligence Society Conference (FLAIRS),
pages 318–319. AAAI press.
Holte, R. (1993). Very simple classification rules per-
form well on most commonly used datasets. Machine
Learning, 11:63–91.
H
¨
uhn, J. and H
¨
ullermeier, E. (2009). Furia: An algorithm
for unordered fuzzy rule induction. Data Min. Knowl.
Discov., 19:293–319.
Jimenez, F., S
´
anchez, G., and Juarez, J. (2014). Multi-
objective evolutionary algorithms for fuzzy classifica-
tion in survival prediction. Artificial Intelligence in
Medicine, 60.
Kalmegh, S. R. (2018). Comparative analysis of the weka
classifiers rules conjunctiverule and decisiontable on
indian news dataset by using different test modes. In-
ternational Journal of Advanced Research in Com-
puter Science, 7(2):01–09.
Kohavi, R. (1995). The power of decision tables. In 8th Eu-
ropean Conference on Machine Learning, pages 174–
189. Springer.
Martin, B. (1995). Instance-based learning: Nearest neigh-
bor with generalization. Master’s thesis, University of
Waikato, Hamilton, New Zealand.
Meddouri, N. and Beserra, D. (2024). Apprentissage inter-
pretable de la criminalite en france (2012-2021). In
Proceeding of the EGC workshop Gestion et Analyse
de donnees Spatiales et Temporelles with the 24
ieme
Journees Francophones en Extraction et Gestion des
Connaissances (GAST/EGC 24), pages 41–43.
Meddouri, N. and Maddouri, M. (2020). Efficient closure
operators for fca-based classification. International
Journal of Artificial Intelligence and Machine Learn-
ing, 10:79–98.
Mucchielli, L. (2008). Une societe plus violente ? Une anal-
yse socio-historique des violences interpersonnelles
en France, des annees 1970 a nos jours. Deviance et
Societe, 32(2):115–147.
Quinlan, J. R. (1993). C4.5: programs for machine learn-
ing. Morgan Kaufmann Publishers Inc., San Fran-
cisco, CA, USA.
Saidi, F. and Trabelsi, Z. (2022). A hybrid deep learning-
based framework for future terrorist activities mod-
eling and prediction. Egyptian Informatics Journal,
23(3):437–446.
Sangeorzan, L. (2020). Effectiveness analysis of zeror and
j48 classifiers using weka toolkit. Bulletin of the Tran-
silvania University of Brasov. Series III: Mathematics
and Computer Science, pages 481–486.
Tolan, G., Abou-El-Enien, T., and Khorshid, M. (2015).
Hybrid classification algorithms for terrorism predic-
tion in middle east and north africa. International
Journal of Emerging Trends & Technology in Com-
puter Science (IJETTCS), 4:23–29.
Wojna, A., Latkowski, R., and Kowalski, L. (2023). Rses-
lib: User Guide. Accessed: 2025-01-04.
KDIR 2025 - 17th International Conference on Knowledge Discovery and Information Retrieval
456
