
A Robust Comparative Study of Adaptative Reprojection Fusion
Methods for Deep Learning Based Detection Tasks
with RGB-Thermal Images
Enrique Heredia-Aguado
a
, Marcos Alfaro-P
´
erez
b
, Mar
´
ıa Flores
c
, Luis Paya
d
,
David Valiente
e
and Arturo Gil
f
University Institute for Engineering Research, Miguel Hern
´
andez University, Avda. de la Universidad s/n,
03202 Elche (Alicante), Spain
Keywords:
Image Fusion, Multispectral Image, Object Detection, RGB-Thermal, Deep Learning.
Abstract:
Fusing visible and thermal imagery is a promising approach for robust object detection in challenging envi-
ronments, taking advantage of the strengths from different spectral information. Building on previous work
in static early fusion, we present a comparative study of adaptative reprojection fusion methods that exploit
advanced projections and frequency-domain transforms to combine RGB and thermal data. We evaluate Prin-
cipal Component Analysis, Factor Analysis, Wavelet and Curvelet-based fusion, all integrated into a YOLOv8
detection pipeline. Experiments are conducted on the LLVIP dataset, with a focus on methodological rigour
and reproducibility. This research show promising results based on these methods comparing to previous early
fusion methods. We discuss the implications for future research and the value of robust experimental design
for advancing the state of the art in multispectral fusion.
1 INTRODUCTION
Multimodal data fusion has consistently demonstrated
its value across various knowledge domains. By com-
bining different sources of information, it is possi-
ble to compensate for the limitations of individual
modalities and take advantage their complementary
strengths.
The primary application scenario for this research
is object detection in search and rescue (SAR) oper-
ations, surveillance, and security domains, contexts
where robust perception under uncontrollable condi-
tions is critical. The proposed solution is designed
for deployment onboard autonomous robotic plat-
forms, requiring real-time processing capabilities un-
der hardware constraints. While high-frequency in-
ference is not mandatory, achieving reliable perfor-
mance at rates around 1 Hz is sufficient to support
effective operations.
Visible (RGB) images provide rich texture and
colour information, but their performance signifi-
a
https://orcid.org/0009-0001-7717-1428
b
https://orcid.org/0009-0008-8213-557X
c
https://orcid.org/0000-0003-1117-0868
d
https://orcid.org/0000-0002-3045-4316
e
https://orcid.org/0000-0002-2245-0542
f
https://orcid.org/0000-0001-7811-8955
cantly degrades under poor illumination. In some
scenarios this limitation can be addressed with arti-
ficial lighting; however, in the scenarios considered
here, such approach is not feasible. To ensure robust
performance under highly varying illumination con-
ditions, data fusion emerges as a promising strategy
to enhance perception. Thermal infrared images, less
sensitive to illumination changes, provide comple-
mentary information about temperature and emissiv-
ity. Specifically, the long-wave infrared spectrum of-
fers temperature measurements between 0 and 100°C,
depending on camera settings, which is particularly
suitable for pedestrian detection. However, thermal
images are sensitive to environmental changes, such
as ambient temperature and seasonal variations. As
described in (Heredia-Aguado et al., 2025), there are
corner cases—such as occlusions present in only one
modality—that further justify the integration of both
data sources.
As indicated before, visible spectrum image in-
clude rich information about textures, colour and im-
age structure, while thermal image adds light invari-
ance. Effective fusion should exploit these comple-
mentary characteristics to improve object detection in
low-light or visually degraded environments. Beyond
the domains already mentioned, multispectral fusion
has potential applications in other fields as well.
Heredia-Aguado, E., Alfaro-Pérez, M., Flores, M., Paya, L., Valiente, D. and Gil, A.
A Robust Comparative Study of Adaptative Reprojection Fusion Methods for Deep Learning Based Detection Tasks with RGB-Thermal Images.
DOI: 10.5220/0013761800003982
Paper published under CC license (CC BY-NC-ND 4.0)
In Proceedings of the 22nd International Conference on Informatics in Control, Automation and Robotics (ICINCO 2025) - Volume 1, pages 313-320
ISBN: 978-989-758-770-2; ISSN: 2184-2809
Proceedings Copyright © 2025 by SCITEPRESS – Science and Technology Publications, Lda.
313
Several fusion strategies exist in the literature.
This research builds upon static early fusion tech-
niques (Heredia-Aguado et al., 2025) to establish a
robust baseline for comparing the benefits of various
approaches. Specifically, the fusion methods explored
in this work reduce a four-channel image (RGB+T) to
a three-channel representation, enabling the use of es-
tablished image detectors such as YOLOv8. This pa-
per extends the study of static early fusion techniques
by:
• Proposing and rigorously evaluating dynamic
fusion methods based on projections (PCA,
FA) and frequency-domain transforms (Wavelets,
Curvelets).
• Ensuring robust experimental control: using the
same dataset, network architecture, initialization,
and training parameters across all methods.
The following Section (2) details the methodology
employed, including the detection algorithm, dataset,
experimental setup, and evaluation metrics. Section 3
explains each fusion method. Section 4 presents and
discusses the detection results for each approach. Fi-
nally, Section 5 summarizes the main findings, limi-
tations, and potential future directions.
2 METHODOLOGY
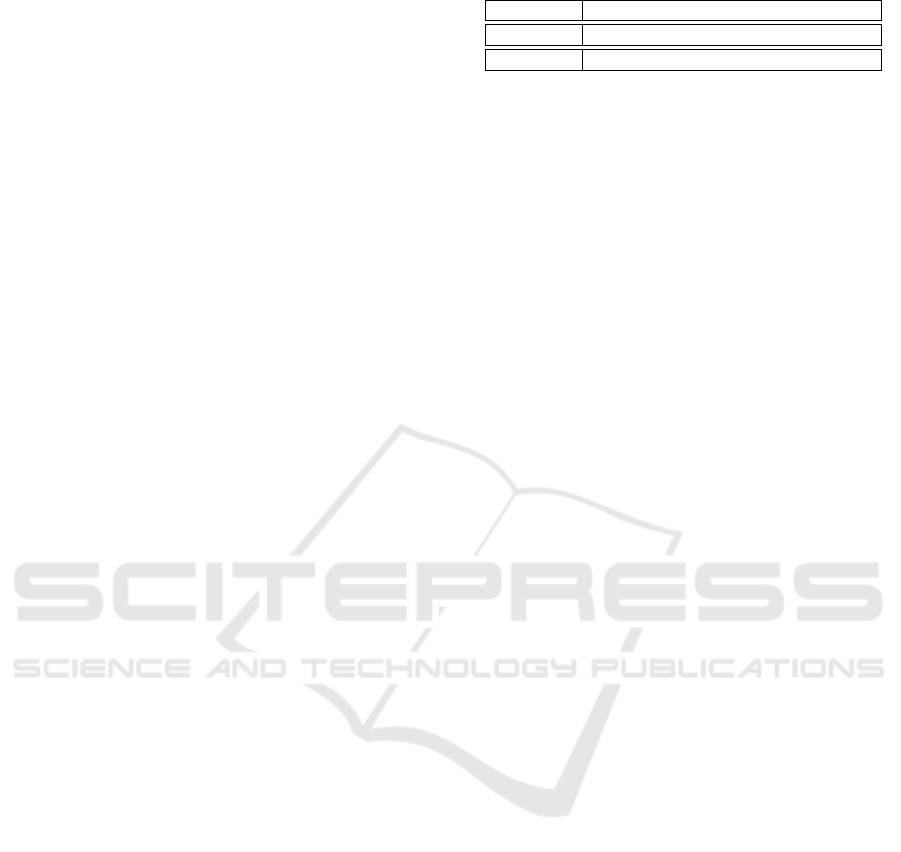
The fusion algorithms that are tested in this research
combine both thermal and visible spectrum images
before they are fed to train and validate a deep learn-
ing model to perform the detection for each specific
fusion approach, as shown in Figure 1. This sec-
tion includes a detailed description of each block de-
picted in Figure 1 along with an explanation of the
relevant experimental setup and the evaluation met-
rics that will be involved in the later analysis and dis-
cussion.
For the sake of reproducibility, the source code is
openly available (https://github.com/enheragu/
yolo_test_utils/tree/v2.1.0-icinco, accessed
on 01 July 2025), allowing for complete replication of
the experiments.
2.1 Detection Algorithm
All the fusion algorithms included in this research
have been tested under the same detection network.
The idea of the network is to work as a common de-
scriptor of how each method performs. For this pur-
pose YOLOv8 (Jocher et al., 2023) have been se-
lected. YOLO is a state-of-the-art single-stage ob-
ject detection architecture that unifies both localiza-
Table 1: LLVIP test and train subset characteristics.
Set Name Images Backgrounds Instances
Test 3463 0 8302
Train 12,025 2 34,135
tion and classification within a single neural network.
Although it efficiently extracts multi-scale features
in three different sizes, it is a known issue that the
detection may suffer with smaller objects that dis-
appear through the convolution layers (Jiang et al.,
2022) (Diwan et al., 2023).
Although there are other detectors that could po-
tentially overcome these issues, the use case domain
in which this research is focused need a fast and low-
cost consuming solution. In terms of speed YOLOv8
has proven to be faster than the other state-of-the-art
family of solutions based on RCNN Networks such as
Faster-RCNN (Ren et al., 2017). Although there are
detection models based on transformers (Carion et al.,
2020) these models are still quite big in terms of train-
able parameters and memory consumption. YOLOv8
offers a reliable solution with a fast processing time
and low memory and trainable parameters, implying a
shorter training time and the need for smaller datasets.
2.2 The LLVIP Dataset
For this research the LLVIP dataset (Jia et al., 2021)
has been chosen. It includes up to 16 k colour-
thermal image pairs with pedestrians manually la-
belled, captured at night under low illumination con-
ditions. Images provided (1280 x 1024) have been
captured with a static pair of cameras in 26 differ-
ent locations. The dataset is already provided with
a 80-20 split for train/test subsets. As summarised
in Table 1 the images have been labelled and filtered
so that all pedestrians are identified removing almost
all only-background images. This dataset seems to
be one of the most reliable datasets in terms of mul-
tiespectral images. Although bigger datasets such as
the KAIST (Hwang et al., 2015) dataset exist, they
have not the quality in terms of image pair align-
ment (Heredia-Aguado et al., 2025) and labelling as
LLVIP. Note that the fusion methods proposed are de-
pendant on the alignment of both visible and thermal
images and that problems in calibration or synchro-
nization between images can greatly impact the per-
formance of the methods.
Examples of both test and training subsets are
shown in Figure 2. As can be observed, all the images
have been taken from a high-angle perspective, which
means that most people appear relatively close to the
camera, maintaining a consistent size and avoiding
smaller instances that, as already stated, would neg-
ICINCO 2025 - 22nd International Conference on Informatics in Control, Automation and Robotics
314
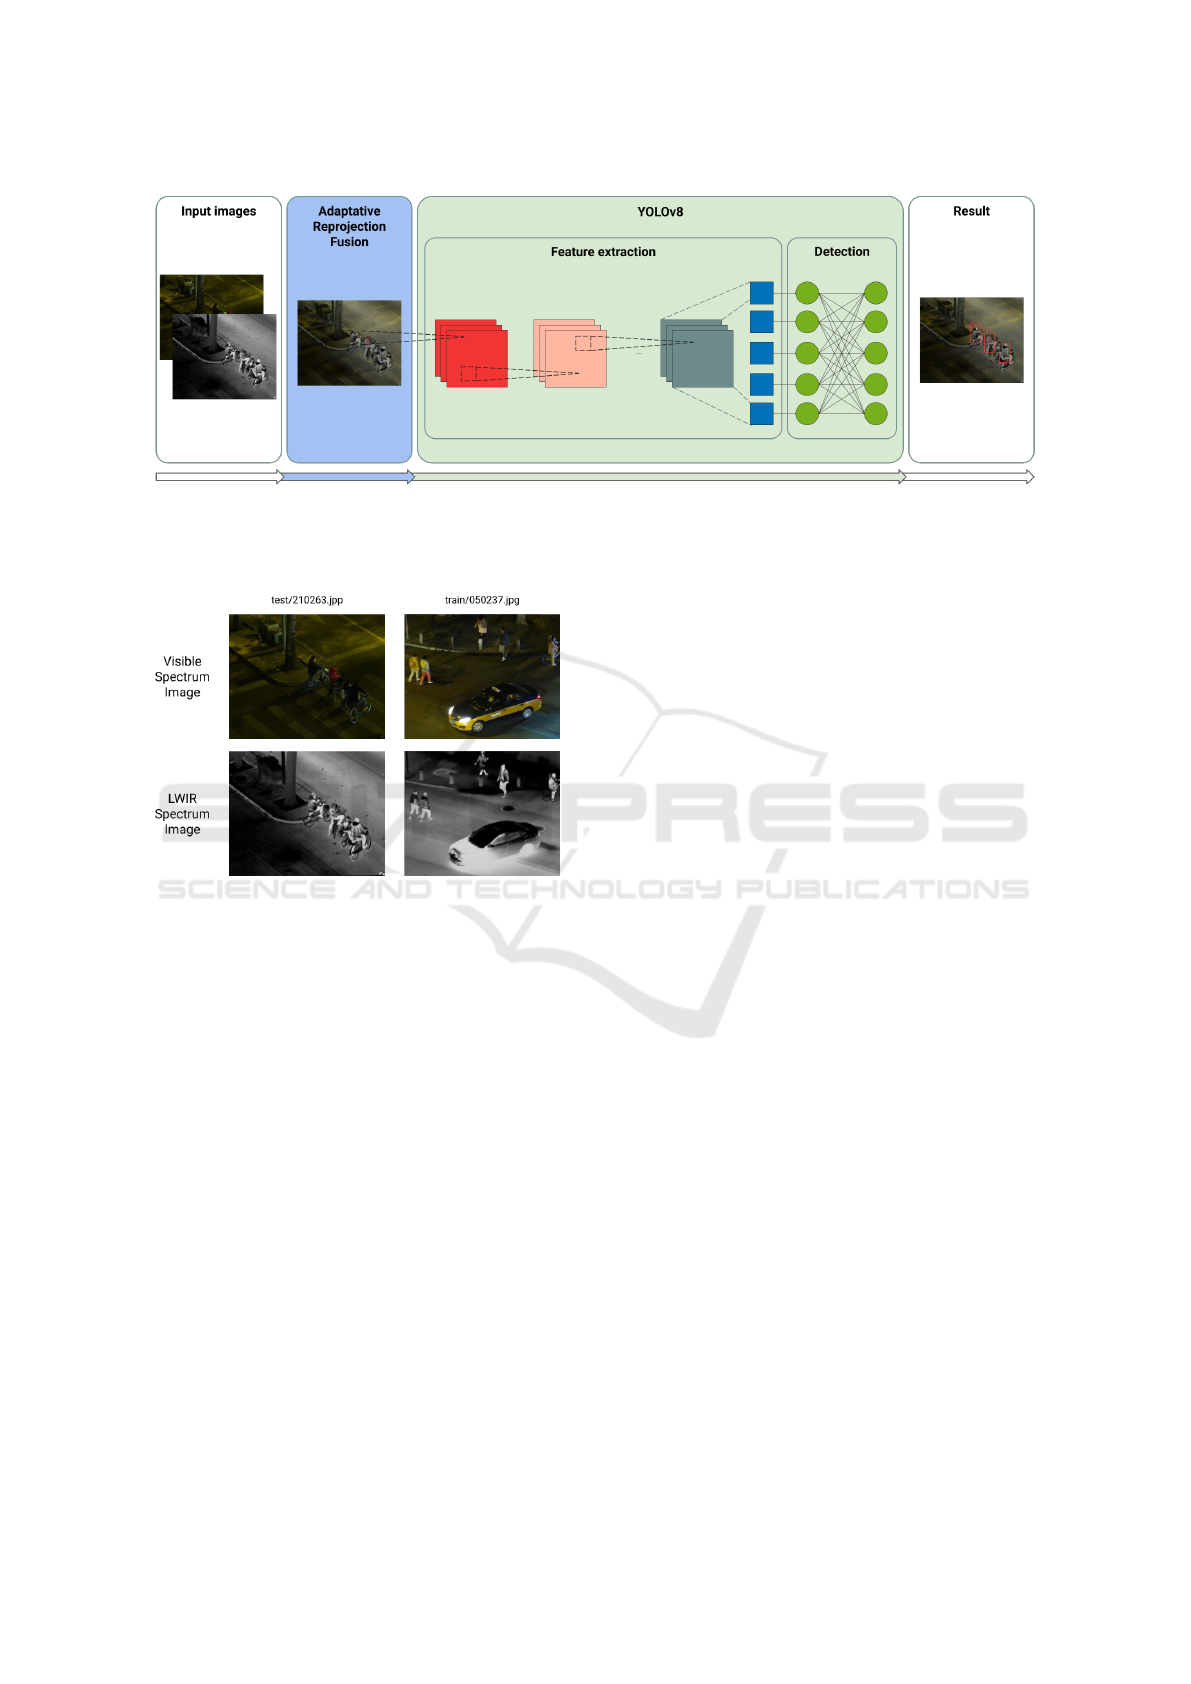
Figure 1: Architectural design for the fusion algorithm evaluation.
atively affect the detection algorithm.
Figure 2: LLVIP examples from test and train subsets.
2.3 Experimental Setup
As already stated, the idea of this research is to estab-
lish a comparison framework between different fusion
methods. As some of them (middle fusion, late fu-
sion) imply changes in the deep-model architecture,
no transfer learning is to be used. All the models
are trained from scratch, making use of the result-
ing fused images, and based on the same initialization
weights and identical hyperparameters, including data
augmentation strategies, and initialization schemes.
This guarantees a robust and fair comparison across
the different fusion algorithms
All the training and validation tests were per-
formed using the same hardware: an NVIDIA GPU,
model GeForce RTX 4090 with 24 GB. The adapta-
tive fusion of each image is done in a 11th Gen In-
tel(R) Core(TM) i7-11700 (2.50GHz) processor.
2.4 Evaluation Metrics and
Implementation Details
To have a clearer understanding of the performance
and focusing on the use case already presented, the
performance of each method will be compared based
on the precision and recall metrics. Precision provides
a measure of the ability of the trained model to avoid
false positives while recall informs about the capacity
of the model to detect all instances without leaving
undetected ones.
The analysis also includes the standard metric
mean Average Precision (mAP) at standard IoU (In-
tersection over Union) thresholds. Fusion time is also
reported for each method, as computational efficiency
is critical for real-time applications.
3 IMAGE FUSION
The fusion methods that are presented cover differ-
ent alternatives of reprojecting the four channel infor-
mation into a three channel output. The first couple
of methods are based on reprojecting the data into a
different frame based on data variation. The follow-
ing methods include fusion in the frequency domain
before data are reprojected back to the three-channel
format.
This section covers PCA and FA as methods of
dimensionality reduction applied to image fusion;
and Wavelet and Curvelet transform for image fu-
sion. Other alternatives tested such as t-SNE (Van der
Maaten and Hinton, 2008) or UMAP (McInnes et al.,
2020) may take up to 40 minutes of computation time
for each image, which is completely out of the scope
of the current research use case domain.
As already introduced, these resulting images are
then fed to the deep detection network, YOLOv8, to
A Robust Comparative Study of Adaptative Reprojection Fusion Methods for Deep Learning Based Detection Tasks with RGB-Thermal
Images
315

train and validate the resulting model.
3.1 Projection-Based Fusion
3.1.1 Principal Component Analysis (PCA)
Principal Component Analysis involves a mathemat-
ical tool that transforms a given number of corre-
lated variables into a number of uncorrelated vari-
ables. With this approach, and starting with four-
channel data, through PCA the maximum variance di-
rections are computed. Taking the most relevant com-
ponents (three components in this case), the image is
backprojected to the image space. This method has
been proposed with different variants and applications
in the field of image processing (Kumar and Muttan,
2006) (Elmasry et al., 2020).
For this research the generic approach is followed,
for each image the data are reprojected based on the
three most relevant components and then fed to the
deep-learning algorithm.
3.1.2 Factor Analysis (FA)
Following a similar approach to the PCA tool, Factor
Analysis is another tool for dimensionality reduction
based on data variance (Joliffe and Morgan, 1992).
With this tool a set of factors are computed (similar
to components in PCA), so that the input variables
are assumed to be linear combinations of these factors
plus, for each variable, an error term. The key advan-
tage of the method is that it allows the separation of
the common variance in the data from the variance at-
tributable to error. This way, the reprojection is made
only through the factors computed based on common
variance. Although it is not a method commonly used
in image processing, we think it brings some interest-
ing approach to the problem as noise or even outliers
are not an unknown thing in image processing.
3.2 Frequency-Domain Fusion
3.2.1 Wavelet Transform Fusion
The Discrete Wavelet Transform (DWT) (Sifuzza-
man et al., 2009) is a derived technique based on the
Fourier Transform. The Fourier transform analyses a
given signal based on its frequency components, but
in doing so, it loses spatial information about the data.
Two-dimension DWT ensures maintaining spatial in-
formation (critical when analysing an image) while
focusing on the frequency analysis (Zhang, 2019).
With this approach a given image can be decomposed
into frequency components.
For each channel of the four-channel input im-
age, the DWT provides a set of frequency compo-
nents. These components are splitted into two sub-
bands: approximation coefficients (cA) and detail co-
efficients sub-bands. These coefficients are the ones
mixed between images: RGB approximation coef-
ficient is mixed with thermal approximation coeffi-
cient; the same applies to the detail coefficients. Once
fused, an inverse transform is applied to reconstruct a
three-channel image.
The detail sub-bands, the high frequency com-
ponent of the image, capture mainly local changes,
textures and edges information, while approxima-
tion sub-bads, the low frequency components, contain
most of the general structure and spectral image infor-
mation. There are different approaches on how these
components should be combined:
• Maximum value: Between two given components
the maximum value is maintained disregarding
the other one. This approach ensures maintaining
texture and edge information, but it can include
higher noise in the resulting image.
• Average value: Although averaging both compo-
nents can diminish local changes and edges, it
maintains a smoother and cleaner image.
Both versions have been implemented into two
Wavelet fusions: averaged and max-value. For the
first version the components of each RGB channel are
averaged with the ones from the thermal image, for
both approximation and detail sub-bands. The second
approach combines each RGB channel detail compo-
nents with the thermal components keeping the maxi-
mum value. In this case the approximation coefficient
is combined following an α Blending Fusion (Ofir,
2023): C
Aprox
= α · C
A−RGB
+(1 − α) · C
A−T H
be-
ing alpha a relative coefficient based on thermal pixel
value. The max-value method tends to preserve more
information than the average method in image fusion,
as it selects the highest intensity pixel from the input
images, ensuring that no significant details from any
source are lost, whereas averaging can dilute or blur
important features (Patil et al., 2013) (Sahu and Sahu,
2014). Other techniques that show interesting results
are based on max-contrast (Indira, 2015) but have not
been tested as would potentially increase time con-
sumption.
3.2.2 Curvelet Transform Fusion
The problem with the Wavelet transformation is that
it focuses on point singularities, ignoring some of the
geometric properties of the structures in the image.
In addition, it does not take advantage of edge reg-
ularity (Ma and Plonka, 2010). The Curvelet trans-
ICINCO 2025 - 22nd International Conference on Informatics in Control, Automation and Robotics
316
form defines a different transform from the DWT, as
it performs a multi-scale and multi-directional analy-
sis that is particularly effective when representing and
compressing edge and curve structures. Not surpris-
ingly, it is widely popular for image processing solu-
tions (Starck et al., 2002).
As in the DWT fusion approach, two versions
of the algorithm have been implemented. In both,
the first layer coefficients are merged averaging both
RGB and Thermal coefficients. In the last levels
(up to four levels in total) are either averaged or
maximum-filtered.
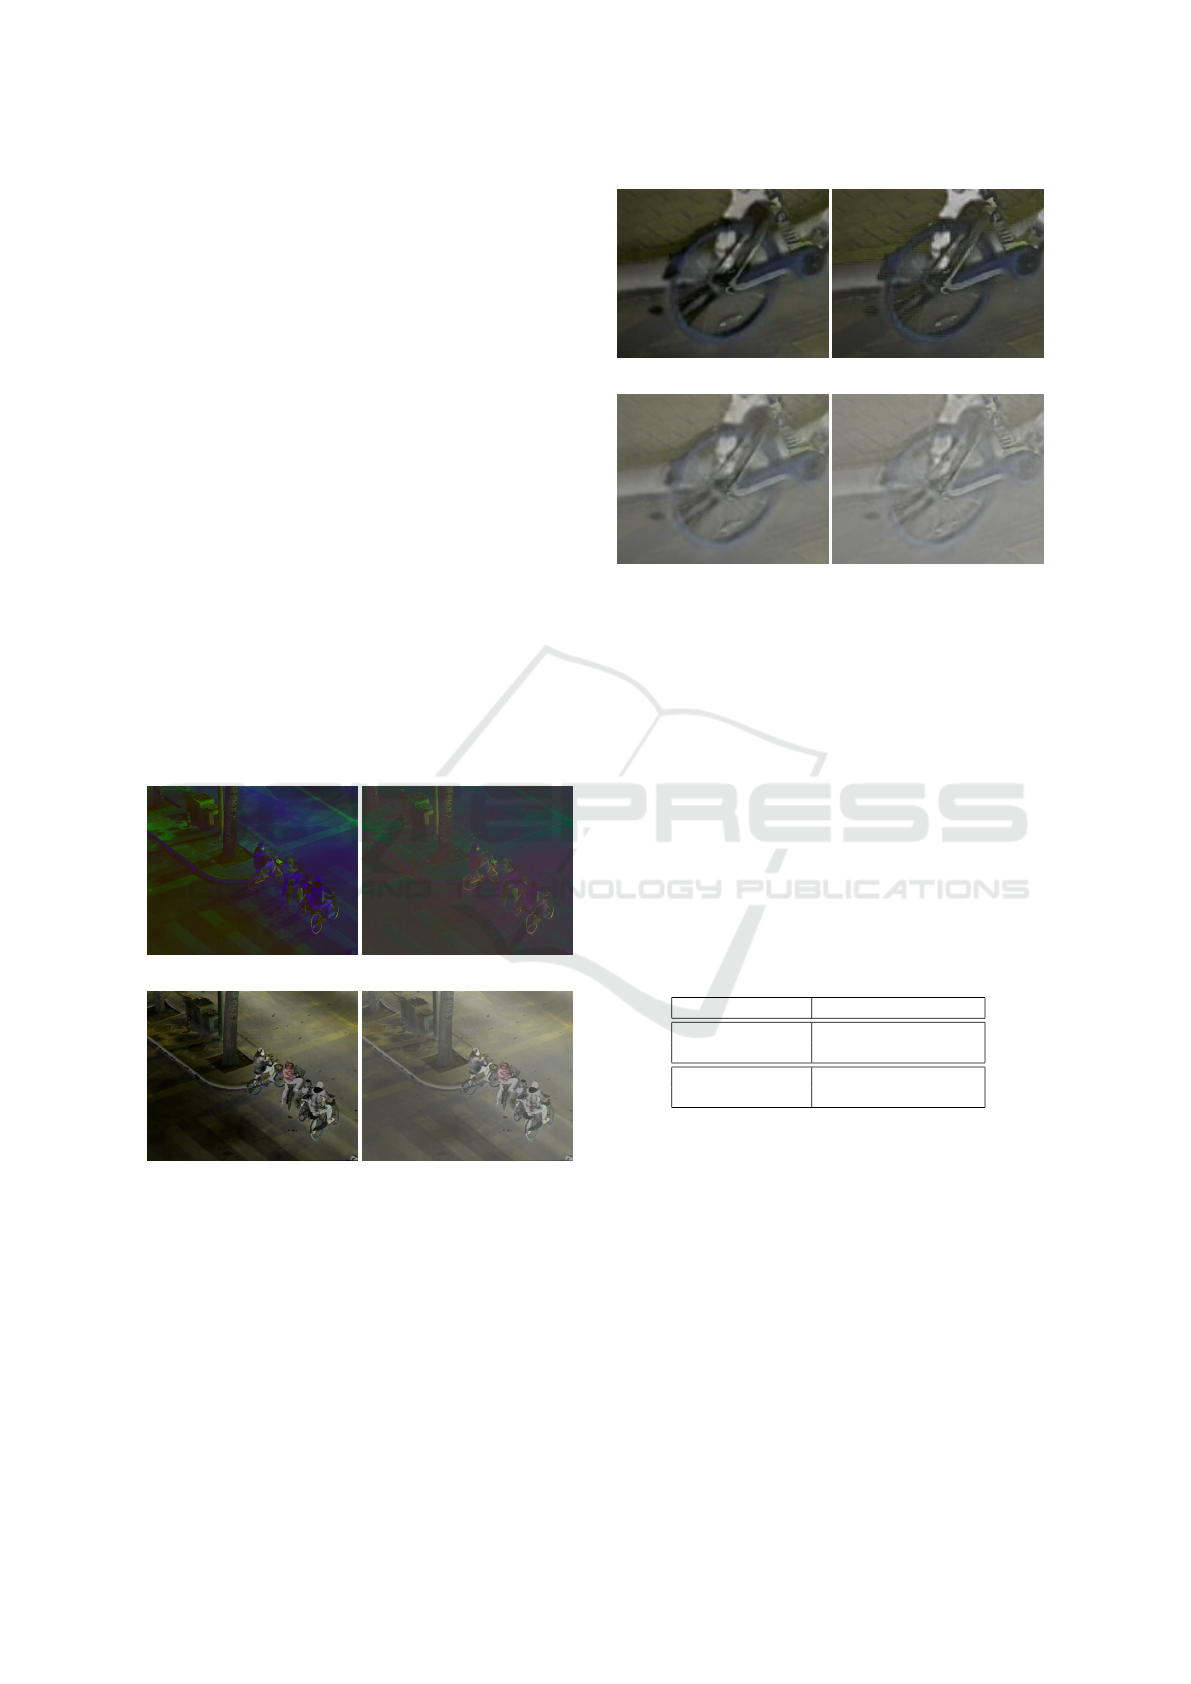
In Figure 3 an example of each fusion for a given
image is presented. As it can be observed both the
FA and the Curvelet fusion provide a cleaner solution
with regards to the PCA and Wavelet fusion, better
isolating the instance and relevant information from
the image. Although visually subtle, the max-value
version of each method (DWT or Curvelet) tends to
provide a clearer image (in a similar way to the dif-
ferences between DWT and Curvelet fusion results).
It can be depicted on Figure 4d, deliberately cropped
and enlarged to pixel level, how the maximum-value
fusion tends to miss some information and produce
noisier results with regards to the average version.
(a) (b)
(c) (d)
Figure 3: Examples in false colour representation of the re-
sult of each fusion method based on an LLVIP dataset im-
age. (a) PCA fusion. (b) FA fusion. (c) Wavelet based
fusion (averaged channels). (d) Curvelet based fusion (av-
eraged channels).
For reproducibility purposes, the source code
of both reprojection methods (https://github.
com/enheragu/yolo_test_utils/blob/v2.1.
0-icinco/src/Dataset/fusion_methods/pca_
fa_compression.py, accessed on 01 July 2025)
(a) (b)
(c) (d)
Figure 4: Detail of the resulting image for the averaged and
max-value fusion. (a) Wavelet average fusion. (b) Wavelet
max-value fusion. (c) Curvelet average fusion. (d) Curvelet
max-value fusion.
and both frequency-domain based methods (https:
//github.com/enheragu/yolo_test_utils/
blob/v2.1.0-icinco/src/Dataset/fusion_
methods/wavelets_mdmr_compression.py,
accessed on 01 July 2025) are publicly available.
4 RESULTS
Table 2: Summary of the average computation time to per-
form the fusion for each of the methods based on the images
from the LLVIP dataset.
Fusion Method Mean (s) Std (s)
PCA Fusion 0.9630 0.2030
FA Fusion 62.9443 11.9214
Wavelet Fusion 0.8314 0.0664
Curvelet Fusion 68.8148 2.2531
As already mentioned, although mAP (mean Average
Precision) is the standard when comparing different
detection deep learning algorithms, specific use case
might require a more in depth analysis. In this re-
search precision and recall are evaluated alone, and
then both mAP50 and mAP50-95 are presented.
Figure 5 depicts a precision recall curve for each
of the methods. Note that the axis have been adjusted
to focus the plot on the area of interest.
• As it can be seen, although the FA method (the
yellow line in the graph) reaches the highest preci-
sion, the recall slightly degrades. As indicated in
the Introduction, this research is focused on SAR
A Robust Comparative Study of Adaptative Reprojection Fusion Methods for Deep Learning Based Detection Tasks with RGB-Thermal
Images
317
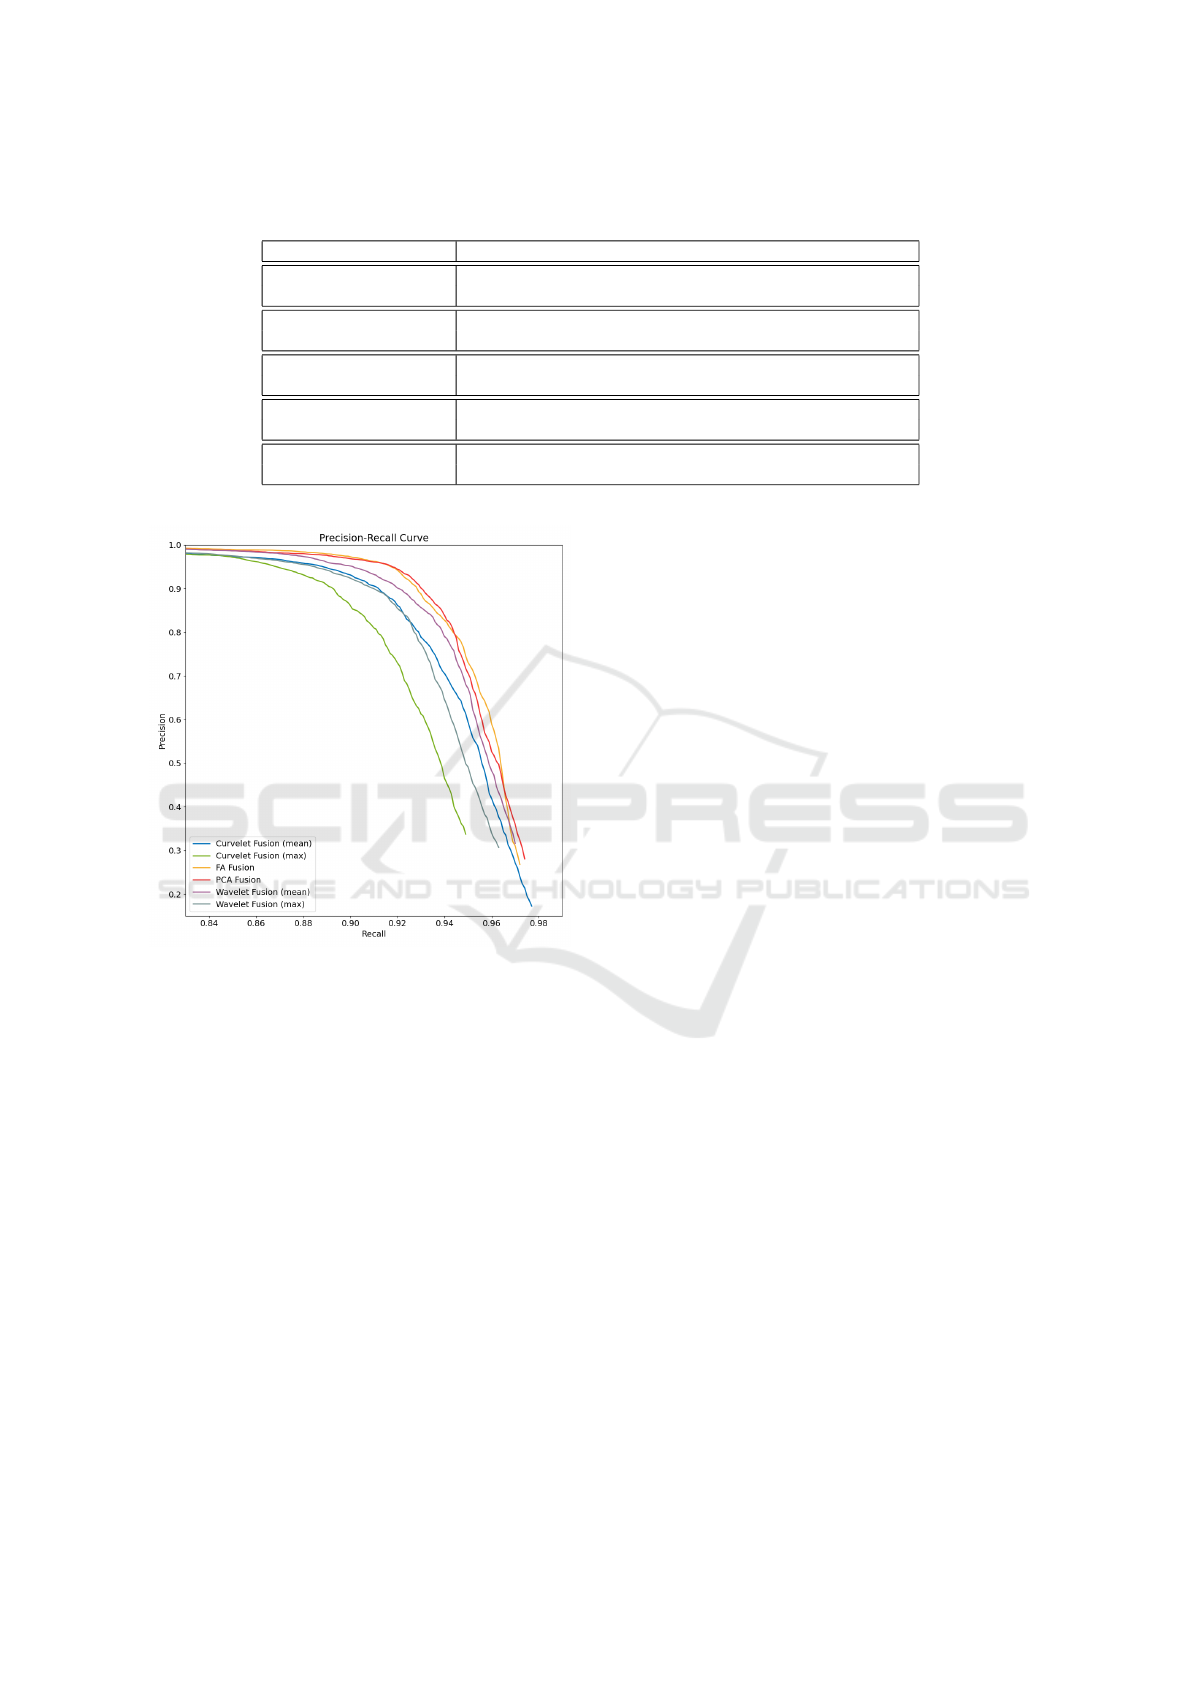
Table 3: Detection performance (mAP) and fusion time for each method compared to Visible, LWIR and VT method
(Heredia-Aguado et al., 2025) with thermal channel equalization. The most relevant results are highlighted in bold.
Method Precision Recall mAP50 mAP50-95 Best Epoch
Visible alone 0.871 0.799 0.870 0.487 18
LWIR alone 0.961 0.914 0.966 0.655 37
VT (No eq.) 0.946 0.900 0.955 0.640 16
VT (Thermal eq.) 0.961 0.935 0.974 0.671 60
PCA Fusion 0.9602 0.9107 0.9589 0.6416 36
FA Fusion 0.9659 0.9070 0.9582 0.6368 37
Wavelet Fusion (mean) 0.9606 0.8899 0.9543 0.6405 38
Wavelet Fusion (max) 0.9525 0.8827 0.9454 0.6289 58
Curvelet Fusion (mean) 0.9537 0.8858 0.9476 0.6066 15
Curvelet Fusion (max) 0.9612 0.8602 0.9346 0.6190 64
Figure 5: Precision recall curve for all the methods included
in this research.
operations or vigilance, areas in which missing in-
stances might be more critical than in other do-
mains. For this reason, it is always advisable to
operate at a work point with a high recall, rather
than a high precision.
• With a similar behaviour, the Curvelet with max-
value (green line in the graph) fusion also reaches
a high precision before quickly deteriorating. In
this sense, the mean-fusion version of the Curvelet
(blue line in the plot) approach although starting
with a lower precision, it is capable of maintaining
a better recall, which would make it more suitable
for SAR operations.
• On the other hand, methods like the Wavelet fu-
sion (mean) (purple line) and PCA (red line), fu-
sion demonstrate a more balanced performance,
maintaining relatively high precision even as re-
call increases. From the Table 3, PCA fusion con-
sistently achieves the best mAP50 and mAP50-95
from the methods discussed in this article.
• Finally the maximum-value version of the
Wavelet fusion has a similar behaviour than the
max-value version of the Curvelet fusion method.
Although the mean-value version of the Curvelet
fusion method has a more balanced performance
than both max-value fusion (wavelet and curvelet)
it is still quite low in performance both in preci-
sion and recall, as seen in Table 3, compared to
the other methods (mean-version of the Wavelet
fusion, PCA and FA fusions.
Although precision and recall are an important
metric, execution time should not be forgotten. In
Table 2 a summary of fusion time for each method
is presented. As it can be observed, Factor Analy-
sis and Curvelet approach are quite time consuming
methods, taking more than one minute for each im-
age, while PCA and Wavelet fusion takes less than
one second, complying with the 1 Hz requirement
mentioned in the introduction. Note that the images
in the LLVIP dataset are quite big in terms of reso-
lution, these methods might be faster under other cir-
cumstances as working with images from the KAIST
dataset, that are half the pixel size with regards to the
LLVIP dataset images.
Table 3 summarizes the detection results for all
fusion methods, as well as single-modality baselines
(RGB-only, LWIR-only), using metrics from our pre-
vious work (Heredia-Aguado et al., 2025) for refer-
ence. Based on a visual inspection of the dataset im-
ages from Figure 2 it can be already advanced that the
visible channel would have a low performance as it in-
cludes pretty poor information. On the other hand the
LWIR/Thermal images has the largest quantity of in-
formation, compared to RGT images due to the nature
of the dataset involved in the tests (daylight images
could differ). Due to the invariance in pedestrian tem-
perature and the low temperature of the background
ICINCO 2025 - 22nd International Conference on Informatics in Control, Automation and Robotics
318

at night, pedestrians are well defined, which already
advances a good performance based on this informa-
tion. These results can be compared to the VT fusion
method (Heredia-Aguado et al., 2025), presented in
the table, and tested under the same conditions as the
rest of the methods described in this manuscript (night
condition based on LLVIP dataset). The poor colour
information that can be observed explains the per-
formance of the VT method (Heredia-Aguado et al.,
2025) as it is based on combining the intensity chan-
nel from the RGB image with the thermal channel
from the LWIR image, disregarding the colour infor-
mation. Note that this method includes an equaliza-
tion of the thermal channel, that proved to be rele-
vant in enhancing the results of the methods tested,
as the non equalized version performed poorly with
regards to the presented methods (Heredia-Aguado
et al., 2025). In terms of mAP50 and mAP50-95 both
PCA fusion and FA fusion seem to be promising, and
might benefit a lot from a thermal channel equaliza-
tion.
Table 2 showed the average computation time of
each fusion method. Once the image has been fused
it is fed to the detection algorithm, YOLOv8, to be
trained on this specific image set. It is important
to review the difficulties the network might have to
reach the best performance, depicted in Figure 5, on
each image fusion type. In terms of training duration,
PCA, FA, and Wavelet fusion methods all achieved
similar performance within a comparable number of
epochs. The LWIR-alone approach also required a
similar training time, whereas the VT fusion method
needed almost twice as many epochs to reach its best
result. Notably, the results from both the equalized
and non-equalized versions of VT fusion indicate that
applying an equalization phase increases the training
time required for all methods, but also leads to im-
proved performance.
4.1 Discussion
Despite the sophistication of the dynamic fusion
methods, improvements with regards to previous and
simpler fusion methods are limited on LLVIP, likely
due to the dataset’s high image quality and lack of
challenging occlusions.
Notably, mean-based fusion in Wavelets outper-
formed max-value based fusion for detail coefficients,
suggesting that averaging may better preserve subtle
features in detection tasks for this specific use case.
In the case of the Curvelet fusion, although the preci-
sion was improved, the recall suffered a relevant drop
in terms of recall. Contrary to some of the bibliogra-
phy already presented, mean-based fusion proved to
be more balanced for detection tasks based on RGB-
Thermal image fusion.
Although both Factor Analysis (FA) and Curvelet-
based fusion methods offer theoretically appealing
approaches for extracting and combining complemen-
tary information from RGB and thermal images, their
practical application in this study revealed significant
practical limitations due to computational speed. In
our experiments, these methods proved to be con-
siderably slower than other fusion strategies, making
them less suitable for real-time deployment scenar-
ios, such as onboard robotic systems for search and
rescue or surveillance. The high computational cost
associated with FA and Curvelet transforms, partic-
ularly during the transformation and inverse recon-
struction stages, poses a substantial bottleneck, espe-
cially when compared to more efficient methods like
PCA or deep learning-based early fusion. This trade-
off must be carefully considered when selecting fu-
sion algorithms for time-sensitive applications.
5 CONCLUSIONS
We present a robust comparative study of dynamic fu-
sion methods for RGB and thermal images, evaluated
with YOLOv8 on LLVIP dataset. While advanced
methods do not always outperform simpler baselines
in controlled settings, our work underscores the im-
portance of methodological rigour and transparent re-
porting of negative results. Such studies are essential
for advancing the state of the art and guiding future
research in multispectral fusion.
It is important to note that the presented study is
limited to well-aligned, high-quality images. Future
work should evaluate fusion methods on more chal-
lenging datasets, including occlusions, or diverse en-
vironmental conditions.
As already mentioned, it is important to evaluate
these methods with different equalization techniques,
as it proved to be relevant with early fusion methods
for the detection task (Heredia-Aguado et al., 2025).
Future work should take this into account. Although
under the conditions described, the methods were not
able to outperform LWIR alone or VT (with thermal
equalization), the results from VT without equaliza-
tion suggest that there is potential for improvement
with better fusion strategies.
ACKNOWLEDGEMENTS
This research work is part of the project funded
by ”AYUDAS A LA INVESTIGACI
´
ON 2025
A Robust Comparative Study of Adaptative Reprojection Fusion Methods for Deep Learning Based Detection Tasks with RGB-Thermal
Images
319

DEL VICERRECTORADO DE INVESTIGACI
´
ON
Y TRANSFERENCIA” of the Miguel Hern
´
andez
University; the project PID2023-149575OB-I00
funded by MICIU/AEI/10.13039/501100011033 and
by FEDER, UE; and the project CIPROM/2024/8,
funded by Generalitat Valenciana, Conselleria de Ed-
ucaci
´
on, Cultura, Universidades y Empleo (program
PROMETEO 2025).
REFERENCES
Carion, N., Massa, F., Synnaeve, G., Usunier, N., Kirillov,
A., and Zagoruyko, S. (2020). End-to-end object de-
tection with transformers. In Vedaldi, A., Bischof, H.,
Brox, T., and Frahm, J.-M., editors, Computer Vision
– ECCV 2020, pages 213–229, Cham. Springer Inter-
national Publishing.
Diwan, T., Anirudh, G., and Tembhurne, J. V. (2023). Ob-
ject detection using yolo: challenges, architectural
successors, datasets and applications. Multimedia
Tools and Applications, 82(6):9243–9275.
Elmasry, S. A., Awad, W. A., and Abd El-hafeez, S. A.
(2020). Review of different image fusion techniques:
Comparative study. In Ghalwash, A. Z., El Khameesy,
N., Magdi, D. A., and Joshi, A., editors, Internet of
Things—Applications and Future, pages 41–51, Sin-
gapore. Springer Singapore.
Heredia-Aguado, E., Cabrera, J. J., Jim
´
enez, L. M., Va-
liente, D., and Gil, A. (2025). Static early fusion tech-
niques for visible and thermal images to enhance con-
volutional neural network detection: A performance
analysis. Remote Sensing, 17(6).
Hwang, S., Park, J., Kim, N., Choi, Y., and Kweon, I. S.
(2015). Multispectral pedestrian detection: Bench-
mark dataset and baseline. In 2015 IEEE Conference
on Computer Vision and Pattern Recognition (CVPR),
pages 1037–1045.
Indira, K. (2015). Image fusion for pet ct images using
average maximum and average contrast rules. Int J
Appl Eng Res, 10(1):673–80p.
Jia, X., Zhu, C., Li, M., Tang, W., and Zhou, W. (2021).
Llvip: A visible-infrared paired dataset for low-light
vision. In Proceedings of the IEEE/CVF International
Conf. on Computer Vision, pages 3496–3504.
Jiang, P., Ergu, D., Liu, F., Cai, Y., and Ma, B. (2022). A re-
view of yolo algorithm developments. Procedia Com-
puter Science, 199:1066–1073. The 8th International
Conference on Information Technology and Quantita-
tive Management (ITQM 2020 & 2021): Developing
Global Digital Economy after COVID-19.
Jocher, G., Chaurasia, A., and Qiu, J. (2023). YOLOv8 by
Ultralytics.
Joliffe, I. and Morgan, B. (1992). Principal component
analysis and exploratory factor analysis. Statistical
Methods in Medical Research, 1(1):69–95. PMID:
1341653.
Kumar, S. S. and Muttan, S. (2006). PCA-based image
fusion. In Shen, S. S. and Lewis, P. E., editors,
Algorithms and Technologies for Multispectral, Hy-
perspectral, and Ultraspectral Imagery XII, volume
6233, page 62331T. International Society for Optics
and Photonics, SPIE.
Ma, J. and Plonka, G. (2010). The curvelet transform.IEEE
Signal Processing Magazine, 27(2):118–133.
McInnes, L., Healy, J., and Melville, J. (2020). Umap: Uni-
form manifold approximation and projection for di-
mension reduction.
Ofir, N. (2023). Multispectral image fusion based on su-
per pixel segmentation. In ICASSP 2023 - 2023 IEEE
International Conf. on Acoustics, Speech and Signal
Processing (ICASSP), pages 1–5.
Patil, V., Sale, D., and Joshi, M. (2013). Image fusion meth-
ods and quality assessment parameters. Asian Journal
of Engineering and Applied Technology, 2:40–45.
Ren, S., He, K., Girshick, R., and Sun, J. (2017). Faster r-
cnn: Towards real-time object detection with region
proposal networks. IEEE Transactions on Pattern
Analysis and Machine Intelligence, 39(6):1137–1149.
Sahu, V. and Sahu, D. (2014). Image fusion using wavelet
transform: A review. Global Journal of Computer Sci-
ence and Technology, 14(F5):21–28.
Sifuzzaman, M., Islam, R., and Ali, M. (2009). Appli-
cation of wavelet transform and its advantages com-
pared to fourier transform. Journal of Physical Sci-
ence, 13:121–134.
Starck, J.-L., Candes, E., and Donoho, D. (2002). The
curvelet transform for image denoising. IEEE Trans-
actions on Image Processing, 11(6):670–684.
Van der Maaten, L. and Hinton, G. (2008). Visualizing data
using t-SNE. Journal of machine learning research,
9(11).
Zhang, D. (2019). Wavelet Transform, pages 35–44.
Springer International Publishing, Cham.
ICINCO 2025 - 22nd International Conference on Informatics in Control, Automation and Robotics
320
