
Linking User Experience and Business Outcomes: How Perceived
Usefulness of AI Chatbots Predicts Satisfaction and NPS
Tim-Can Werning
1a
, María José Escalona
2b
and Andreas Hinderks
3c
1
Department of Economics, Offenburg University of Applied Sciences, Germany
2
Department of Computer Science, University of Seville, Spain
3
Department of Economics and Computer Science, Hannover University of Applied Sciences and Arts, Germany
Keywords: User Experience, Net Promoter Score, CSAT, Artificial Intelligence, Human-AI Interaction.
Abstract: The integration of AI-based features is rapidly transforming interactions with software systems. While these
innovations aim to enhance functionality, their impact on user experience and business outcomes such as
satisfaction and loyalty remains underexplored. This study investigates how the user experience (UX) of AI
chat bots relates to two key user-level outcomes: Customer Satisfaction (CSAT) and Net Promoter Score
(NPS). Drawing on a sample of N = 146 users, we conducted regression analyses, including interaction terms
with AI usage frequency and perceived competency. Results indicate that perceived Usefulness significantly
predicts both CSAT and NPS, with partial support of moderation effect by the frequency of AI use.
Specifically, higher usage increases the positive impact of Usefulness on NPS. Overall, our regression models
for CSAT and NPS explained around 39% and 48% of the variance, respectively. These results indicate a
good model fit and underline the importance of good UX in AI systems, as this is significantly impacting the
satisfaction and loyalty of users. In summary, by linking established UX metrics to strategic business
indicators, we show how UX professionals can contribute to more business value and additionally offer
guidance to adopt a more user-centered perspective on AI development.
1 INTRODUCTION
To evaluate the success of digital systems, many
organizations rely on subjective indicators such as the
Customer Satisfaction Score (CSAT) and the Net
Promoter Score (NPS). Originally developed for
customer-facing products, they have also since been
adopted across work platforms. However, these
overall values leave little guidance on how to improve
the system. It becomes especially difficult to base
improvements on overall metrics, because they do not
reveal what specific improvements could uplift the
metrics. The disconnect between what can be
changed in a system and the measured outcomes
limits the strategic value of CSAT and NPS in digital
product development.
This problem becomes even more relevant in the
context of artificial intelligence (AI), which
introduces an additional layer of complexity for users.
Since AI tools represent a critical shift in human–
a
https://orcid.org/0009-0005-3855-0168
b
https://orcid.org/0000-0002-6435-1497
c
https://orcid.org/0000-0003-3456-9273
technology interaction, their successful integration
into everyday work is considered one of the key
transformative challenges for the coming years
(Chhatre & Singh, 2024). When companies add non-
functional or underdeveloped AI features to their
systems, the likelihood of a successful transformation
decreases significantly (Hassan et al., 2024; Raji et
al., 2022). Consequently, it is essential for
digitalization initiatives to identify which aspects of
user experience (UX) influence the satisfaction and
acceptance of AI-supported systems (Cooper, 2024).
One of the main integrations of AI in the
workplace are chat bots, such as Microsoft Copilot or
ChatGPT. These systems assist employees by
providing instant access to information, generating
code, summarizing documents, and automating
routine tasks. Their core function lies in natural
language processing, enabling them to interpret user
input and respond in an appropriate and efficient
manner. By reducing cognitive load and time spent on
502
Werning, T.-C., Escalona, M. J. and Hinderks, A.
Linking User Experience and Business Outcomes: How Perceived Usefulness of AI Chatbots Predicts Satisfaction and NPS.
DOI: 10.5220/0013745900003985
Paper published under CC license (CC BY-NC-ND 4.0)
In Proceedings of the 21st International Conference on Web Information Systems and Technologies (WEBIST 2025), pages 502-510
ISBN: 978-989-758-772-6; ISSN: 2184-3252
Proceedings Copyright © 2025 by SCITEPRESS – Science and Technology Publications, Lda.

repetitive tasks, AI chat bots can enhance
productivity and support knowledge work across
various domains. However, these beneficial results
rely on a positive user experience (Liao et al., 2024).
Therefore, it is of great importance that the
satisfaction of users is high when interacting with AI
chat bots. One promising approach to improve the
satisfaction is the systematic improvement of UX. It
is widely acknowledged as a key driver of system
satisfaction and loyalty (Cheng & Jiang, 2020;
Flavián et al., 2006). However, the specific
relationship of UX to business KPIs such as NPS or
CSAT remains underexplored, particularly in
enterprise environments. In addition, contextual
variables such as frequency of use or self-reported
system knowledge are likely to influence this
relationship.
This paper aims to address the abovementioned
research gaps by analyzing the relationship between
UX and both NPS / CSAT for AI tools. Building on
the established definition of user experience in the
ISO 9241-210 and its multifactorial structure as
proposed by Laugwitz et al. (2008) and extended by
Andreas Hinderks (2016) as well as Schrepp and
Thomaschewski (2019), we investigate how different
UX aspects contribute to users’ reported loyalty and
satisfaction. The following research questions guide
this work:
RQ1: How are UX aspects of AI chat bots
associated with the users’ satisfaction?
RQ2: To what extent are self-reported
frequency of system use and system knowledge
of AI chat bots moderating the relationship
between UX aspects and user satisfaction?
Our results contribute to the growing field of user-
centered evaluation in work contexts while offering
guidance for UX practitioners aiming to align their
design efforts for AI chat bots with measurable
business outcomes.
2 RELATED WORK
2.1 Conceptualizing UX
The ISO 9241-210 defines UX as “a person’s
perceptions and responses resulting from the use or
anticipated use of a product, system or service” (ISO
9241-210, 2020). It encompasses cognitive,
emotional, and physical reactions that occur before,
during, and after interaction with the systems. Unlike
usability, which focuses on goal-directed interaction
(effectiveness, efficiency, and satisfaction), UX
integrates both task-related and affective dimensions,
such as aesthetics, novelty, or stimulation
(Kollmorgen et al., 2024; Schrepp et al., 2017). UX is
a multi-faceted construct, which is defined by several
factors. However, UX depends on the system and its
context of use – the aspects for a voice assistant will
partially differ to those of a power tool, a medical
device, or a game interface.
To operationalize UX for empirical research and
product development, the User Experience
Questionnaire (UEQ) offers six primary scales in the
standard version: Attractiveness, Perspicuity,
Efficiency, Dependability, Stimulation, and Novelty
(Laugwitz et al., 2008). The modular UEQ+ builds on
this foundation by allowing researchers to select from
a broader pool of over 20 validated UX aspects (e.g.,
Usefulness, Trust), depending on which are most
relevant to the specific system and context of use.
This enables researchers to tailor UX measurements
to their needs. This structure enables the creation of
customized questionnaires for specific systems,
domains, or populations (Kollmorgen et al., 2024).
2.2 Measuring NPS and CSAT
In practice, companies mostly assess digital system
performance through perception-based indicators
such as the NPS and CSAT. NPS, measuring the
likelihood to recommend and interpreted as a proxy
for customer loyalty, is probably the most-used
business KPI across industries. It is a single-item
measure asking users to indicate how likely they are
to recommend a product or service to others on a scale
from 0 (not at all) to 10 (extremely likely). The score
is calculated by subtracting the percentage of
detractors (0–6) from the percentage of promoters (9–
10; Reichheld, 2003).
How likely are you to recommend [X] to a
f
riend or collea
g
ue?
0 1 2 3 4 5 6 7 8 9 10
not at all likel
y
extremel
y
likel
y
Figure 1: The Net Promoter Score.
While CSAT is not as common as NPS, it is well-
established in customer experience (CX) research
(see for example Müller & Sedley, 2014). It is usually
calculated by a single Likert-scale item measuring
how satisfied users are with a specific experience,
system, or feature (Lewis & Sauro, 2021). Values of
4 or 5 (on a 5-point scale) are considered "satisfied,"
and the CSAT percentage is computed accordingly
(number of satisfied customers / total number of
responses * 100). CSAT is more context-sensitive
Linking User Experience and Business Outcomes: How Perceived Usefulness of AI Chatbots Predicts Satisfaction and NPS
503
than NPS and often reflects more direct, interaction-
specific sentiments.
Both indicators are increasingly adopted in
enterprise IT (Faltejsková et al., 2016; Owen, 2019).
Despite their widespread use, both indicators are
summary metrics that provide little insight into the
specific causes of dissatisfaction or enthusiasm.
Integrating them with multidimensional UX
measurements can help identify underlying quality
drivers.
How satisfied were you with [X] today?
1 2 3 4 5
Ver
y
dissatis
f
ied
Ver
y
s
atis
f
ied
Figure 2: The Customer Satisfaction Score.
2.3 Linking UX, NPS and CSAT for AI
Several studies have confirmed that UX quality can
directly influence both NPS and CSAT, albeit to
different degrees depending on the context (Meiners
et al., 2020; Schrepp & Thomaschewski, 2024).
Bradner and Sauro (2012) showed that ease of use and
general UX perceptions explained up to 40% of the
variance in NPS across different software products.
Similarly, Boothe et al. (2024) found that UEQ+
scales such as Efficiency and Stimulation were
strongly correlated with likelihood to recommend.
In the context of business software, pragmatic
quality aspects such as Dependability and Perspicuity
have been identified as significant predictors of user
satisfaction (Eidloth et al., 2023). While classic UX
constructs are still relevant for AI-supported systems,
recent work suggests that they should be extended
(Ehsan & Riedel, 2020). They, however, do not fully
capture the evaluative criteria users apply to these
intelligent technologies. Emerging research in
Human–AI interaction has identified additional user
experience dimensions (such as perceived
transparency, quality of content or predictability) that
become particularly salient when chat bots exhibit
non-deterministic or intransparent behavior (e.g.,
Shin, 2021; Kelly et al., 2023). These dimensions go
beyond traditional UX factors and capture how users
make sense of autonomous, generative systems. They
influence whether users feel they can trust and
understand the chat bots’ outputs, which in turn
shapes satisfaction and recommendation likelihood.
2.4 Usage Frequency and Competence
UX perception does not form the users’ opinion in a
vacuum. Contextual variables outside of the system
are actively shaping how users evaluate systems. For
instance, repeated exposure to a system might
intensify both positive and negative impressions,
thereby amplifying the effects of UX quality on
loyalty or satisfaction judgments. Similarly, users
with more system knowledge may be more critical of
poor UX or have learned to navigate a complex
interface, leading to a better evaluation. However,
these variables are rarely considered in empirical
models of UX.
While there are many different variables, we
selected usage frequency and perceived competence
as moderators based on their conceptual relevance in
UX and technology acceptance literature (Davis,
1989). Users who interact with a system more
frequently can develop sharper perceptions of both
strengths and weaknesses in the system. In practice,
this can lead to stronger correlations between UX
factors and NPS or CSAT in high-usage subgroups
(Kollmorgen et al., 2023). Frequent exposure may
amplify the effect of both good and poor design,
which may not be fully captured in short-term
usability tests.
Similarly, perceived competence (how well users
understand or how much they know about the system)
can moderate their overall evaluation. Less
experienced users may attribute poor outcomes to
themselves rather than the system, thereby
underreporting dissatisfaction. Conversely, more
experienced users may be more critical and sensitive
to subtle UX flaws. System knowledge also reflects
users’ self-efficacy and mastery of the system –
factors shown to influence satisfaction judgments
(Bandura, 1997; Venkatesh et al., 2012).
Unlike classic TAM variables, our moderators
contextualize the UX–satisfaction association in
ongoing, real-world system use. These assumptions
are conceptually grounded in the facilitating
conditions and habits, as proposed in the UTAUT2
model (Venkatesh et al., 2012). We suggest that UX-
NPS and UX-CSAT relationships are not uniform,
and that moderating factors should be explicitly
considered in empirical models. This expands prior
models by considering user-internal states and usage
patterns as boundary conditions for UX–KPI
relationships. Incorporating these variables allows for
more nuanced analyses and supports better-informed
design recommendations.
2.5 Research Logic and Hypotheses
Prior work has already demonstrated associations
between UX and satisfaction in consumer software
(e.g., Meiners et al., 2020). However, most studies do
WEBIST 2025 - 21st International Conference on Web Information Systems and Technologies
504

not account for enterprise-specific challenges such as
mandatory use of software or task-critical
functionality. Moreover, little is known about how
UX interacts with contextual variables in AI-
supported enterprise software, which often introduces
system behavior that users perceive as unpredictable
or not transparent (Shin, 2021). These properties
challenge classic UX constructs like efficiency or
dependability, calling for a more nuanced model that
incorporates AI-specific aspects. Our study responds
to this gap by integrating AI-specific conditions into
the UX–satisfaction and UX-loyalty relationships.
Building on prior empirical work and following
theoretical assumptions, we hypothesize that:
H1: Higher ratings of UX aspects of AI chat
bots are positively associated with CSAT.
H2: Higher ratings of UX aspects of AI chat
bots are positively associated with NPS.
H3: The relationship between UX ratings and
CSAT of AI chat bots is moderated by the
user’s perceived system knowledge.
H4: The relationship between UX ratings and
NPS of AI chat bots is moderated by the
frequency of system use.
This logic aligns with established models such as
the Technology Acceptance Model (TAM; Davis,
1989) and the Model of Information Systems Success
(Delone & McLean, 2003), which connect system
quality and information quality to user satisfaction
and usage intention. It is also compatible with UX
frameworks that position subjective perception as the
central determinant of experience quality (ISO 9241-
210, 2020). By testing these hypotheses, this study
contributes to the integration of UX with business and
customer experience metrics, aiming to bridge the
gap between subjective experience and
organizational KPIs. Furthermore, the findings are
intended to support practitioners in selecting and
interpreting UX indicators in a way that helps align
and support business goals.
3 METHOD
3.1 Participants and Procedure
Data were collected via an online panel platform
(Prolific) in October 2024, targeting users who
actively engage with AI-supported systems at work or
at home. All participants provided informed consent.
The study followed Prolific’s ethical guidelines and
complied with GDPR standards. No personally
identifiable data were collected. After applying a
filter to exclude non-users of AI tools, a total of N =
146 participants remained in the sample. In the
beginning, we collected demographic variables (age,
gender) and asked participants if and what AI chat
bots (e.g., ChatGPT, Google Gemini) they use.
Afterwards, the participants had to rate their
experience with standardized UX ratings (UEQ+),
and subjective assessments of usage frequency,
system competence, satisfaction, and loyalty.
A post-hoc power analysis indicated that a sample
size of N = 124 would be required to detect a
moderate effect (f² = .30) with 13 predictors, α error
probability of .05, and power of .90. The present
sample (N = 146) thus offers a high power for
detecting direct and interaction effects.
3.2 Measures
3.2.1 User Experience Aspects
Based on conceptual considerations, we chose the
five most AI-relevant dimensions from the UEQ+:
Usefulness, Quality of Content, Stimulation,
Attractiveness, and Trust. Each dimension was
assessed using 4 semantic differential items on a 7-
point scale, ranging from –3 to +3. Cronbachs
α was
very good for all aspects.
For each participant, the items
of a given scale were aggregated by computing the
mean, resulting in composite scores per UX aspect
(see table 1 for mean, SD and Cronbachs
α).
3.2.2 Outcome Variables
CSAT was measured using a single item asking,
“How satisfied are you with [the AI chat bot]?”.
Participants assessed their satisfaction on a 5-point
Likert scale from 1 (not satisfied at all) to 5 (very
satisfied). NPS was measured using the standard
format (Reichheld, 2003): “How likely are you to
recommend [the AI chat bot] to a colleague?”, on a
scale from 0 (not at all likely) to 10 (extremely likely).
Table 1: Mean, SD and Cronbachs α for UEQ aspects.
Aspect Mean (SD) Cronbachs α
Usefulness 2.11 (0.88) 0.87
Quality of Content 1.89 (0.93) 0.86
Stimulation 1.77 (1.05) 0.91
Attractiveness 2.00 (0.97) 0.88
Trust 0.99 (1.35) 0.94
Linking User Experience and Business Outcomes: How Perceived Usefulness of AI Chatbots Predicts Satisfaction and NPS
505

Table 2: Linear hierarchical regression of UEQ aspects and moderators on CSAT.
Coefficients β-Estimate Std. Error t-value p-value
(Intercept) -0.021 0.068 -0.302 0.763
Usefulness 0.451 0.115 3.915 0.000***
Quality of Content 0.022 0.135 0.165 0.869
Stimulation 0.170 0.108 1.573 0.118
Attractiveness 0.068 0.131 0.516 0.606
Trust 0.055 0.098 0.568 0.571
Age -0.125 0.071 -1.767 0.080
†
Gender 0.073 0.072 1.024 0.308
AI frequency -0.037 0.073 -0.515 0.607
AI knowledge 0.012 0.074 0.160 0.873
Usefulness * AI frequency 0.087 0.082 1.054 0.294
Usefulness * AI knowledge 0.123 0.074 1.667 0.098
†
Trust * AI frequency -0.126 0.086 -1.461 0.146
Trust * AI knowledge -0.136 0.073 -1.869 0.064
†
Note. R²
adj
= 0.389. F(13, 131) = 8.13.
†
p < .1, * p < .05, ** p < .01, *** p < .001.
3.2.3 Moderators
AI knowledge and AI usage frequency were assessed
via self-report and z-standardized for interaction
analyses. AI knowledge was assessed with the
following self-report item: “How well do you
understand [the AI chat bot] that you use?”, rated on
a 5-point scale. AI usage frequency was measured via
the item: “How often do you use [the AI chat bot] in
your daily work?” (1 = rarely, 5 = multiple times a
day).
3.2.4 Analytical Strategy
All statistical analyses were conducted with R (R
Core Team, 2024). Prior to analysis, all continuous
variables were z-standardized to improve the
interpretation of regression coefficients and
interaction terms. Composite scores for the five
chosen UX dimensions were computed as the mean
of four semantic differential items each, following the
UEQ+ framework. Participants who reported not
using AI-supported systems were excluded from
analysis. We removed missing data listwise, resulting
in a complete-case sample for all regression analyses.
Interactions for Usefulness × Knowledge/Frequency
and Trust × Knowledge/Frequency were computed to
test moderation hypotheses.
First, we tested for all regression assumptions.
Afterwards, each outcome was modeled in two steps.
Firstly, we calculated a base regression model
including only main effects (UX aspects,
demographics), followed by an extended model
including interaction terms to evaluate moderation
effects. All models were estimated using ordinary
least squares (OLS). Residuals were visually
inspected for linearity, homoscedasticity, and
normality.
4 RESULTS
4.1 Descriptive Statistics
Correlational analysis revealed significant positive
bivariate correlations between CSAT and Usefulness
(r = .61, p < .001), Stimulation (r = .53, p < .001), and
Attractiveness (r = .54, p < .001). AI frequency
showed a small negative correlation with CSAT (r =
–.24, p < .01), suggesting that more frequent users
were somewhat less satisfied.
VIF for all variables remained below the critical
threshold of 5, indicating no multicollinearity in the
data (O’brien, 2007). Model diagnostics also
indicated no severe violations of homoscedasticity
and normality of residuals (see Figure 1).
Homoscedasticity was assessed using the Breusch–
Pagan test (Breusch & Pagan, 1979). Both the CSAT
model (BP = 13.752, p = .392) and the NPS model
(BP = 15.961, p = .251) showed no indication of
heteroscedasticity, suggesting no violation of the
constant variance assumption.
Additionally, Cook’s Distance was used to
identify influential observations. Applying the cutoff
of 3*mean (Fox, 2020), seven observations were
identified as influential in the CSAT model and
eleven in the NPS model. Inspection of Cook’s
Distance plots confirmed existence of these cases,
which were therefore excluded from analysis.
WEBIST 2025 - 21st International Conference on Web Information Systems and Technologies
506
4.2 Predicting Customer Satisfaction
Among the UX predictors in the direct model (no
moderation), only Usefulness was significantly
associated with CSAT (β = .41, p < .001). All other
UX aspects as well as age and gender did not reach
significance. The base model explained 38.9% of the
variance in CSAT (R²
adj
= .389). In the extended
model (including the moderations), the Trust ×
knowledge interaction was statistically significant (β
= –.17, p = .042), indicating that the relationship
between Trust and user satisfaction weakens for more
experienced users.
The association between Usefulness and
satisfaction remained significant (β = .46, p < .001).
None of the other hypothesized interactions reached
significance, although Usefulness × knowledge
showed a trend-level effect (β = .14, p = .070). The
extended model explained a slightly larger amount of
the variance, indicating that the moderation model fits
the data similarly (R²
adj
= .397, F(13, 123) = 6.67, p <
.001). The results of the full regression for CSAT with
moderators are displayed in table 2.
4.3 Predicting NPS
Of all UEQ aspects in the direct model (no
moderation), Attractiveness (β = .31, p = .014) and
Usefulness (β = .23, p = .030) were significantly
associated with the NPS. The other UX aspects did
not reach significance. However, Stimulation was
marginally significant (β = .18, p = .082). The base
model (without moderation) accounted for 42.9% of
variance in NPS (R²
adj
= .429). Adding interaction
terms increased the explained variance significantly
(R²
adj
= .49, F(13, 119) = 10.73, p < .001). Frequency
significantly moderated the association between
Usefulness and NPS (β = .176, p = .026), indicating
that Usefulness has a larger impact on loyalty when
usage frequency is high. No significant effects were
observed for Trust interactions or Usefulness ×
knowledge. Table 3 summarizes the results of the
regression modelling for NPS values.
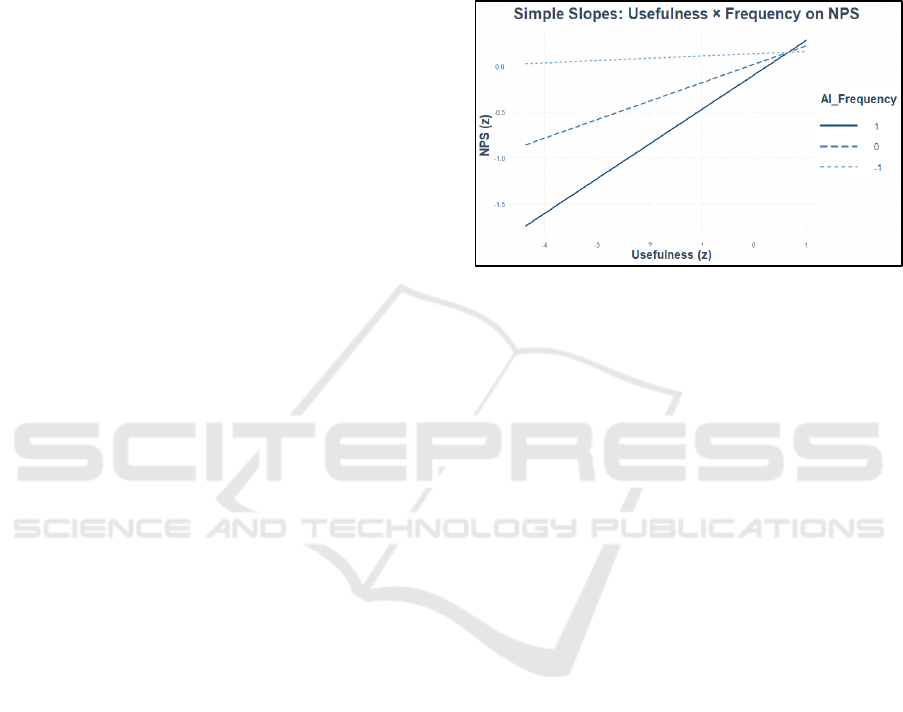
To examine how strongly the moderation effect of
frequency of use impacts the effect of Usefulness on
NPS, we conducted a simple slopes analysis. The
results show that Usefulness has a statistically
significant positive effect on NPS only when
frequency of use is relatively high. Specifically, when
frequency of use is one standard deviation above the
mean, Usefulness strongly predicts higher NPS (β =
0.38, p = .01). At average levels of frequency of use,
the effect is weaker and only marginally significant
(β = 0.20, p = .07), while at low levels (−1 SD),
Usefulness has no significant effect on the NPS value
(β = 0.02, p = .85). Overall, the simple slopes analysis
(Aiken & West, 1991) revealed that the relationship
between Usefulness only becomes significant (p <
.05) when frequency of use exceeds average values.
Figure 3 illustrates the different effects of Usefulness
on NPS based on the frequency of use.
Figure 3: Simple slopes analysis for Usefulness ×
Frequency on NPS.
5 DISCUSSION
This study examined how selected UX aspects
influence user-reported satisfaction and loyalty in the
context of AI-supported enterprise systems with an
additional look at the moderating roles of usage
frequency and perceived competence. The findings
provide partial support for the proposed hypotheses.
While most interactions did not reach conventional
significance thresholds, our sample size provides high
statistical power to detect effects.
Therefore, we follow Gelman and Stern (2006)
and interpret these marginal effects as informative for
future studies rather than dismissing them solely
based on the cutoffs. Usefulness emerged as the only
direct predictor for CSAT, providing partial support
for hypothesis 1. It also had a moderate effect on NPS,
underscoring the central role of Usefulness in shaping
users’ evaluations of AI-enabled systems.
Additionally, Attractiveness significantly contributed
to NPS but not to CSAT, suggesting that affective UX
aspects may be more influential when users are asked
to rate their loyalty or recommend a system rather
than when evaluating their own satisfaction.
Regarding the moderation hypotheses, frequency
only moderated the association between Usefulness
and NPS, but not CSAT. Similarly, both associations
were not moderated by perceived knowledge. These
results are inconclusive, which suggests that further
research is needed to answer research question 2.
Linking User Experience and Business Outcomes: How Perceived Usefulness of AI Chatbots Predicts Satisfaction and NPS
507
Table 3: Linear hierarchical regression of UEQ aspects and moderators on NPS.
Coefficients β-Estimate Std. Error t-value p-value
(Intercept) 0.021 0.065 0.323 0.747
Usefulness 0.201 0.110 1.829 0.070
†
Quality of Content 0.096 0.129 0.744 0.458
Stimulation 0.159 0.103 1.544 0.125
Attractiveness 0.312 0.125 2.494 0.014*
Trust -0.081 0.093 -0.871 0.385
Age -0.034 0.068 -0.495 0.621
Gender -0.068 0.068 -0.990 0.324
AI frequency -0.116 0.069 -1.667 0.098
†
AI knowledge 0.073 0.071 1.030 0.305
Usefulness * AI frequency 0.176 0.078 2.249 0.026*
Usefulness * AI knowledge -0.037 0.070 -0.524 0.601
Trust * AI frequency -0.128 0.082 -1.557 0.122
Trust * AI knowledge -0.004 0.070 -0.052 0.958
Note. R²
adj
= 0.49. F(13, 119) = 10.73.
†
p < .1, * p < .05, ** p < .01, *** p < .001.
In support of H4, the frequency moderated the
relationship of Usefulness and NPS. This indicates
that repeated and regular interaction with a system
may support the perceived loyalty and
recommendation likelihood. Other moderation
effects were not statistically significant, although
some marginal trends (e.g., Usefulness × Knowledge)
indicate potential for further investigation.
Overall, our findings suggest that RQ1 can be
clearly answered: Perceived Usefulness is the most
consistent and robust UX predictor of user
Satisfaction and likelihood to recommend in AI-
supported enterprise systems. Regarding RQ2, the
evidence is more diverse. While we found a
significant moderation of usage frequency on the
Usefulness-NPS relationship, the other hypothesized
interaction effects (e.g., knowledge as a moderator)
remained non-significant. We therefore could not find
evidence that knowledge is moderating the
relationship between UX aspects and NPS / CSAT.
5.1 Theoretical Implications
The presented results contribute to the growing body
of work linking UX to business-relevant outcomes
and extend prior findings by incorporating contextual
moderators. They underscore the central role of
perceived Usefulness in shaping satisfaction, aligning
with established models such as the TAM and the IS
Success Model. In the context of AI-supported
systems, this finding is particularly relevant. As AI
introduces entirely new forms of system behavior,
users are likely to judge these innovations based on
whether they effectively support their tasks and
deliver practical value.
While H3 and H4 were not clearly supported,
knowledge and usage frequency seem to play some
role in this relationship, which needs to be further
analyzed in future research. While the marginal
trends suggest relevant interaction effects, the data
does not provide robust evidence that these user
characteristics impact the association between UX
and satisfaction. Even when the moderator effects are
significant, the explained variance does not show a
strong improvement. This indicates that adding the
interaction paths does not improve the model
substantially.
The results suggest that, even in complex AI-
driven environments, perceived Usefulness remains a
stable and generalizable predictor of satisfaction
across user profiles. This implies that, at least in
enterprise contexts, where system use is often task-
driven and mandatory, functional utility tends to
outweigh emotional or aesthetic qualities when
aiming to increase user satisfaction. While affective
UX factors matter for NPS, satisfaction itself seems
to rest on more pragmatic considerations.
5.2 Practical Implications
For UX practitioners and product teams working on
AI-supported systems, these findings underscore the
strategic importance of functional value. The data
clearly underlines the necessity to enhance perceived
Usefulness, e.g. through improved task support or
relevance to user goals. By prioritizing these
measures over aspects such as attractiveness or
stimulation, improvements are likely to have the most
impactful benefits across user groups.
WEBIST 2025 - 21st International Conference on Web Information Systems and Technologies
508

The significant moderation offers additional
guidance: While advanced UX segmentation (e.g.,
tailoring for novice vs. expert users) may not be
essential for improving CSAT, usage frequency does
shape loyalty dynamics. Designers may thus consider
interventions that maximize the usage of AI features
to improve loyalty.
5.3 Limitations
Several limitations should be noted. First, the cross-
sectional and self-reported nature of the data limits
causal interpretations. Future studies should employ
longitudinal or experimental designs to better assess
the directionality of effects. Second, while
incorporating two interaction variables, the study did
not explore further interaction effects, such as digital
maturity, training quality, or leadership support.
These contextual factors can significantly shape the
system evaluation and should be explored further.
Future studies should aim to build on these results
by employing longitudinal or diary-based methods
that capture changes in UX perception over time,
especially as users become more familiar with AI chat
bots. Objective usage data, such as frequency logs,
error rates, or time-on-task could offer additional
insights by triangulating them with subjective ratings,
thereby strengthening validity. By combining this
approach with additional independent variables (e.g.,
job autonomy, social support) and control variables
(e.g., job domain, education), future studies could
further support our understanding of the relationship
between UX, satisfaction and recommendation
likelihood for AI chat bots.
5.4 Future Research
Additionally, while our findings support the
relevance of classical UX predictors for AI-
supported, there are also distinctive new challenges to
the systems design that may not be fully captured by
traditional UX frameworks. Emerging research in
human-AI interaction highlights additional aspects
such as perceived transparency, controllability, and
system predictability as critical determinants of user
experience with AI systems (Kelly et al., 2023).
These dimensions are particularly relevant when AI
systems exhibit non-deterministic behavior (e.g.,
providing inconsistent answers) or operate with
limited explainability (e.g., suggest actions without
visible reasoning). In such cases, users may
experience uncertainty or reluctance to rely on the
system, even if core UX features might be intact.
Consequently, by integrating AI-specific UX
constructs in future research, we can deepen our
understanding of satisfaction and loyalty mechanisms
in intelligent systems and better reflect the real-world
evaluative processes users apply to AI-driven
functionality. Integrated models that connect UX to
concrete business outcomes like productivity,
adoption, or task success can strengthen the strategic
alignment between design, experience, and business
impact.
REFERENCES
Aiken, L. S., & West, S. G. (1991). Multiple regression:
Testing and interpreting interactions. Sage
Publications, Inc.
Hinderks, A. (2016). Modifikation des User Experience
Questionnaire (UEQ) zur Verbesserung der Reliabilität
und Validität. https://doi.org/10.13140/RG.2.2.3
1619.50722
Bandura, A. (1997). Self-efficacy: The exercise of control.
W.H. Freeman and Company.
Boothe, C. S., Strawderman, L., Burch, R., Smith, B.,
Bethel, C., & Holmes, K. (2024). Generalized User
Experience Questionnaire (UEQ-G). Journal of User
Experience, 19(2), 75–103.
Bradner, E., & Sauro, J. (2012). Software user experience
and likelihood to recommend: Linking UX and NPS.
UPA International Conference 2012, 1–7.
Breusch, T. S., & Pagan, A. R. (1979). A simple test for
heteroscedasticity and random coefficient variation.
Econometrica, 47(5), 1287. https://doi.org/10.2307/19
11963
Cheng, Y., & Jiang, H. (2020). How do AI-driven chatbots
impact user experience? Examining gratifications,
perceived privacy risk, satisfaction, loyalty, and
continued use. Journal of Broadcasting & Electronic
Media, 64(4), 592–614. https://doi.org/10.1080/08
838151.2020.1834296
Chhatre, R., & Singh, S. (2024). AI And Organizational
Change: Dynamics and Management Strategies.
https://doi.org/10.13140/RG.2.2.16082.98246
Cooper, R. G. (2024). Why AI projects fail: Lessons from
new product development. IEEE Engineering
Management Review, 52(4), 15–21.
https://doi.org/10.1109/EMR.2024.3419268
Davis, F. D. (1989). Perceived usefulness, perceived ease
of use, and user acceptance of information technology.
MIS Quarterly, 13(3), 319. https://doi.org/10.
2307/249008
Delone, W., & McLean, E. (2003). The Delone and
McLean model of information systems success: A ten-
year update. Journal of Management Information
Systems, 19(4), 9–30.
Deutsches Institut für Normung e. V. (2020). Ergonomie
der Mensch-System-Interaktion - Teil 210:
Menschzentrierte Gestaltung interaktiver Systeme (ISO
9241-210). Berlin. Beuth Verlag GmbH.
Linking User Experience and Business Outcomes: How Perceived Usefulness of AI Chatbots Predicts Satisfaction and NPS
509

Ehsan, U., & Riedl, M. O. (2020). Human-centered
explainable AI: Toward a reflective sociotechnical
approach. Proceedings of the 2020 CHI Conference on
Human Factors in Computing Systems, 1–12.
https://doi.org/10.1145/3313831.3376592
Eidloth, L., Meiners, A.‑L., Thomaschewski, J., &
Hinderks, A. (2023). Pragmatic versus hedonic:
Determining the dominant quality in user experience
for professional and leisure collaboration tools. In
Proceedings of the 19
th
international conf. on web
Information Systems and Technologies (pp. 391–398).
SCITEPRESS. https://doi.org/10.5220/001220570000
3584
Faltejsková, O., Dvořáková, L., & Hotovcová, B. (2016).
Net promoter score integration into the enterprise
performance measurement and management system.
E+M Ekonomie a Management, 19(1), 93–107.
https://doi.org/10.15240/tul/001/2016-1-007
Flavián, C., Guinalíu, M., & Gurrea, R. (2006). The role
played by perceived usability, satisfaction and
consumer trust on website loyalty. Information &
Management, 43(1), 1–14.
Fox, J. (2020). Regression diagnostics: An introduction
(Second edition). Quantitative applications in the
social sciences: Vol. 79. SAGE.
Gelman, A., & Stern, H. (2006). The difference between
“significant” and “not significant” is not itself
statistically significant. The American Statistician,
60(4), 328–331. https://doi.org/10.1198/000313006X1
52649
Hassan, M., Kushniruk, A., & Borycki, E. (2024). Barriers
to and facilitators of artificial intelligence adoption in
health care: Scoping review. JMIR Human Factors, 11,
e48633. https://doi.org/10.2196/48633
Kelly, S., Kaye, S.‑A., & Oviedo-Trespalacios, O. (2023).
What factors contribute to the acceptance of artificial
intelligence? A systematic review. Telematics and
Informatics, 77, 101925. https://doi.org/10.1016
/j.tele.2022.101925
Kollmorgen, J., Hinderks, A., & Thomaschewski, J. (2024).
Selecting the appropriate user experience questionnaire
and guidance for interpretation: The UEQ family.
International Journal of Interactive Multimedia and
Artificial Intelligence, (In press), 1. https://doi.org/
10.9781/ijimai.2024.08.005
Kollmorgen, J., Schrepp, M., & Thomaschewski, J. (2023).
Influence of demographic variables and usage
behaviour on the perceived user experience. In M.
Marchiori, F. J. Domínguez Mayo, & J. Filipe (Eds.),
Lecture Notes in Business Information Processing. Web
Information Systems and Technologies (Vol. 494,
pp. 186–208). Springer Nature Switzerland.
https://doi.org/10.1007/978-3-031-43088-6_10
Laugwitz, B., Held, T., & Schrepp, M. (2008).
Construction and evaluation of a user experience
questionnaire. In A. Holzinger (Ed.), Lecture Notes in
Computer Science. HCI and Usability for Education
and Work (Vol. 5298, pp. 63–76). Springer Berlin.
https://doi.org/10.1007/978-3-540-89350-9_6
Lewis, J. R., & Sauro, J. (2021). Usability and user
experience: Design and evaluation. In G. Salvendy &
W. Karwowski (Eds.), Handbook of human factors and
ergonomics (pp. 972–1015). Wiley. https://doi.org/10.
1002/9781119636113.ch38
Liao, Q. V., Vorvoreanu, M., Subramonyam, H., &
Wilcox, L. (2024). Ux matters: The critical role of UX
in responsible AI. Interactions, 31(4), 22–27.
https://doi.org/10.1145/3665504
Meiners, A.‑L., Hinderks, A., & Thomaschewski, J. (2020).
Korrelationen zwischen UX-Fragebögen.
https://doi.org/10.18420/muc2020-ws105-375
Müller, H., & Sedley, A. (2014). Hats: Large-scale in-
product measurement of user attitudes & experiences
with happiness tracking surveys. In T. Leong (Ed.),
Proceedings of the 26
th
australian computer-human
interaction conference on designing futures: The future
of design (pp. 308–315). ACM. https://doi.org/10.
1145/2686612.2686656
O’Brien, R. M. (2007). A caution regarding rules of thumb
for variance inflation factors. Quality & Quantity, 41(5),
673–690.
Owen, R. (2019). Net promoter score and its successful
application. In K. Kompella (Ed.), Management for
Professionals. Marketing Wisdom (pp. 17–29).
Springer Singapore. https://doi.org/10.1007/978-981-
10-7724-1_2
R Core Team. (2024). R: A Language and Environment for
Statistical Computing. R Foundation for Statistical
Computing. https://www.r-project.org/
Raji, I. D., Kumar, I. E., Horowitz, A., & Selbst, A. (2022).
The fallacy of AII functionality. In 2022 ACM Conf. on
fairness accountability and transparency (pp. 959–
972). ACM. https://doi.org/10.1145/3531146.3533158
Reichheld, F. F. (2003). The one number you need to grow.
Harvard Business Review, 81(12), 46-54, 124.
Schrepp, M., Hinderks, A., & Thomaschewski, J. (2017).
Construction of a benchmark for the user experience
questionnaire (UEQ). International Journal of
Interactive Multimedia and Artificial Intelligence, 4(4),
40. https://doi.org/10.9781/ijimai.2017.445
Schrepp, M., & Thomaschewski, J. (2019). Construction
and first Validation of Extension Scales for the User
Experience Questionnaire (UEQ). https://doi.org/
10.13140/RG.2.2.19260.08325
Schrepp, M., & Thomaschewski, J. (2024). Response
instability in user experience questionnaires. Journal of
User Experience, 9–26.
Shin, D. (2021). The effects of explainability and
causability on perception, trust, and acceptance:
Implications for explainable AI. International Journal
of Human-Computer Studies, 146, 102551.
https://doi.org/10.1016/j.ijhcs.2020.102551
Venkatesh, V., Thong, J. Y. L., & Xu, X. (2012). Consumer
acceptance and use of information technology:
Extending the unified theory of acceptance and use of
technology. MIS Quarterly, 36(1), 157–178.
https://doi.org/10.2307/41410412
WEBIST 2025 - 21st International Conference on Web Information Systems and Technologies
510
