
Identifying Innovation Frontiers Based on Prediction of Citation
Network Links Between Papers and Patents
Li Yongjie
a
, Zhu Jian
b
,Wang Longchao
c
and Tang Xiaoli
d
Institute of Medical Information, Chinese Academy of Medical Sciences, Yabao Road No. 3,
Chaoyang District, Beijing, China
Keywords: Graph Neural Network, Innovation Frontiers, Knowledge Flow Clusters, Paper-Patent Citation.
Abstract: This paper proposes a novel method for identifying innovation frontiers based on link prediction in a
heterogeneous citation network integrating academic papers and technological patents. By constructing a
unified citation graph and applying the Graph Sample and Aggregate model, we perform node embedding
learning and link prediction to uncover potential knowledge flow pathways. Combining graph embedding
with clustering analysis, we identify frontier knowledge clusters characterized by high interdisciplinarity,
novelty, and knowledge mobility. Preliminary experiments demonstrate that the proposed method
outperforms existing graph neural network models in both link prediction and clustering tasks, effectively
revealing emerging innovation frontiers at the intersection of scientific and technological knowledge.
1 INTRODUCTION
The concept of the "Innovation Frontier" first emerged
in 2011 within the J-Global foresight project, launched
by the Japan Science and Technology Agency( Mari,
2011). This initiative aimed to identify emerging areas
with potential future technological impact by
clustering highly cited scientific papers that were
frequently referenced by patents. Research indicates
that early-stage, potentially breakthrough discoveries
often originate at the intersection of science and
technology(Winnink & Tijssen, 2015). Although
scholars currently use various terms—such as research
hotspots, research fronts, and innovation fronts —to
describe frontier-related concepts, the prevailing
methodologies for detecting frontiers can be broadly
categorized into citation-based approaches and
content-based analysis methods. In this study, the
innovation frontier is defined as a set of literature
representing the flow of basic scientific knowledge
into technological applications. We identify innovation
frontiers through a combination of paper–patent
citation networks, link prediction techniques, semantic
similarity measures, and a comprehensive indicator
system.
a
https://orcid.org/0009-0004-6306-8288
b
https://orcid.org/0009-0008-8222-0280
c
https://orcid.org/0009-0009-1387-3517
d
https://orcid.org/0000-0001-6946-3482
This study focuses on link prediction tasks within
citation networks and the identification of
innovation frontiers. Link prediction aims to predict
missing or potential future connections between
nodes based on the existing network structure. In
citation networks, this manifests as predicting the
existence of citation relationships between two
documents (papers or patents), that is, determining
whether a paper/patent will cite another in the
future. This task is formulated as a binary
classification problem. Positive samples correspond
to existing citation edges, while negative samples
are generated from pairs of nodes with no current
link. A model is trained to predict the probability of
a citation link forming between any given node pair.
Innovation frontier identification is based on the
citation network to discover new research hotspots
or frontiers of knowledge flow. Specifically, we aim
to identify those document collections (knowledge
flow clusters) that have rapidly grown or formed
new cross-disciplinary knowledge links in recent
years by analyzing the structure and evolution of the
citation network, recognizing them as innovation
frontiers.
398
Yongjie, L., Jian, Z., Longchao, W. and Xiaoli, T.
Identifying Innovation Frontiers Based on Prediction of Citation Network Links Between Papers and Patents.
DOI: 10.5220/0013745700004000
Paper published under CC license (CC BY-NC-ND 4.0)
In Proceedings of the 17th International Joint Conference on Knowledge Discovery, Knowledge Engineering and Knowledge Management (IC3K 2025) - Volume 1: KDIR, pages 398-405
Proceedings Copyright © 2025 by SCITEPRESS – Science and Technology Publications, Lda.
2 METHODS AND STUDY
DESIGN
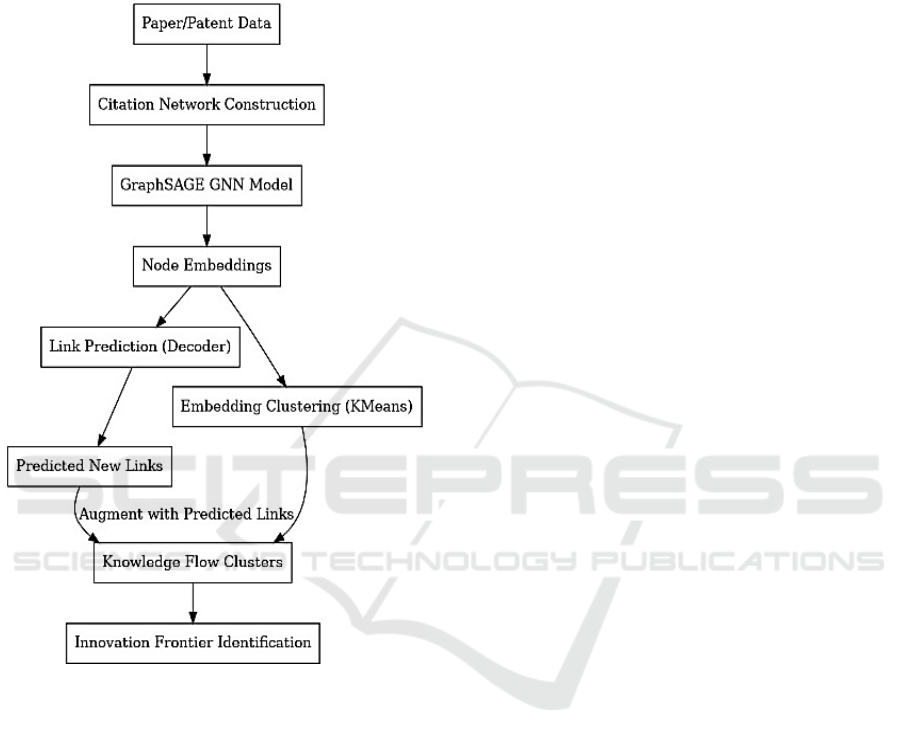
Figure 1 outlines the overall workflow of the
proposed methodology in this study.
Figure 1: Methodological Flow Diagram.
First step is data collection and graph
construction: We organize academic papers and
patent data to build a citation network graph, where
nodes represent papers or patents, and edges denote
citation relationships (Érdi et al., 2013).
Second step is graph neural network-based
embedding learning: the constructed citation graph is
processed using a Graph Sample and Aggregate
(GraphSAGE) model to learn node embeddings.
(Hamilton et al.,2017). Through neighbor sampling
and aggregation operations, low-dimensional
embeddings are generated for each node. The model
is trained using a link prediction task, in which
existing citation links serve as supervisory signals to
update model parameters(Lu & Uddin, 2024). During
training, for each real citation edge, we randomly
sample several non-existent node pairs as negative
samples and optimize the model using the
aforementioned binary classification loss function.
Upon completion of training, the model outputs
embedding vectors for all nodes, which can be used
in downstream tasks.
Thirdly, the methodology proceeds with two
parallel processes: link prediction and node
clustering. For link prediction, the trained model
computes the connection probability for all possible
node pairs, identifying potential but currently non-
existent citation links. These predicted links represent
novel knowledge transfer pathways and are
incorporated into the original network to form an
expanded "potential citation network." Concurrently,
node embeddings are clustered using the K-Means
algorithm to partition the network into thematic
knowledge communities. Each resulting cluster
represents a distinct knowledge domain, revealing the
underlying structure of the citation network.(Chai et
al., 2024).
Fourthly, after integrating the predicted links into
the network and obtaining the clustering partition, we
conduct a comprehensive analysis of cluster attributes
to identify innovation frontiers. By quantifying and
ranking clusters based on multiple indicators, we
select the top-scoring clusters as innovation frontier
hotspots. The corresponding sets of documents
represent recently emerged and rapidly evolving
research directions within their respective fields.
In summary, our approach integrates graph neural
network-based link prediction with clustering
analysis: graph neural network (GNN) embedding
learning captures complex relationships within the
citation network and predicts potential knowledge
links, while clustering uncovers knowledge flow
communities. Ultimately, multi-indicator evaluation
identifies the most probable innovation frontier areas.
This method leverages citation data to reveal micro-
level connections in knowledge diffusion while
extracting macro-level research hotspots at the
domain level—aligning well with the requirements of
knowledge discovery and information retrieval in
citation network analysis. Each module is closely
interconnected, ensuring the scientific rigor and
effectiveness of the proposed framework.
2.1 Data Representation and Graph
Construction Methodology
We first construct a citation graph that incorporates
both academic papers and patents. The node set of the
graph consists of two types of entities: scholarly
papers and patents, which are uniformly represented
as nodes (entities) within the graph structure. Each
Identifying Innovation Frontiers Based on Prediction of Citation Network Links Between Papers and Patents
399

node can be assigned an initial feature vector based
on various attributes such as textual embeddings
derived from titles and abstracts, disciplinary
categories, author or institutional affiliations, and
other relevant metadata. These features serve as input
attributes for the model.
The edge set represents citation relationships: a
directed edge is created from one node (the citing
entity) to another node (the cited entity) if a paper or
patent references another paper or patent. After data
preprocessing and integration, we obtain a
heterogeneous citation network denoted as G =
(V,E), where V is the set of nodes representing
either papers or patents, and E is the set of directed
citation edges capturing the citation relations between
them.
To address structural fragmentation in the citation
network, we introduce a semantic bridging
mechanism that integrates direct citation
relationships with indirect connections derived from
semantic similarity. Isolated nodes—defined as
papers or patents with no existing citation links to
other documents—are connected through
semantically inferred paths. For each isolated paper,
we compute text embeddings (e.g., using RoBERTa)
of its title and abstract and identify semantically
similar papers (cosine similarity > 0.7). If these
similar papers cite patents, we construct an indirect
citation path: isolated paper → similar paper →
patent. Similarly, for isolated patents, we link them to
papers via semantically related patents: paper →
similar patent ← isolated patent.
The original direct citations and inferred semantic
edges are merged into a unified directed graph. This
hybrid network enhances connectivity, improves
coverage of knowledge diffusion pathways, and
captures latent associations across documents. The
resulting graph serves as a robust foundation for
subsequent graph neural network training, enabling
joint learning of explicit citations and implicit
semantic relationships. All nodes are treated
uniformly, preserving the directed flow of knowledge
from cited to citing entities.
2.2 Graph Neural Network-Based Link
Prediction Model
To learn low-dimensional representations of nodes in
the citation network, we employ GNN model for link
prediction. Specifically, we implement the
GraphSAGE framework, which generates node
embeddings by iteratively aggregating feature
information from local neighborhoods. This approach
effectively captures both structural properties and
semantic attributes of nodes through learned
representations.
The proposed model consists of two GraphSAGE
convolutional layers (SAGEConv). The aggregation
process at layer l can be formally described as follows.
Neighbor Aggregation: For a given node v, at the
l -th layer, the model collects the node representations
from its neighbor set N(v) at the previous layer and
computes their average. This averaging operation
aggregates local neighborhood information to enrich
the representation of the target node.
𝑚
()
=
1
|𝑁(𝑣)|
ℎ
()
∈()
(1
)
where ℎ
()
denotes the embedding of neighbor
node u at layer l =1 (when l =1 , h
corresponds to
the initial feature vector of node u).
Node Representation Update: The node's own
representation from the previous layer, ℎ
()
, is
concatenated with the aggregated neighbor vector
m
()
. This combined vector is then passed through a
linear transformation and a non-linear activation
function to obtain the node’s new embedding at the l-
th layer. where W
()
denotes the learnable weight
matrix at layer l , and σ is a non-linear activation
function (e.g., ReLU). After two layers of message
propagation, we obtain the final d -dimensional
embedding vector for each node, ℎ
= ℎ
()
, which
encapsulates both the node’s own feature attributes
and the local structural information from its citation
neighborhood in the graph.
ℎ
()
=𝜎
𝑊
()
∙ [ℎ
()
∥ 𝑚
()
]
(2
)
Link Decoding and Prediction: Based on the
learned node embeddings, we design a decoding
function to predict the likelihood of a citation link
forming between any pair of nodes. To maintain
model simplicity while preserving effectiveness, we
adopt the inner product as the decoder. Specifically,
for a pair of nodes𝑢and 𝑣 , the dot product of their
embedding vectors is computed and passed through
the sigmoid function to yield the predicted probability
of an edge existing between them.
𝑦
=𝜎(ℎ
∙ ℎ
)
(3
)
whereh
∙ h
denotes the dot product between the
embedding vectors of nodes
𝑢and 𝑣 The dot product
decoder intuitively measures the similarity between
two nodes in the embedding space, where a higher
similarity score suggests a greater likelihood of an
existing citation link. Compared to more complex
decoders—such as multi-layer perceptrons (MLPs)
KDIR 2025 - 17th International Conference on Knowledge Discovery and Information Retrieval
400

that take the concatenated embeddings h
and h
as
input—the dot product decoder offers advantages in
terms of fewer parameters, easier training, and
competitive performance in citation link prediction
tasks.
Training Strategy and Loss Function: We
formulate the link prediction task as a binary
classification problem and train the GNN model
parameters through supervised learning. In this setting,
positive samples correspond to existing citation edges
in the network, while negative samples are randomly
sampled from node pairs that do not have a citation
relationship. To maintain class balance and improve
training efficiency, we typically sample negative edges
at a certain ratio (e.g., 1:1) so that their number is
comparable to that of positive edges.Prior to training,
the set of existing citation edges is randomly split into
training, validation, and test sets (e.g., each occupying
a predefined proportion), ensuring that the model is
evaluated on unseen samples during performance
assessment.The model is trained using the binary
cross-entropy (BCE) loss , which optimizes the
predicted link probabilities. For any node
pair (𝑢,𝑣)with a ground truth label 𝑦
(where 1
indicates the presence of a link and 0 indicates absence),
and an unnormalized score 𝑠
= h
∙ h
output by the
model, the corresponding loss is computed as:
𝐿
= −𝑦
log𝜎
(
𝑠
)
−
(
1 − 𝑦
)
log1 −𝜎
(
𝑠
)
(4)
The overall loss 𝐿 is obtained by averaging over all
positive and negative samples in the training set. This
loss is then minimized using stochastic gradient
descent (SGD) to learn the model parameters. During
training, we employ the AdamW optimizer, which
incorporates weight decay to prevent overfitting, and
iteratively update the model parameters based on mini-
batches.Model selection is guided by performance
evaluation on the validation set, typically measured
using metrics such as Area Under the Curve (AUC).
The model checkpoint achieving the best validation
performance is selected as the final trained model.
Through this training process, the GraphSAGE
model learns a function that maps the structure of the
citation network and node attributes into low-
dimensional embeddings. Once trained, the model
can be generalized to new graphs containing
previously unseen nodes, thanks to its inductive
neighbor aggregation mechanism.
2.3 Clustering Ensemble Method
After obtaining the node embedding representations
from the citation network, we further perform
clustering analysis in the embedding space to identify
knowledge flow communities and detect potential
innovation frontier hotspots. Specifically, we employ
the K-Means clustering algorithm for unsupervised
grouping of node embeddings.
K-Means partitions the set of n node vectors into
n clusters 𝑆 = 𝑆
,𝑆
,⋯,𝑆
, iteratively optimizing
the assignment such that nodes within the same
cluster are as similar as possible, while nodes in
different clusters are as dissimilar as possible.
The objective function of K-Means aims to
minimize the within-cluster sum of squared distances
(WCSS) — that is, the sum of squared distances
between each node embedding and its assigned
cluster centroid:
arg min
{
}
∥ ℎ
− 𝜇
∥
∈
(5
)
𝜇
=
1
𝑆
ℎ
∈
(6
)
where 𝜇
denotes the mean vector of node
embeddings in the 𝑖-th cluster, also referred to as the
cluster centroid. Through this optimization process,
K-Means groups nodes with similar embeddings into
the same cluster, ensuring that nodes within a cluster
are relatively close to each other in the embedding
space—indicating shared citation patterns or thematic
characteristics—while nodes in different clusters
exhibit substantial separation, reflecting distinct
structural or topical features.
Based on the clustering results, each cluster is
regarded as a knowledge flow community,
comprising a group of academically or
technologically related papers and patents connected
through dense citation relationships. These clusters
typically correspond to specific research domains or
thematic topics, within which knowledge circulates
intensively. The GraphSAGE embeddings capture
both semantic and topological similarities, revealing
that documents within the same cluster often exhibit
co-citation patterns, shared keywords, or structural
proximity in the citation network.
Furthermore, inter-cluster citation edges represent
knowledge diffusion across different domains. The
presence of multiple citations between two clusters
suggests notable interdisciplinary exchange or
convergent innovation, often indicative of emerging
research intersections or technology fusion.
2.4 Evaluation Metric Design for
Emerging Research Fronts
In the approach to identifying innovation frontiers,
Identifying Innovation Frontiers Based on Prediction of Citation Network Links Between Papers and Patents
401

we design a set of evaluation indicators tailored to
paper clusters, patent clusters, and science-
technology interaction clusters, aiming to capture
their distinct characteristics associated with being at
the "innovation frontier". The indicator system
includes measures such as Interdisciplinarity,
Novelty, and Industry Knowledge Mobility (IKM).
These indicators are then synthesized into a
comprehensive Innovation Frontier Index using a
weighted aggregation method. The key indicators are
described as follows.
2.4.1 Interdisciplinarity
The interdisciplinarity of a paper cluster is used to
measure the diversity and cross-disciplinary nature of
knowledge sources within the cluster. The Rao-
Stirling index, a diversity metric proposed by Stirling,
is employed to quantify this interdisciplinarity.
The interdisciplinarity of patents is an important
indicator that measures the extent to which patent
technologies integrate across different technical
domains. It quantifies the breadth of technological
convergence by analyzing the distribution of
International Patent Classification (IPC) codes of the
patent itself and its cited patents. This metric reflects
the capability of a patent to integrate knowledge from
multiple disciplinary fields, serving as an essential
proxy for technological diversification and cross-
domain innovation.
2.4.2 Novelty
Novelty is used to measure the degree of innovation
in terms of time and content within a research cluster.
In this study, we adopt Science Cycle Time as a
representative indicator of novelty. The Science
Cycle Time is defined as the average difference
between the publication year of a paper and the
publication years of its cited references. This metric
characterizes the temporal span over which
knowledge is generated and subsequently utilized in
current research.
In the context of patents, a corresponding
measure—Technology Cycle Time —is employed. It
is defined as the average difference between the filing
year of a patent and the publication years of its cited
prior art (e.g., other patents or scientific literature).
This metric serves to assess the degree of novelty in
technological innovation, with shorter cycle times
typically indicating more recent and potentially
groundbreaking advancements.
2.4.3 Knowledge Mobility
Academic Knowledge Mobility (AKM) is an
indicator used to measure the intensity of knowledge
transfer from academic research to industrial
technologies. It is defined as the average number of
patent citations received by each paper within a given
paper cluster. Specifically, if the research findings in
a particular cluster are frequently cited by patents, this
indicates that the scientific knowledge embodied in
the cluster has a high degree of spillover value and
significant influence on technological development.
This reflects relatively active knowledge flow
between academia and industry, suggesting strong
science-technology linkages and potential for
application-driven innovation.
Technology Knowledge Mobility (TKM) is an
indicator used to measure the extent to which patent
technologies rely on scientific knowledge. It is
defined as the average number of academic papers
cited per patent within a given patent cluster. If a
patent cluster cites a large number of scholarly
articles, it indicates that the technological
development within that cluster is closely linked to
scientific advancements and possesses a strong
scientific foundation.
2.4.4 Innovation Frontier Index
Based on the aforementioned definitions, each paper
is assigned values for the three indicators described
above. These indicators are then weighted using the
entropy weight method , a objective weighting
approach that determines the relative importance of
each indicator based on the amount of useful
information it provides. As a result, each paper
receives a composite Innovation Frontier Index score
that reflects its overall innovativeness and position at
the frontier of scientific development.
The same procedure is applied to calculate the
Innovation Frontier Index for each patent, enabling a
comparable assessment of technological innovations
in terms of their novelty, interdisciplinarity, and
knowledge mobility.
2.4.5 Weighted Aggregation Method for
Cluster-Level Innovation Frontier
Index
After computing the document-level metrics for each
paper or patent—including interdisciplinarity,
novelty, knowledge mobility, and the composite
Innovation Frontier Index —it is necessary to further
aggregate the indicator information across all nodes
within each cluster. This aggregation aims to
KDIR 2025 - 17th International Conference on Knowledge Discovery and Information Retrieval
402

characterize the collective innovative features of the
entire cluster across multiple dimensions.
Considering that nodes may differ in their
structural positions and representativeness within a
cluster, this study introduces an embedding-distance-
based weighting mechanism to linearly aggregate the
individual indicators, thereby constructing a unified
cluster-level indicator system .
To quantify the representativeness of each node
within its cluster, we compute the Euclidean distance
between the node’s embedding—generated by the
graph neural network—and the centroid of its
corresponding cluster in the embedding space. A
smaller distance indicates that the node is closer to the
semantic center of the cluster, implying higher
representativeness and centrality within the
knowledge community.
3 EXPERIMENTAL
FRAMEWORK
To comprehensively evaluate the effectiveness of the
proposed integrated graph construction mechanism
and the graph neural network-based approach for
identifying innovation frontiers, we conducted
systematic experimental studies on the constructed
academic paper–technical patent integrated citation
network.
3.1 Dataset Overview
The dataset for this study comprises 91,360
academic papers and 92,337 technical patents,
constituting a heterogeneous citation network with
183,697 nodes. The paper data is sourced from the
Web of Science Core Collection, while the patent
data is drawn from the USPTO and EPO databases.
The dataset spans the years 2010 to 2023 and
primarily covers various disciplines, including
biomedicine.During the data preprocessing phase,
we extracted the titles, abstracts, publication years,
and citation relationships of academic papers, as
well as the titles, abstracts, application years, and
citation information of patents. For isolated nodes in
the network, we employed an indirect citation
inference mechanism that combines semantic and
citation relationships to construct new connections
for these nodes, effectively enhancing network
connectivity. The training, validation, and test sets
were randomly split in a ratio of 7:1:2.
Based on the GraphSAGE framework, a three-
layer graph neural network model is constructed. The
embedding dimension is set to 512 dimensions to
fully capture the semantic and structural information
within the network, while the hidden layer size is set
to 128 dimensions to balance the model's expressive
power and computational efficiency. The network is
configured with three layers, effectively aggregating
information from three-hop neighbors. The number of
sampled neighbors per layer is 25, 20, and 15 nodes,
respectively. In terms of activation functions, the
hidden layer employs the ReLU function, while the
output layer utilizes the Sigmoid function. To
enhance the model's generalization capability,
Dropout regularization is added after each layer, with
a dropout rate set to 0.3.
The model training adopts a supervised learning
paradigm, modeling link prediction as a binary
classification task. The optimizer uses AdamW to
provide better convergence stability, with a learning
rate set at 1×10
-4
to ensure stable training for large-
scale networks. The loss function employs Mean
Squared Error Loss (MSELoss) to provide a smooth
gradient signal. The training is set to 1000 epochs,
and an early stopping strategy (patience=50) is
adopted to prevent overfitting. The batch size is set to
2048 node pairs, and weight decay is set at 1×10
-5
for
L2 regularization. The learning rate schedule employs
the ReduceLROnPlateau strategy, reducing the
learning rate to 80% of its original value when the
validation set AUC fails to improve for 10
consecutive epochs. The negative sampling strategy
samples one negative edge for every positive edge,
maintaining node type matching to avoid sampling
bias.
3.2 Comparative Analysis of Link
Prediction Performance
Initially, we compared the performance of the
proposed model with various graph models in the task
of link prediction. The experiments selected classic
graph neural network models and attention models for
comparison, including Graph Convolutional
Networks (GCN), GraphSAGE, Graph Attention
Networks (GAT), Graph Embedding Network
(GEN), graph network models based on Transformer,
and Graph Neural Network for Tag Ranking
(GraphTR), totaling six models. Evaluation metrics
such as AUC, F1, Precision, Recall, and Accuracy
were employed to assess the accuracy of link
prediction, as presented in Table 1 below.
Identifying Innovation Frontiers Based on Prediction of Citation Network Links Between Papers and Patents
403

Table 1: Metrics for Link Prediction.
Model AUC F1
Precisi
on
Reca
ll
Accu
rac
y
GCN 0.7467 0.7466 0.7473
0.74
67
0.74
67
GAT 0.7206 0.7193 0.7246
0.72
06
0.72
06
GEN 0.7484 0.7469 0.7541
0.74
84
0.74
84
Transf
orme
r
0.7663 0.7657 0.7691
0.76
63
0.76
63
Graph
TR
0.7108 0.7088 0.7168
0.71
08
0.71
08
Graph
SAGE
0.7729 0.7726 0.7742
0.77
29
0.77
29
In this context, our method has achieved optimal
performance across various indicators. As shown in
Table 1, our approach, GraphSAGE, achieves an
AUC of 0.7729, representing an improvement of
approximately 3 percentage points compared to GCN.
Precision and Recall have been increased to
approximately 77.4% and 77.3%, respectively, which
are the highest among all models. Similarly, the
Accuracy rate has reached 77.29%, indicating that the
model is more accurate in discriminating citation
connections. Additionally, to evaluate the model's
performance in link ranking, we also employed the
Mean Reciprocal Ranking (MRR) @10, Mean
Average Precision (MAP)@10, and Precision@10
recommendation metrics to assess the model's ability
in predicting the most relevant links, as demonstrated
in Table 2 below.
Table 2: Top-N Recommendation Metrics.
Model
MRR
@10
MAP@1
0
Precision@1
0
GCN 0.7653 0.6913 0.6875
GAT 0.4941 0.625 0.6174
GEN 0.6158 0.6468 0.6411
Transforme
r
0.4379 0.6831 0.6755
Gra
p
hTR 0.2318 0.5947 0.5871
GraphSAGE 0.8569 0.7361 0.7266
The experimental results indicate that, for Top-N
recommendation metrics, our approach achieves the
highest scores in metrics such as MRR@10 and
MAP@10 (e.g., MRR@10 is approximately 0.857,
and Precision@10 is close to 0.73), demonstrating a
significantly superior ability to rank potentially
relevant links compared to other models. This implies
that our method not only uncovers more genuinely
existing hidden citation relationships but also
prioritizes the most meaningful potential links,
resulting in higher coverage and accuracy. Overall,
the proposed integrated model achieves
comprehensive leading performance in link
prediction tasks, effectively validating the feasibility
and superiority of the citation semantic completion +
GNN embedding strategy, as well as the effectiveness
of integrating academic and patent information with
graph neural network methods in identifying
innovative frontier associations.
3.3 Comparative Analysis of Model
Clustering Results
After obtaining the embedded representations of
nodes (papers or patents), we employed the K-Means
algorithm to cluster nodes within the fused citation
network, aiming to identify potential clusters of
cutting-edge knowledge. To evaluate the
effectiveness of embeddings generated by different
graph neural networks in clustering tasks, we applied
K-Means to node representations outputted by six
mainstream graph models (GCN, GAT, GEN,
Transformer, GraphTR, GraphSAGE) and utilized
the Silhouette Score and Calinski-Harabasz Index
(CH Index) as metrics for assessing clustering
performance. The Silhouette Score measures the
compactness and separability of clusters, with a value
closer to 1 indicating better clustering performance;
the CH Index reflects the ratio of inter-cluster
dispersion to within-cluster dispersion, with a higher
value indicating a clearer clustering structure. The
comparative results of clustering performance across
models are presented in Table 3 below.
Table 3: Model clustering performance.
Model
Silhouette
Score
CH Index
GCN -0.0064 321.2708
GAT -0.0168 145.5318
GEN 0.0016 89.0565
Transforme
r
0.0069 103.9587
GraphTR 0.1052 5049.5271
Gra
p
hSAGE 0.0214 109.5832
Among the evaluated models, GraphSAGE
demonstrated superior overall performance for our
link prediction and clustering tasks despite its lower
CH Index compared to GraphTR. With a Silhouette
Score of 0.0214 and CH Index of 109.5832, it
consistently outperformed GCN, GAT, GEN, and
Transformer-based models. This indicates
GraphSAGE’s stronger capacity for preserving both
local similarities and global separability in the
embedding space, thereby providing more stable and
cluster-friendly representations for subsequent K-
Means partitioning.
KDIR 2025 - 17th International Conference on Knowledge Discovery and Information Retrieval
404

In contrast, GCN and GAT produced negative
Silhouette Scores (-0.0064 and -0.0168, respectively),
suggesting significant cluster overlap and poor
separation in their embedding spaces. While GEN
and Transformer achieved positive Silhouette Scores,
their values remained below 0.01, reflecting limited
representation quality and clustering utility. Although
GraphTR showed strength in clustering metrics, its
high computational complexity, substantial training
cost, and relatively weak performance in link
prediction reduced its overall suitability for the
integrated task.
Therefore, we selected GraphSAGE as the
embedding model for its balanced performance in
structural representation and computational
efficiency. Combined with K-Means clustering, it
enables effective and interpretable detection of
innovation frontiers with higher clustering
consistency and semantic coherence.
4 CONCLUSIONS
This paper primarily revolves around two core tasks:
the first is link prediction based on citation networks,
aimed at uncovering potential knowledge
associations; the second is clustering analysis based
on graph embedding, to identify cutting-edge hotspot
clusters across different knowledge domains.
Our proposed GraphSAGE-based approach
demonstrates superior performance in both link
prediction (AUC = 0.7729) and clustering tasks
(Silhouette Score = 0.0214) compared to baseline
models like GCN and GAT. The semantic bridging
mechanism for isolated nodes proved particularly
effective in enhancing network connectivity, as
evidenced by the improvement in prediction accuracy
over conventional methods. The integration of
indirect citation paths through semantic similarity
thresholds addresses a critical limitation in traditional
citation analysis where structural fragmentation often
obscures potential knowledge flows.Our multi-
indicator evaluation system (incorporating
Interdisciplinarity, Novelty, and Knowledge Mobility
metrics) provides a more nuanced understanding of
innovation dynamics than conventional citation-
based approaches.
The experimental results fully validated the
effectiveness and advantages of this method in
integrating structural sparse networks, enhancing
recognition accuracy, and mining potential cross-
knowledge flows.
ACKNOWLEDGEMENTS
This work was supported by the Innovation Fund for
Medical Sciences of the Chinese Academy of
Medical Sciences (grant 2021-I2M-1-033).
REFERENCES
Chai, B., Li, Z., & Zhao, X. (2024). Deep graph clustering
by integrating community structure with neighborhood
information. Information Sciences, 678, 120951.
Érdi, P., Makovi, K., Somogyvári, Z., Strandburg, K.,
Tobochnik, J., Volf, P., & Zalányi, L. (2013).
Prediction of emerging technologies based on analysis
of the US patent citation network. Scientometrics,
95(1), 225-242.
Hamilton, W. L., Ying, R., & Leskovec, J. (2017).
Inductive Representation Learning on Large Graphs
(Version 4). arXiv. https://doi.org/10.48550/ARXIV.
1706.02216
Lu, H., & Uddin, S. (2024). A parameterised model for link
prediction using node centrality and similarity measure
based on graph embedding. Neurocomputing, 593,
127820.
Mari, J. (2011). An analysis of the achievements of JST
operations through Scientific Patenting: Linkage
between patents and scientific papers. Paper presented
at the 2011 Atlanta Conference on Science and
Innovation Policy.
Winnink, J. J., & Tijssen, R. J. W. (2015). Early stage
identification of breakthroughs at the interface of
science and technology: lessons drawn from a landmark
publication. Scientometrics, 102(1), 113-134.
Identifying Innovation Frontiers Based on Prediction of Citation Network Links Between Papers and Patents
405
