
From Detection to Diagnosis: A Layered Hybrid Framework for
Anomaly Characterization in Maritime Sensor Streams
Nadeem Iftikhar
1 a
, Cosmin-Stefan Raita
1
, Aziz Kadem
1
, David Buncek
1
, Matthew Haze Trinh
2
,
Yi-Chen Lin
2
, Anders Vestergaard
1
and Gianna Belle
1 b
1
University College of Northern Denmark, Sofiendalsvej 60, 9000 Aalborg, Denmark
2
Frugal Technologies ApS, C.A. Olesens Gade 4, 9000 Aalborg, Denmark
Keywords:
Anomaly Detection, Anomaly Characterization, Maritime IoT, Hybrid Models, Time-Series Analysis.
Abstract:
Effective knowledge discovery from industrial sensor data depends on a deep understanding of data quality
issues. In the maritime domain, sensor streams often suffer from a diverse set of problems, from simple
signal freezes to complex, context-dependent behavioral shifts. Merely detecting these events as a monolithic
“anomaly” class provides limited actionable insight. This paper argues for a shift from anomaly detection to
anomaly characterization. We propose a novel, layered hybrid framework that systematically identifies and
classifies data issues into distinct types. Our pipeline effectively combines the reliability of statistical methods
with the advanced pattern-finding ability of machine/deep learning. Each layer acts as a specialized filter that
identifies a specific type of anomaly and cleans the data for the next, more advanced analysis. We demonstrate
on real-world vessel data that this layered characterization not only achieves high detection accuracy but, more
importantly, transforms raw detection flags into actionable knowledge for operational decision-making.
1 INTRODUCTION
Modern ships rely on constant streams of data. This
information is crucial, as it supports onboard safety
systems, improves fuel efficiency, and informs main-
tenance planning. Challenging conditions at sea lead
to diverse data quality issues that require distinct han-
dling strategies. Examples of these issues include a
sensor signal output that may remain fixed and does
not update over time; a sudden spike in the signal;
two sensors which are expected to be correlated, such
as shaft power and fuel consumption, that no longer
are aligned; multiple sensors that show unusual be-
havior at once. If we simply label all these issues
as “anomalies”, we lose crucial details, and it be-
comes impossible to diagnose the root causes cor-
rectly. This paper focuses on characterizing anoma-
lies instead of just detecting them. The work intro-
duces a layered system that automatically detects and
classifies the data issues into distinct and well-defined
types. The pipeline uses robust statistics to flag basic
outliers and machine/deep learning to find the more
complex faults. By assigning a specific category to
a
https://orcid.org/0000-0003-4872-8546
b
https://orcid.org/0000-0001-6503-6715
each issue, the framework delivers actionable knowl-
edge. For example, a FROZEN SIGNAL is when a
sensor’s output remains constant for a longer period
of time. This type of issue tells IT teams to check
data loggers and/or network connections. A CORRE-
LATION FAULT occurs when sensors that are cor-
related, i.e. their outputs consistently vary together,
no longer exhibit this correlation. This type of issue
suggests performing a maintenance check on a spe-
cific component. A STATISTICAL OUTLIER is just
a quick spike/dip in a sensor reading that does not
match the recent data trend. This type of issue can
be safely ignored in long-term performance reports.
Finally, a COMPLEX ANOMALY occurs when one
or more sensors behave unusually. It can represent a
valid but rare event, such as a ship’s behavior in a sud-
den storm. This type of issue is typically forwarded to
a domain expert for review. By linking each data issue
to a corresponding action, the framework goes beyond
simple detection and supports a deeper understanding
of root causes, enabling more effective responses.
The paper is structured as follows. Section 2 re-
views related work. Section 3 describes the proposed
framework. Section 4 presents the experimental eval-
uation. Section 5 discusses the implications of the
findings, and Section 6 concludes the paper.
380
Iftikhar, N., Raita, C.-S., Kadem, A., Buncek, D., Trinh, M. H., Lin, Y.-C., Vestergaard, A. and Belle, G.
From Detection to Diagnosis: A Layered Hybrid Framework for Anomaly Characterization in Maritime Sensor Streams.
DOI: 10.5220/0013741100004000
Paper published under CC license (CC BY-NC-ND 4.0)
In Proceedings of the 17th International Joint Conference on Knowledge Discovery, Knowledge Engineering and Knowledge Management (IC3K 2025) - Volume 1: KDIR, pages 380-387
Proceedings Copyright © 2025 by SCITEPRESS – Science and Technology Publications, Lda.

2 RELATED WORK
Finding anomalies in time-series data is a well-
researched topic; however, its application in the
maritime domain presents unique challenges that
continue to engage researchers. Early reviews by
(Obradovi
´
c et al., 2014; Riveiro et al., 2018) laid
out the main issues: maritime data is often messy,
highly context-dependent, and difficult to interpret.
Our work builds on recent efforts to address these
challenges by improving data quality, incorporating
contextual awareness, and ensuring that outputs are
interpretable to domain experts. Choosing the most
suitable anomaly detection technique still remains a
significant challenge. Studies by (Schmidl et al.,
2022; Wenig et al., 2022; Iftikhar et al., 2022; Iftikhar
and Nordbjerg, 2024) have shown that no single algo-
rithm is the best for every situation. This is why re-
searchers are now building more specialized and hy-
brid systems. Our work follows this path: we are not
proposing a single new model, but rather a structured
pipeline where each layer is specialized for a spe-
cific task. Machine/deep learning is a common choice
for finding anomalies today. Models like Trans-
formers are good at identifying long-term patterns
in time-series data (Wen et al., 2023). Other kinds
of deep learning networks, built for handling sensor
data streams, have been used to find outliers in ves-
sel tracking data (Maganaris et al., 2024). The main
issue with these advanced models is that they need
lots of labeled data for training, and that’s usually not
available. Some researchers address this limitation by
creating fake “synthetic” outliers to train their mod-
els (Kim and Joe, 2024). These models may work,
yet they often behave like “black boxes”—detecting
anomalies without explaining their origin. Our frame-
work is designed to fill this gap, instead of just a
generic “anomaly” alert, our system clearly identi-
fies and labels the type of anomaly present in the
data. Moreover, some recent works confirm that it
is a good approach to combine different techniques
into hybrid models, especially when combining statis-
tics with machine learning (Bl
´
azquez-Garc
´
ıa et al.,
2021; Iftikhar et al., 2020). In the maritime world,
for instance, one recent project used autoencoders and
principle component analysis (PCA) to find outliers
based on data correlations (Gupta et al., 2024), which
is similar to some parts of our own framework. An-
other study found that for vessels, what is considered
“normal” behavior can change entirely depending on
factors like the weather (Rybicki et al., 2024). Our
work builds on these ideas. Our system can also be
context-aware by analyzing data based on the vessel’s
operating state (steadily, accelerating, decelerating).
Lately, the research field has started to move from
just detecting anomalies to explaining them. As (Pang
et al., 2021) noted in a survey, people want models
that can interpret their own findings. Most systems
try to explain the output of machine learning mod-
els using methods like SHapley Additive exPlanations
(SHAP). The proposed framework is distinct in that
it emphasizes characterization from the start. When
the pipeline produces a label like FROZEN SIGNAL or
CORRELATION FAULT, the label itself provides the ex-
planation. This makes the output immediately useful
for operators and addresses a major need for under-
standable AI in the maritime sector.
3 PROPOSED FRAMEWORK
3.1 Layered Hybrid Architecture
The proposed framework for detecting and character-
izing anomalies consists of a layered hybrid pipeline.
Its design is based on two core principles: efficiency
and specificity.
• Efficiency: Computationally cheap methods are
used first to filter out the most obvious data qual-
ity issues. This prevents “noise” from spreading
to the more complex, resource-intensive ML mod-
els. As illustrated in Figure 1, the pipeline acts as
an anomaly detection process, where each layer
adds its own flag or tag to the data stream.
• Specificity: Each layer is a specialist designed to
identify a distinct type of anomaly. After all layers
have added their temporary flags, a final hierarchi-
cal logic (detailed in Algorithm 5) combines these
flags into a single, clear finding. This is an impor-
tant difference from using one large model, which
would just flag any abnormality as an anomaly.
3.2 Frozen Data Detection
A common problem with sensor data is that it can get
“stuck.” A sensor might report the exact same value
over and over, which is unlikely during active ship op-
erations. We call this “frozen data”. It is often a sign
that something is wrong with the data logger, the net-
work connection, or the sensor itself. A rule-based ap-
proach is used to find these stuck sensors. The method
applies a “rolling window” across the data, looking at
a few readings at a time. If it identifies a value that
has not changed for n readings in a row, it flags that
point. Take the shaft’s RPM, for example. It should
naturally vary during a voyage. If the system detects
it is stuck at exactly 80 RPM for several minutes, it
From Detection to Diagnosis: A Layered Hybrid Framework for Anomaly Characterization in Maritime Sensor Streams
381

Figure 1: Layered pipeline: from raw data to detection of
diverse anomaly types.
flags this as a frozen signal. Detecting this data issue
early is crucial. It prevents the more advanced mod-
els from interpreting these constant values as normal
behavior, which would mislead their analysis.
Input : Dataset D with N rows and M
columns
Output: Dataset D
′
with is frozen flag and
list of frozen sensors per row
Initialize is frozen ← False for all rows in
D;
Initialize frozen sensors ← None for all
rows in D;
Define list of sensor columns S ⊆ {1, . . ., M};
foreach sensor column c ∈ S do
for i ← 6 to N do
if d
i,c
= d
i−1,c
= ·· · = d
i−5,c
then
Mark is frozen[i] as True;
Append c to frozen sensors[i];
end
end
end
return D
′
with added is frozen flag and
frozen sensors columns;
Algorithm 1: Detection of Frozen Sensor Values.
Algorithm 1 describes the method for detecting
frozen values by comparing d
i,c
with the five preced-
ing entries d
i−1,c
, d
i−2,c
, . . . , d
i−5,c
. It starts from row
index i = 6 to ensure a full history window of size five
is available for comparison. The process is repeated
independently for each sensor c ∈ S. If the condition
is satisfied, the row i is marked as frozen by setting
is frozen[i] to True, and the corresponding sensor
index c is recorded in frozen sensors[i]. This anno-
tation improves traceability and simplifies diagnosis
of frozen signal problems in the dataset.
3.3 Correlation-Based Fault Detection
On a vessel, some sensors are interdependent, leading
to correlations in their readings. For example, shaft
RPM and power often increase or decrease simultane-
ously. Not all sensor faults produce obvious outliers;
sometimes, a fault just breaks the known relationship
between correlated sensors.
Input : Sensor matrix X ∈ R
T ×D
, encoding
dimension d ∈ N, correlation
threshold τ ∈ (0, 1), and error
quantile q ∈ (0, 1)
Output: Fault label vector f ∈ {0, 1}
T
indicating correlation faults per row
Impute missing values in X using column
means;
Standardize X column-wise to have zero
mean and unit variance;
Train autoencoder A : R
D
→ R
D
using
encoding dimension d;
Obtain reconstruction
ˆ
X ← A(X );
Compute correlation matrix C ∈ [−1, 1]
D×D
from standardized X;
Define correlated pairs
P ← {(i, j) | |C
i j
| ≥ τ, i < j};
Initialize fault label vector f
t
← 0 for all
t = 1, . . . , T ;
foreach (i, j) ∈ P do
Define X
(i, j)
t
← [X
t,i
, X
t, j
], and
ˆ
X
(i, j)
t
← [
ˆ
X
t,i
,
ˆ
X
t, j
];
Compute pairwise error
e
(i, j)
t
= ∥X
(i, j)
t
−
ˆ
X
(i, j)
t
∥
2
2
, for
t = 1, . . . , T ;
Define threshold
θ
i, j
← q-quantile of {e
(i, j)
t
}
T
t=1
;
for t = 1 to T do
if e
(i, j)
t
> θ
i, j
then
f
t
← 1;
end
end
end
return f
Algorithm 2: Row-wise Correlation-Based Fault Label-
ing.
The correlation-aware approach targets these spe-
cific failures, including drift, bias, or other malfunc-
tions. The method works by first training an autoen-
coder on the full sensor matrix, letting it learn the sys-
tem’s typical collective behavior. It then finds which
sensor pairs are highly correlated in the data. For
these pairs, it identifies if their reconstructed behav-
KDIR 2025 - 17th International Conference on Knowledge Discovery and Information Retrieval
382

ior deviates from the learned norm. A large devia-
tion, seen as a high pairwise reconstruction error, in-
dicates a possible sensor fault. To implement this,
Algorithm 2 first standardizes the input sensor ma-
trix (X) and then trains an autoencoder (A) on it.
Once trained, the model produces reconstructions (
ˆ
X)
for the input data. From this, the algorithm com-
putes a correlation matrix (C) to pinpoint sensor pairs
((i, j)) whose correlation magnitude exceeds a pre-
defined threshold (τ). These are the pairs the algo-
rithm expects to act in concert during normal oper-
ation. For each of these correlated pairs, the algo-
rithm compares the actual and reconstructed values at
every time step to calculate the squared pairwise re-
construction error (e
(i, j)
t
). A unique fault threshold
(θ
i, j
) is determined for each pair using the q-quantile
of these errors across the dataset. If the error for any
pair at a given time t surpasses this threshold, the
algorithm flags that data point as a correlation fault
( f
t
= 1). The result is a fault vector that marks any
data point where correlated pairs behaved unexpect-
edly. By looking at all these deviations together, the
algorithm can reliably spot hidden problems like cal-
ibration drift, partial degradation, or even sensor fail-
ure. These are faults that often go unnoticed by stan-
dard single-sensor detectors or threshold-based rules.
3.4 Hybrid Outlier Detection
The hybrid outlier detection layer detects univariate
statistical outliers. It uses a hybrid strategy that com-
bines the Median Absolute Deviation (MAD), which
is robust to non-Gaussian distributions, with a rolling
z-score, which is sensitive to sudden local changes.
The proposed method is outlined in Algorithm 3.
The method uses a two-step approach for each sen-
sor stream. To find long-range outliers, particularly in
skewed or non-Gaussian data, it computes a MAD z-
score for each data point t. This score uses the overall
median (µ
s
) and MAD (MAD
s
) for the entire sensor
column:
z
t,s
= 0.6745 ·
X
t,s
− µ
s
MAD
s
To identify sudden, local spikes, it also calculates
a rolling z-score using the mean (µ
(w)
t,s
) and standard
deviation (σ
(w)
t,s
) from a recent window of size w:
r
t,s
=
X
t,s
− µ
(w)
t,s
σ
(w)
t,s
A point is flagged as an outlier if its MAD z-score
exceeds the threshold θ
mad
or its rolling z-score ex-
ceeds θ
z
. Using both global and local scores enables
reliable detection of both persistent outliers and brief,
sudden anomalies across multiple sensors.
Input: Data matrix X ∈ R
T ×D
with T
timestamps and D sensor columns;
sensor-specific MAD thresholds θ
mad
,
rolling window size w, and rolling
threshold θ
z
Output: Outlier label vector Y ∈ {0, 1}
T
Initialize Y
t
← 0 for all t ∈ {1, . . . , T }
foreach sensor s ∈ {1, . . . , D} do
Compute median: µ
s
← median(X
:,s
)
Compute MAD:
MAD
s
← median(|X
:,s
− µ
s
|)
if MAD
s
= 0 then
continue
end
for t ← 1 to T do
Compute MAD z-score:
z
t,s
← 0.6745 ·
X
t,s
−µ
s
MAD
s
Compute local mean:
µ
(w)
t,s
←
1
w
t
∑
j=t−w+1
X
j,s
Compute local std:
σ
(w)
t,s
←
s
1
w
t
∑
j=t−w+1
(X
j,s
− µ
(w)
t,s
)
2
Compute Rolling z-score:
r
t,s
←
X
t,s
−µ
(w)
t,s
σ
(w)
t,s
if |z
t,s
| > θ
mad
or |r
t,s
| > θ
z
then
Mark outlier: Y
t
← 1
end
end
end
return Y
Algorithm 3: Outlier Detection Using MAD Z-score
and Rolling Z-score.
3.5 Micro-Ensemble Model
To capture complex, multivariate anomalies that ear-
lier detection stages might miss, the final layer uses
a micro-ensemble of two complementary models: an
Autoencoder (AE) and an Isolation Forest (IF). The
AE flags anomalies when the reconstruction error is
high, meaning the input data significantly deviates
from the patterns it has learned. In contrast, the IF
detects anomalies by finding points that are easy to
separate from the rest, which usually means they are
in unusual areas of the data. An observation is flagged
as anomalous if either AE or IF detects it, allowing
the ensemble to remain sensitive to both residual and
complex anomalies. As presented in Algorithm 4, the
process begins by training both models on the train-
ing partition (X
train
) of the feature matrix. For the
autoencoder (A ), the binary indicator a
AE
t
is set to 1
From Detection to Diagnosis: A Layered Hybrid Framework for Anomaly Characterization in Maritime Sensor Streams
383
for any data point x
t
whose reconstruction error (e
AE
t
)
exceeds the threshold θ
AE
. In parallel, the Isolation
Forest (F ), configured with a contamination rate ρ to
account for anomalies in the training data, assigns a
score s
IF
t
to each sample. Its indicator, a
IF
t
, is set to 1
if the model classifies the point as an outlier. Finally,
the micro-ensemble combines these results. A data
point is labeled as an anomaly (y
t
= 1) if either AE or
IF flags it (a
AE
t
= 1 ∨ a
IF
t
= 1). The output is a binary
vector Y , where each entry assigns a label to a row,
indicating whether it is anomalous (1) or not (0).
Input : Feature matrix X ∈ R
T ×D
with T
time steps and D features, AE
threshold θ
AE
∈ R
+
, and IF
contamination rate ρ ∈ (0, 1)
Output: Anomaly indicator vector
Y ∈ {0, 1}
T
Partition X into training data X
train
and test
data X
test
using known samples;
Normalize X
train
and X
test
to [0, 1] using
Min-Max scaling;
Train AE A : R
D
→ R
D
on X
train
;
for t = 1 to T do
ˆx
t
← A(x
t
);
e
AE
t
←
1
D
D
∑
j=1
|x
t, j
− ˆx
t, j
|;
a
AE
t
← 1[e
AE
t
> θ
AE
];
end
Train IF model F on X
train
with
contamination rate ρ;
for t = 1 to T do
s
IF
t
← F (x
t
) a
IF
t
← 1[s
IF
t
= −1];
end
for t = 1 to T do
y
t
← 1[a
AE
t
= 1 ∨ a
IF
t
= 1];
end
return Y = {y
1
, y
2
, . . . , y
T
};
Algorithm 4: Micro-Ensemble Anomaly Detection.
3.6 Anomaly Characterization
The detection pipeline can flag a single data point
with multiple anomalies. The characterization step
solves this by assigning one final, meaningful label
that points to the most relevant issue. It is done
through a priority list that follows the pipeline’s struc-
ture, as laid out in Algorithm 5. The priority sys-
tem is setup in such a way that any major issue,
like a frozen sensor, always overrides a less criti-
cal statistical pattern. If a sensor is flagged as both
an outlier and frozen, for example, it just gets the
FROZEN SIGNAL label. This prevents any conflicting
diagnoses and keeps the final output clean. In Table 1,
a FROZEN SIGNAL for the fuel sensor override a sta-
tistical outlier at 11:13. Although, there is a default
hierarchy, however users can reconfigure it, for exam-
ple, by giving more weight to outliers. Each alert is
traceable to its rule, making the system trustworthy.
Input : Flags for each timestamp t:
f
frozen
(t), f
fault
(t), f
outlier
(t),
f
anomaly
(t)
Output: Final label L(t) for each timestamp
foreach timestamp t do
if f
frozen
(t) then
L(t) ← FROZEN SIGNAL;
end
else if f
fault
(t) then
L(t) ← CORRELATION FAULT;
end
else if f
outlier
(t) then
L(t) ← STATISTICAL OUTLIER;
end
else if f
anomaly
(t) then
L(t) ← COMPLEX ANOMALY;
end
else
L(t) ← NORMAL;
end
end
return L;
Algorithm 5: Hierarchical Anomaly Characterization.
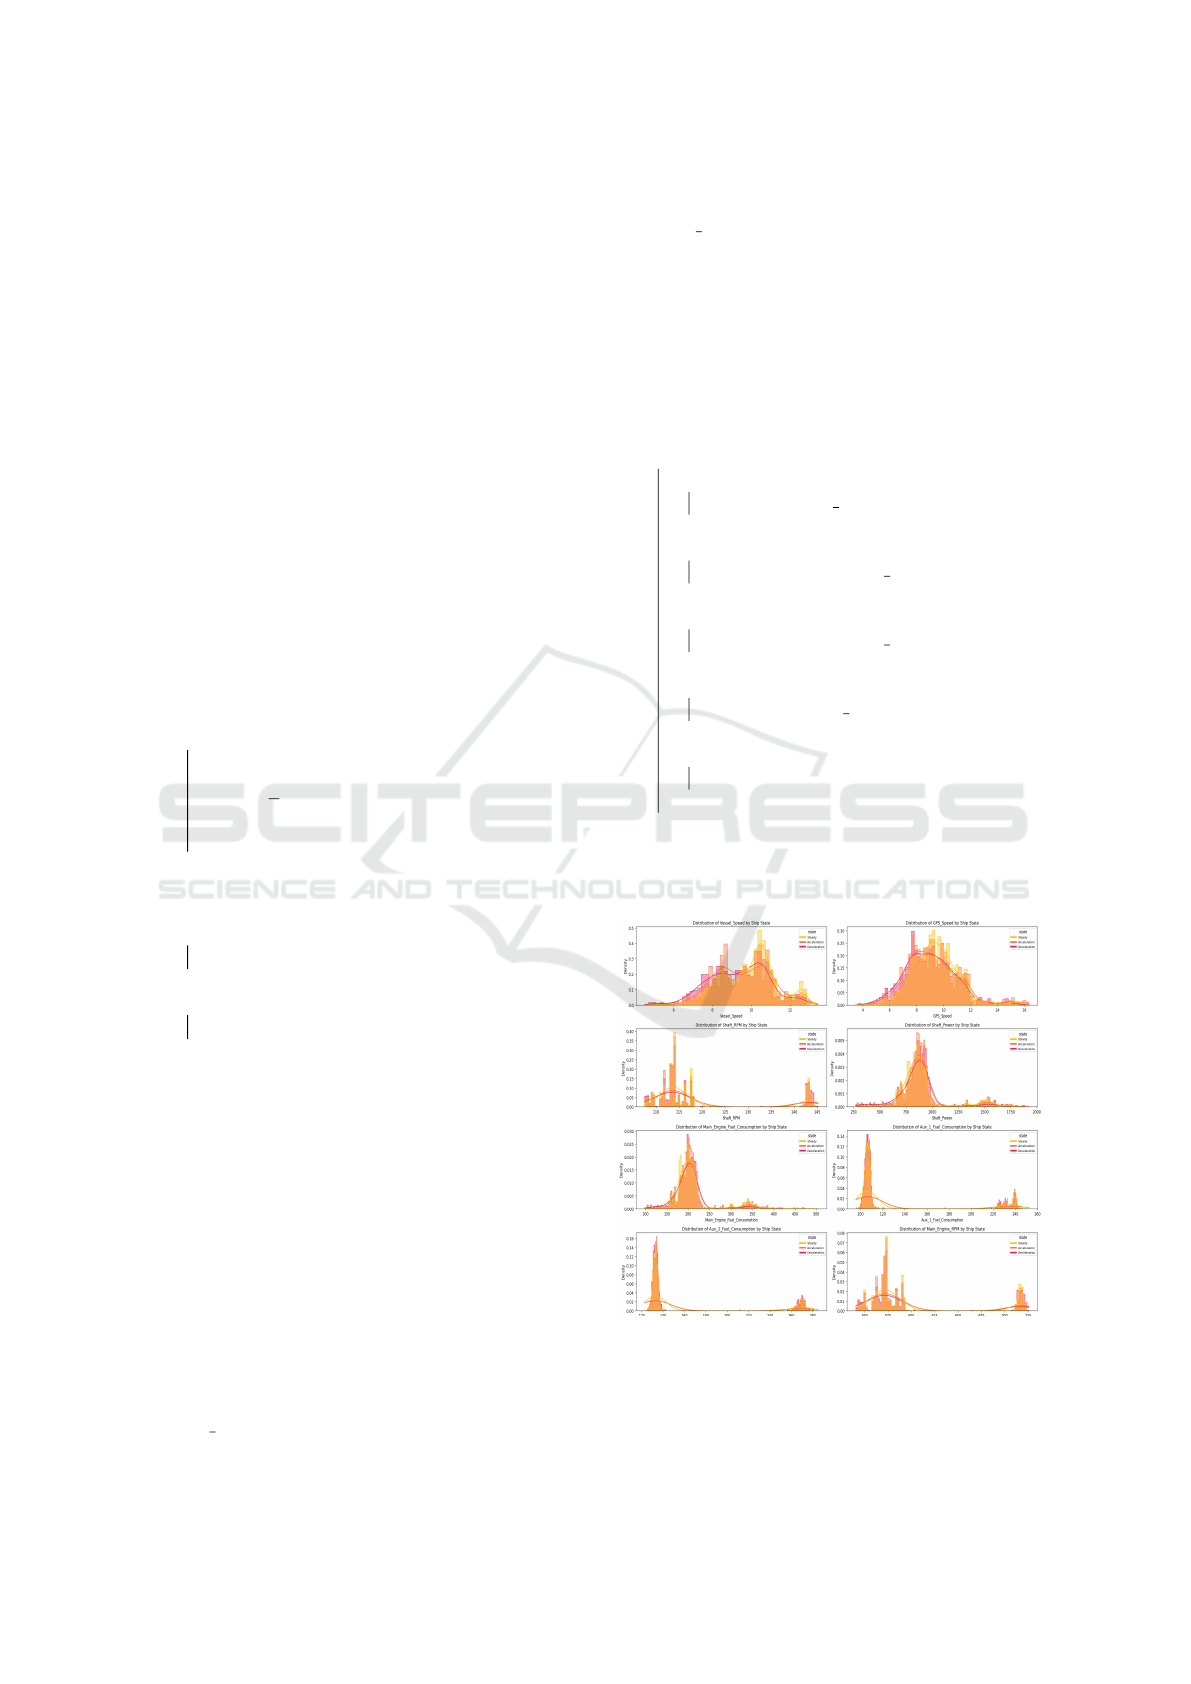
Figure 2: The orange-shaded histograms represent the
overall distribution of sensor readings across all vessel
states. The yellow, light reddish-orange, and magenta semi-
transparent histograms with smooth curves representing es-
timated distributions correspond to the Steady, Accelera-
tion, and Deceleration phases, respectively.
KDIR 2025 - 17th International Conference on Knowledge Discovery and Information Retrieval
384
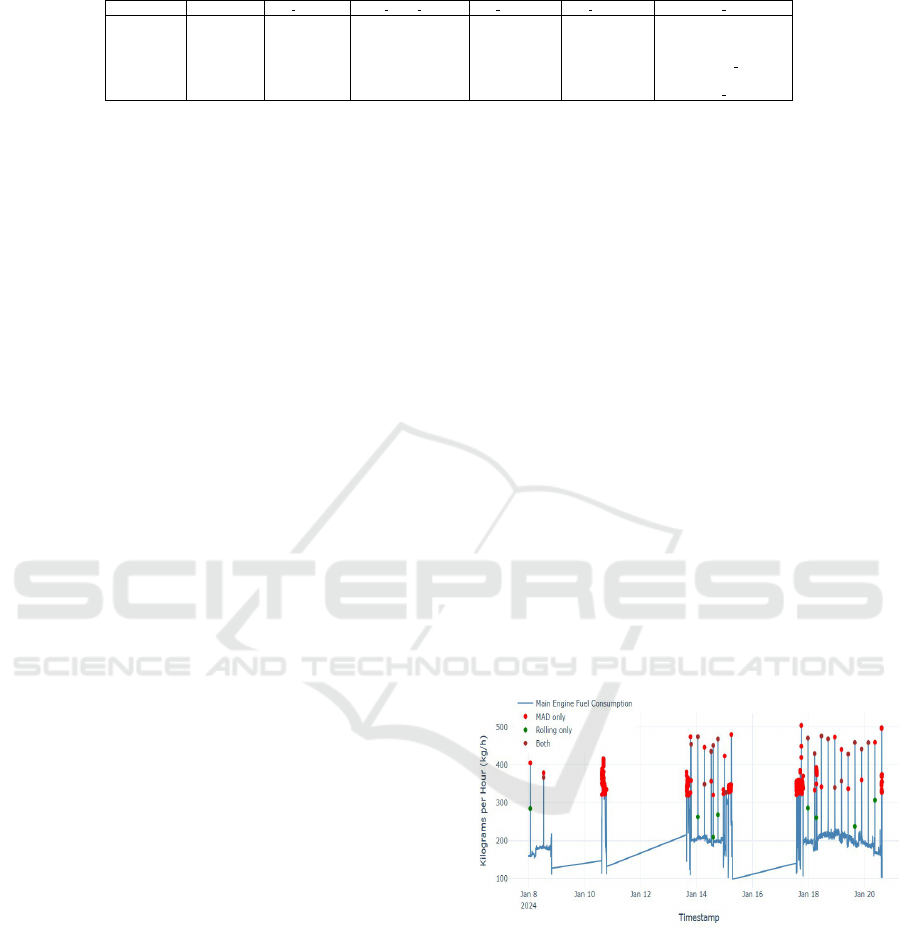
Table 1: Example of Progressive Tagging and Final Characterization for Selected Data Points.
Timestamp Fuel Cons. is frozen has corr fault is outlier is anomaly final label
10:00 350.2 False False False False NORMAL
10:01 351.5 False False False False NORMAL
.. .. .. .. .. .. ..
10:42 580.0 False False True True STATISTICAL OUTLIER
.. .. .. .. .. .. ..
11:13 546.0 True False True False FROZEN SIGNAL
4 EXPERIMENTAL EVALUATION
The framework is developed and evaluated using tens
of millions of one-minute readings collected over sev-
eral years from commercial vessels. Due to a non-
disclosure agreement with the partner company, nei-
ther the exact source nor the original data can be
disclosed. The visualizations used here come from
a representative sample of that data to illustrate the
pipeline’s methodology and behavior. Like most large
industrial datasets, a complete set of expert-annotated
ground truth does not exist. Hence, the evaluation
is mainly qualitative, assessing whether the frame-
work can consistently identify and describe expected
anomalies based on domain knowledge.
4.1 Data Distribution
A core requirement for any practical anomaly detec-
tion framework in this domain is the ability to han-
dle complex, real-world data distributions. As shown
in Figure 2, the initial analysis of the vessel’s sen-
sor data confirms that it rarely follows a simple Gaus-
sian (normal) distribution, often exhibiting significant
skew and multiple modes. This non-normality is ex-
pected and is a direct result of the multitude of opera-
tional factors influencing the vessel at any given time.
As noted by domain experts, variables such as chang-
ing sea states (waves/wind), engine load variations,
long-term hull fouling, and operational adjustments
(e.g., speed or course adjustments) all contribute to
creating a complex, multi-modal data landscape. Ex-
pecting a normal distribution would only be valid for a
highly filtered dataset representing very specific, con-
sistent sailing conditions. Since our framework is de-
signed to operate on broad, real-world data streams,
it cannot make such a restrictive assumption. There-
fore, the modeling approach was specifically designed
for robustness. Instead of relying on methods that re-
quire Gaussian assumptions, the framework utilizes
non-parametric and distribution-agnostic techniques.
This includes robust statistical measures for outlier
detection and unsupervised machine learning models
capable of learning complex data structures directly.
This methodological choice ensures the framework is
effective across both Gaussian and non-Gaussian pat-
terns, making it well-suited for the variable and chal-
lenging nature of real-world maritime data.
4.2 Illustrative Examples
To show how the framework performs in practice, we
examine its output for the main engine fuel consump-
tion sensor.
4.2.1 Characterizing Statistical Outliers
Figure 3 illustrates the result of the hybrid outlier de-
tection module. It clearly distinguishes between dif-
ferent kinds of outliers. The red dots are flagged by
the global MAD method, meaning they are unusual
compared to the overall data pattern. The rolling z-
score flags the green dots, which are sharp, localized
changes that may not be globally unusual but are sta-
tistically important in relation to their immediate tem-
poral context. Brown points are data instances flagged
as outliers by both methods. This strategy, which
checks for both overall patterns and sudden spikes,
makes the outlier detection robust.
Figure 3: Outlier detection using a hybrid method on main
engine fuel consumption.
Similarly, Figure 4 shows how the rolling z-score
(green solid line) fluctuates with local signal behavior,
enabling it to identify context-specific outliers. Both
MAD z-score and rolling z-score apply static global
thresholds too (red and green dashed lines), however
their scoring methods differ. The combination allows
for detection of both global and local outliers.
From Detection to Diagnosis: A Layered Hybrid Framework for Anomaly Characterization in Maritime Sensor Streams
385
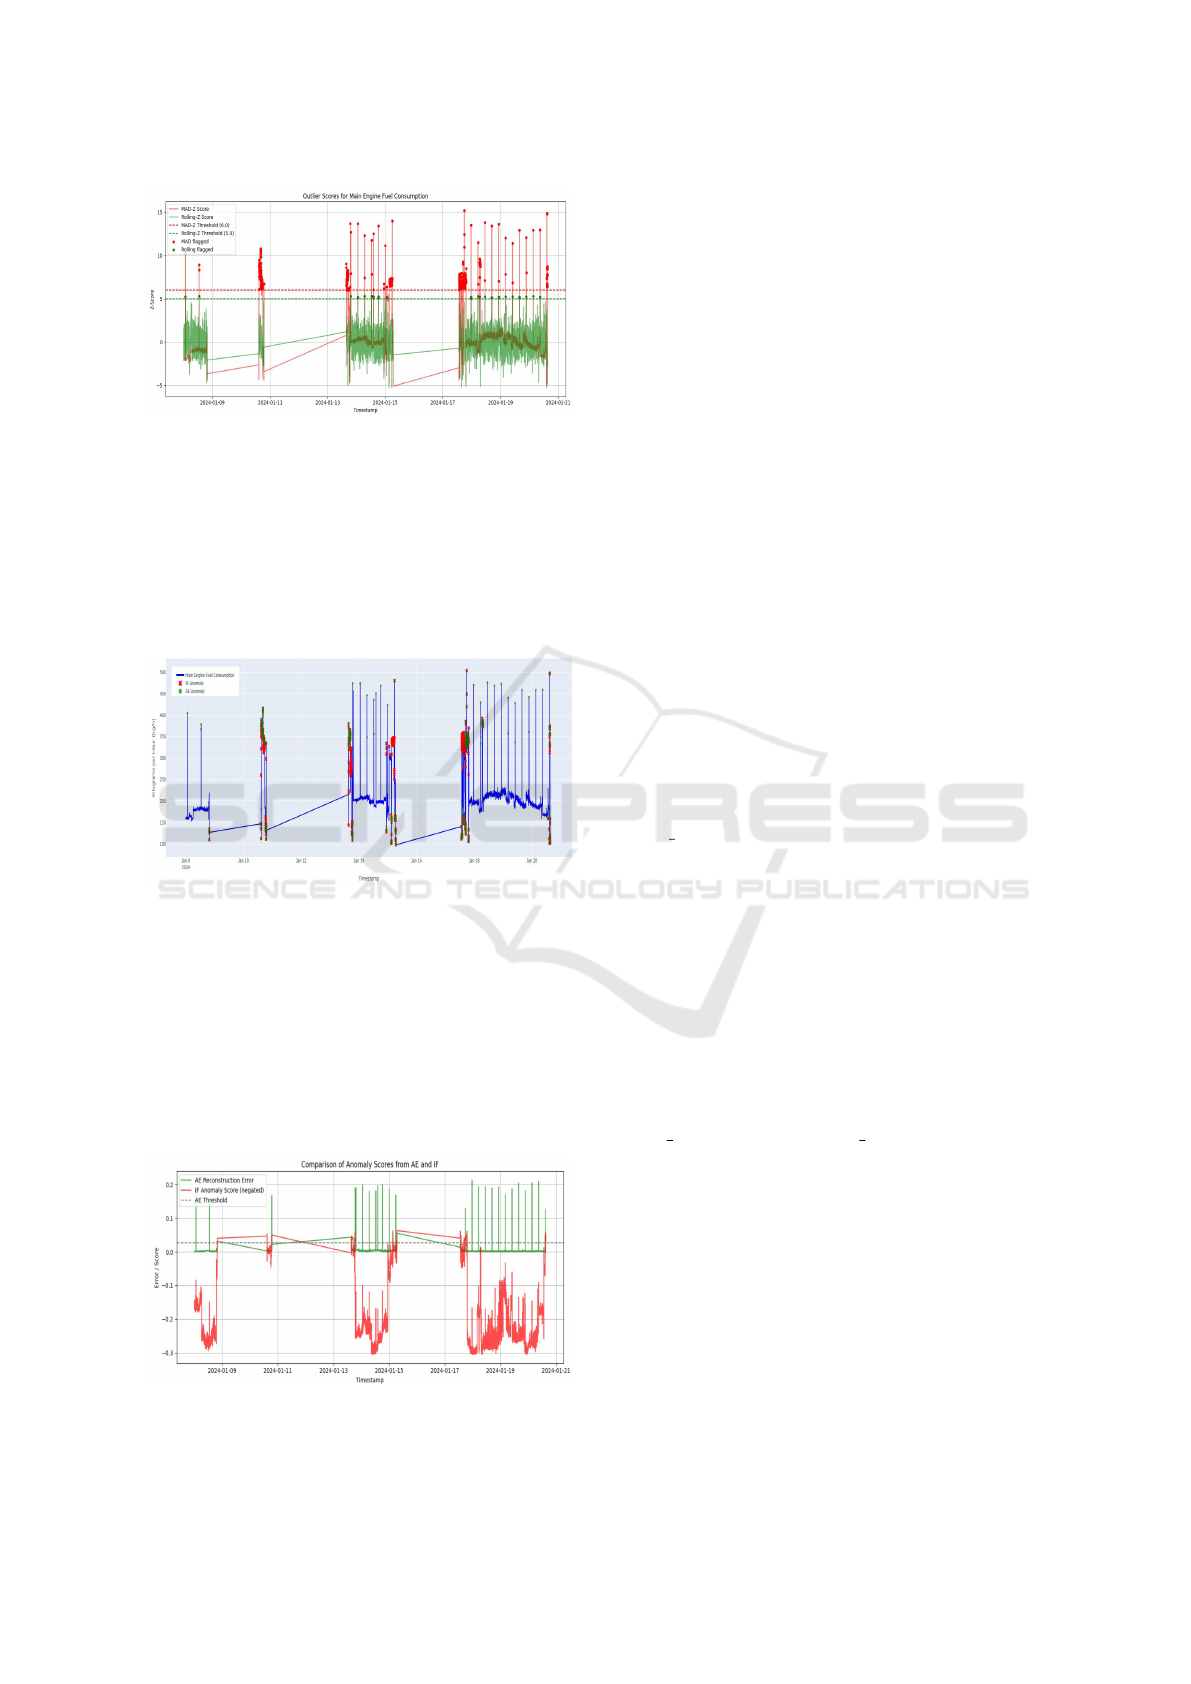
Figure 4: Outlier scores using MAD z-score and rolling z-
score with thresholds.
4.3 Anomaly Characterization
The micro-ensemble layer finds complex system
shifts, not just simple outliers. Figure 5 visualizes this
for the main engine fuel consumption, demonstrating
that each model captures different aspects of anoma-
lous behavior.
Figure 5: Detection of fuel consumption anomalies using
AE and IF models.
The IF model is good at catching long stretches
of abnormal operation (red crosses), like the high-
consumption periods around Jan 11, 14, 15 and 18.
The AE model, on the other hand, is more specific, ze-
roing in on the sharpest spikes/dips within those same
events (green crosses). By combining them, it can be
seen that how long the event lasts (from IF) and how
unusual the values are during that time (from AE).
Figure 6: AE reconstruction error and IF score for anomaly
detection.
The scores behind the micro-ensemble approach
are shown in Figure 6. The figure plots the two core
metrics. The AE’s reconstruction error (green) flags
points that deviate from learned patterns. The IF’s
negated anomaly score (red) identifies points that are
easily isolated. For example, from January 18 to 20,
multiple anomalies are detected over distinct time pe-
riods. The red IF score stays low over extended dura-
tions, indicating sustained abnormal behavior, while
the green AE error spikes capture sudden changes
within those periods.
5 DISCUSSION
Visual evaluations demonstrate the practical utility of
the framework. The design choices are directly moti-
vated by patterns observed in maritime data.
5.1 Interpretability vs. Coverage
The layered design strikes a careful balance between
clarity and coverage at each step. The first layers
(frozen data, correlation monitor, statistical outliers)
are easy to understand. In contrast, the final micro-
ensemble layer offers the ability to detect a wider
range of complex anomalies. However, the COM-
PLEX ANOMALY label is more general and often
requires expert interpretation to determine the root
cause. This step-by-step structure lets operators han-
dle the simple cases automatically while passing on
only the truly difficult ones for further review.
5.2 Progressive Filtering and Trust
Filtering out simple issues early is essential for build-
ing trust in the system. Addressing obvious data
quality problems upfront helps ensure that the more
complex machine learning layers are not misled by
noise. When an operator encounters a CORRELA-
TION FAULT or COMPLEX ANOMALY, they can
be more confident that it represents a genuine issue
rather than a simple spike, enabling a more informed
and effective response.
5.3 Resource Usage and Scalability
The framework is designed for practical, large-scale
deployment. Its scalability is achieved by performing
all computationally intensive model training offline.
The live, online system only executes a sequence of
fast inference steps for each new data point: it first
performs efficient checks for frozen signals and statis-
tical outliers, then uses a single forward pass through
KDIR 2025 - 17th International Conference on Knowledge Discovery and Information Retrieval
386

the pre-trained models to detect correlation faults and
complex anomalies. This high-throughput architec-
ture, with no online training, enables the pipeline to
handle massive data volumes, a key requirement for
deploying it across an entire fleet.
6 CONCLUSION AND FUTURE
WORK
This paper presented a layered hybrid framework
that detects and characterizes anomalies in maritime
sensor data. By systematically identifying events
like frozen signals, faults, or complex anomalies, the
pipeline transforms raw data into a rich source of op-
erational knowledge. The qualitative review of an in-
dustrial dataset shows the design is well-suited for the
complexities of real-world maritime data. This offers
a practical and scalable path for improving data qual-
ity and gaining deeper operational insights.
For future work, our main goal is transfer learn-
ing across vessels. We want to develop methods for
adapting a model trained on a data-rich vessel to a
new one with minimal historical data. Solving this
“cold start” problem is key to accelerating fleet-wide
deployment and would be a major step towards a truly
scalable knowledge discovery platform. We also aim
to develop a method for quantifying anomaly severity.
Rather than a simple binary flag, the system would
generate a continuous severity score, which would
help operators prioritize responses based on the mag-
nitude and potential risk of a given anomaly.
Finally, a critical area for future investigation is
the identification of sensor fault. The current frame-
work, like many correlation-based methods, assumes
that the sensor network is generally reliable. For
the reason that if multiple correlated sensors begin
to fail or drift simultaneously, it becomes difficult to
pinpoint the single faulty sensor. Hence, techniques
to address this IoT device limitation should be ex-
plored. Presumably by incorporating sensor redun-
dancy models, physics-informed constraints, or meth-
ods for explicitly tracking the health and reliability of
individual sensors over time.
ACKNOWLEDGEMENTS
The project was facilitated by DigitalLead (Den-
mark’s national cluster for digital technologies) and
supported by the Danish Board of Business Develop-
ment and the Centre for Industrial Digital Transfor-
mation at University College of Northern Denmark.
REFERENCES
Bl
´
azquez-Garc
´
ıa, A., Conde, A., Mori, U., and Lozano,
J. A. (2021). A review on outlier/anomaly detection
in time series data. ACM Computing Surveys, 54(3).
Gupta, P., Rasheed, A., and Steen, S. (2024). Correlation-
based outlier detection for ships’ in-service datasets.
Journal of Big Data, 11(1):85.
Iftikhar, N., Baattrup-Andersen, T., Nordbjerg, F. E., and
Jeppesen, K. (2020). Outlier detection in sensor data
using ensemble learning. Procedia Computer Science,
176:1160–1169.
Iftikhar, N., Lin, Y. C., and Nordbjerg, F. E. (2022). Ma-
chine learning based predictive maintenance in manu-
facturing industry. In Proceedings of the 3rd Interna-
tional Conference on Innovative Intelligent Industrial
Production and Logistics, pages 85–93.
Iftikhar, N. and Nordbjerg, F. E. (2024). Real-time equip-
ment health monitoring using unsupervised learning
technique. In Proceedings of the 13th International
Conference on Data Science, Technology and Appli-
cations, pages 401–408.
Kim, H. and Joe, I. (2024). Enhancing anomaly detection
in maritime operational iot time series data with syn-
thetic outliers. Electronics, 13(19):3912.
Maganaris, C., Protopapadakis, E., and Doulamis, N.
(2024). Outlier detection in maritime environments
using ais data and deep recurrent architectures. In
Proceedings of the 17th International Conference on
PErvasive Technologies Related to Assistive Environ-
ments, pages 420–427.
Obradovi
´
c, I., Mili
ˇ
cevi
´
c, M., and
ˇ
Zubrini
´
c, K. (2014). Ma-
chine learning approaches to maritime anomaly detec-
tion. Na
ˇ
se more: znanstveni
ˇ
casopis za more i po-
morstvo, 61(5-6):96–101.
Pang, G., Shen, C., Cao, L., and Hengel, A. V. D. (2021).
Deep learning for anomaly detection: A review. ACM
Computing Surveys, 54(2).
Riveiro, M., Pallotta, G., and Vespe, M. (2018). Mar-
itime anomaly detection: A review. Wiley Interdis-
ciplinary Reviews: Data Mining and Knowledge Dis-
covery, 8(5):e1266.
Rybicki, T., Masek, M., and Lam, C. P. (2024). Mar-
itime behaviour anomaly detection with seasonal con-
text. In ISPRS Annals of the Photogrammetry, Remote
Sensing and Spatial Information Sciences, volume 10,
pages 295–301.
Schmidl, S., Wenig, P., and Papenbrock, T. (2022).
Anomaly detection in time series: a comprehensive
evaluation. Proceedings of the VLDB Endowment,
15(9):1779–1797.
Wen, Q., Zhou, T., Zhang, C., Chen, W., Ma, Z., Yan, J.,
and Sun, L. (2023). Transformers in time series: a
survey. In Proceedings of the Thirty-Second Interna-
tional Joint Conference on Artificial Intelligence, IJ-
CAI ’23.
Wenig, P., Schmidl, S., and Papenbrock, T. (2022).
Timeeval: a benchmarking toolkit for time series
anomaly detection algorithms. Proc. VLDB Endow.,
15(12):3678–3681.
From Detection to Diagnosis: A Layered Hybrid Framework for Anomaly Characterization in Maritime Sensor Streams
387
