
Data-Driven Control of a PEM Electrolyzer
Yeyson A. Becerra-Mora
1,2 a
, Juan Manuel Esca
˜
no
1 b
and Jos
´
e
´
Angel Acosta
1 c
1
University of Seville, Seville, Spain
2
Corporaci
´
on Unificada Nacional (CUN), Bogot
´
a, Colombia
Keywords:
PEM Electrolyzer, Gaussian Process Regression, Nonlinear Model Predictive Control.
Abstract:
Green hydrogen production has gained significant relevance in recent years to substitute fossil fuels in the
coming years. One of the most promising technologies for attaining such a milestone is the PEM electrolyzer;
nevertheless, some considerations related to controlling its temperature must be addressed, such as avoiding
high temperatures to extend its useful life and improve its efficiency. Therefore, this study proposes a data-
driven control strategy based on Gaussian Process Regression (GPR) and Nonlinear Model Predictive Control
(NMPC). GPR is used to identify the system, while NMPC is used to regulate the output temperature of the
PEM electrolyzer with the identified model. Simulations show a clear resemblance between the Gaussian
Process model and the phenomenological model, as well as the effectiveness of the controller. Furthermore,
error metrics and computational time are presented.
1 INTRODUCTION
The energy transition is a crucial step in the fight
against climate change for a sustainable future. It in-
volves substituting fossil fuels for renewable energy
sources such as solar, wind, and green hydrogen. The
significance of the energy transition has been recog-
nized by international agreements to tackle environ-
mental issues. For instance, the Paris Agreement ex-
poses the need to limit global warming to 1.5
◦
C by
the end of this century (United Nations Framework
Convention on Climate Change (UNFCCC), 2015).
In addition, countries in the European Union have
launched specific strategies such as the one from
Spain, ”Hydrogen Roadmap: A commitment to re-
newable hydrogen” (Ministerio para la Transici
´
on
Ecol
´
ogica y el Reto Demogr
´
afico (MITERD), 2020),
to achieve net-zero greenhouse gas emissions by 2050
at the latest.
Electrolyzers play a pivotal role in green hydro-
gen production as they are able to use electricity from
renewable sources to produce clean hydrogen (i.e. no
presence of greenhouse gases), which is considered
”green” (Carmo et al., 2013). There are four main
types of electrolyzers (Proton Exchange Membrane,
Alkaline, Solid Oxide Electrolysis Cell and Anion
a
https://orcid.org/0000-0002-6718-4962
b
https://orcid.org/0000-0003-1274-566X
c
https://orcid.org/0000-0003-0040-338X
Exchange Membrane), but only the Proton Exchange
Membrane (PEM) electrolyzer stands out for its effi-
ciency and ability to operate at high current densities.
Additionally, it is particularly suitable for integration
with intermittent renewable energy sources; neverthe-
less, its high cost because of the noble metals for be-
ing produced as well as its water management, could
become downsides of operating it.
Green hydrogen production through PEM elec-
trolyzers not only contributes to greenhouse gas emis-
sions reduction, but also offers a feasible solution
to store renewable energy and provides stability for
the electricity transmission grid. A significant chal-
lenge in a PEM is overheating, which can cause mate-
rial degradation and underperformance. The intermit-
tency in renewable sources can induce rapid fluctua-
tions in the supply energy to the electrolyzer, so that
additional heat is generated because of its load/unload
cycles. Moreover, operation in high current densities
to maximize hydrogen production contributes to the
increase in the internal temperature. The efficiency,
economic feasibility, and useful life of the PEM elec-
trolyzer can be compromised by overheating. There-
fore, an implementation of a temperature control sys-
tem is needed to mitigate such a problem. One of
the most effective methods is to integrate a cooling
system to prevent overheating by conserving its in-
ternal temperature in an optimal range. A refrigerant
fluid through the electrolyzer absorbs heat during op-
Becerra-Mora, Y. A., Escaño, J. M. and Acosta, J. Á.
Data-Driven Control of a PEM Electrolyzer.
DOI: 10.5220/0013738800003982
Paper published under CC license (CC BY-NC-ND 4.0)
In Proceedings of the 22nd International Conference on Informatics in Control, Automation and Robotics (ICINCO 2025) - Volume 1, pages 267-273
ISBN: 978-989-758-770-2; ISSN: 2184-2809
Proceedings Copyright © 2025 by SCITEPRESS – Science and Technology Publications, Lda.
267
eration to dissipate it to the environment afterwards.
Thus, efficient functionality is guaranteed, as well as
the durability of the device is extended.
Different control algorithms have been proposed
to regulate the internal temperature in PEM elec-
trolyzers. (Keller et al., 2022) proposed a feedfor-
ward control strategy and a PID adaptive parameter
to control the temperature of the PEM stack of a 100
kW water electrolyzer. An explicit Model Predictive
Control (eMPC) was embedded in a microcontroller
and implemented in a lab-scale PEM electrolyzer to
preserve the water temperature across it (Ogumerem
and Pistikopoulos, 2020). A heat management system
composed of a water pumping circuit, an air-cooler
and a PID controller has been developed in (Molina
et al., 2024) to control the water temperature in PEM
electrolyzers. (Barros-Queiroz et al., 2024) used a lin-
earized model of a PEM to propose a closed control
strategy based on MPC and a disturbance model to
regulate the electrolyser output temperature. An in-
telligent controller based on Gaussian Mixture Model
(GMM) and Gaussian Mixture Regression (GMR),
was used to control the electrolyser output tempera-
ture (Becerra-Mora et al., 2024).
Renewable energy sources (solar, wind, or hydro-
electric) can be used to power PEM electrolyzers and
thus to produce green hydrogen; however, these types
of sources are inherently nonlinear (behavior is not
proportional to the input). Hence, the dynamics of
the PEM electrolyzer can be considered nonlinear as
well. Usually, a nonlinear mathematical model of the
system is difficult to obtain. Even so, there are ba-
sically three options to know an approximate model:
A simpler linearized model can be deduced; a learn-
ing method can be used to construct estimates from
complex systems (Becerra-Mora and Acosta, 2024);
or first-principles models can be employed. Although
there already exists a phenomenological model for the
PEM electrolyzer (Mora and Bordons, 2022), this pa-
per presents an alternative way to build a machine
learning-based model. Moreover, such a model is em-
ployed in a nonlinear controller. Therefore, a super-
vised learning method, such as Gaussian Process Re-
gression (GPR) is employed to identify the complex
dynamics of a PEM electrolyzer. Once the system
model is identified, this is used in a Nonlinear Model
Predictive Control (NMPC) strategy to regulate the
output temperature of the system.
The paper is structured as follows. In Section 2,
the dynamics of a PEM electrolyzer is presented. In
Section 3, Gaussian Process Regression is explained
to carry out the system identification. In Section 4,
a Nonlinear Model Predictive Control strategy is ad-
dressed to perform set-point tracking. In Section 5,
experiments are described as well as their analysis of
results. Finally, in Section 6, conclusions and future
research are summarized.
2 PEM ELECTROLYZER
DYNAMICS
An electrolyzer contains an electrolytic cell with two
electrodes, an anode and a cathode, which are in
charge of providing an electric current across the wa-
ter to perform the splitting process of the molecule
(H
2
and O). Once the splitting process is performed,
an amount of water still remains in the process, which
is reused into the system to reduce wastewater and
improve its efficiency. In addition, residual water and
gases (Hydrogen and Oxygen) must pass through gas-
liquid separators to guarantee high purity in them.
Some issues such as low purity in gases, electri-
cal conductivity, and overheating are due to materials
degradation by high temperature. Therefore, efficient
operation and useful life in a PEM electrolyzer are
highly dependent on the internal temperature; there-
fore, the cooling system is essential to preserve it
within an optimal range.
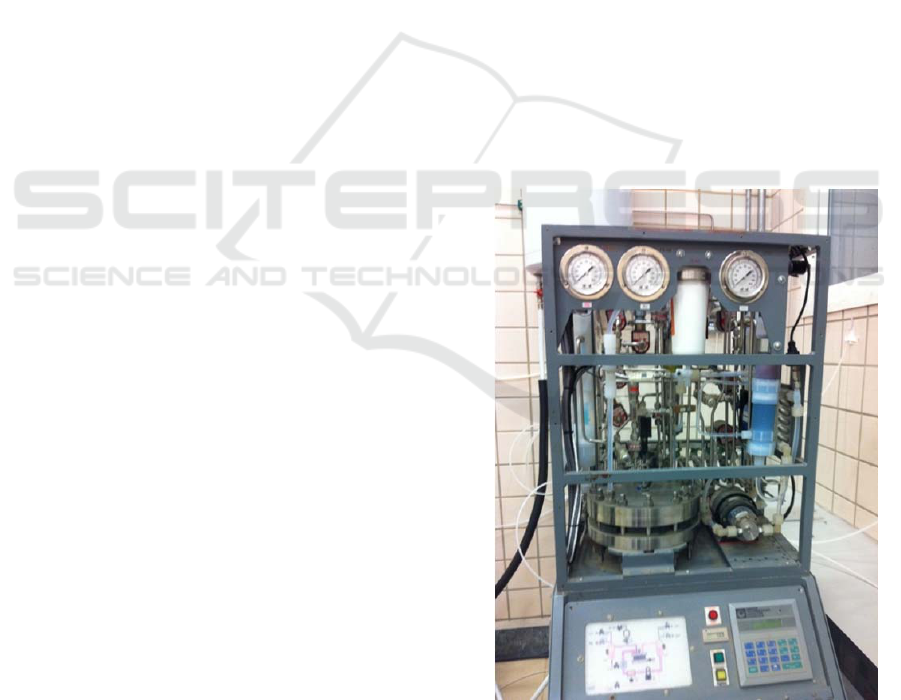
Figure 1: Front view of the PEM Electrolyzer.
The electrolyzer dynamics is described in (Mora
and Bordons, 2022). A first-order differential equa-
tion (1) represents the thermal model that arises from
the simplified energy balance of the system:
ICINCO 2025 - 22nd International Conference on Informatics in Control, Automation and Robotics
268

C
t
dT
el
dt
=
˙
Q
gen
−
˙
Q
loss
−
˙
Q
cool
(1a)
˙
Q
gen
= I
el
(V
el
− n
c
V
tn
) (1b)
˙
Q
loss
=
1
R
t
(T
el
− T
amb
) (1c)
where C
t
is the stack thermal capacity (J/K), T
el
is the
electrolyzer temperature (K),
˙
Q
gen
is the heat gener-
ated in the system as a consequence of overvoltages
or irreversibilities (W),
˙
Q
loss
is the heat loss by envi-
ronmental interaction (convection and radiation) (W),
˙
Q
cool
is the heat dissipated by the cooling system (W),
I
el
is the current applied to the system, V
el
is the volt-
age applied to the system coming from the electro-
chemical system, n
c
is the number of cells, V
tn
is
the thermoneutral voltage, R
t
is the thermal resistance
(K/W) and T
amb
is the ambient temperature (K).
The nonlinear behavior of the PEM electrolyzer
is due to the current I
el
coming from a photovoltaic
source and the ambient temperature T
amb
. Therefore,
(1) can be rewritten as a nonlinear first-order differen-
tial equation as follows:
dT
el
dt
=
1
C
t
[I
el
(V
el
− n
c
V
tn
) −
1
R
t
(T
el
− T
amb
) −
˙
Q
cool
]
(2)
The data used in this study come from a phe-
nomenological model of the Hamilton-STD SPE-HG
1 kW PEM electrolyzer (see Fig. 1). Some technical
features of this system are operation voltage/current
(V/A) = 9 − 11/5 − 80, nominal temperature (ºC)
= 60, number of cells = 6, partial pressure H
2
/O (bar)
= 6.9/1.3, thermal capacity (J/K) = 9540 and thermal
resistance (K/W) = 0.11.
3 MODELING OF PEM
ELECTROLYZER WITH
GAUSSIAN PROCESS
Initially, the Gaussian Process (GP) can be consid-
ered as a generalization of the normal probability dis-
tribution, and according to (Rasmussen and Williams,
2006), GP is a collection of random variables, any
finite number of which have a joint Gaussian distribu-
tion. Therefore, it can be described by its mean and
covariance functions.
According to Section 2, a phenomenological
model of a PEM electrolyzer is defined; neverthe-
less, one of the goals of this study is to discover the
electrolyzer dynamics through a complete dataset of
inputs/outputs {x
I
,x
O
} coming from the phenomeno-
logical model and a regression problem defined by
Figure 2: Inputs and Output of the System.
x
O
= f (x
I
) + η, where f is an unknown function and
η an environmental noise. Hence, an output estimate
x
O∗
can be calculated given unseen inputs x
I ∗
. From
this point on, x
I
and x
O
stand for input and output sig-
nals of the system (see Fig. 2), respectively, in our
study. These can be written as follows:
x
I
= [I
el
,T
amb
,
˙
Q
cool
]
T
,
x
O
= [T
el
]
T
Note that x
O∗
is the estimate of the electrolyzer
temperature
ˆ
T
el
. Thus, Gaussian Process Regression
(GPR) is employed to estimate
ˆ
T
el
given unknown
data coming from x
I ∗
. The dynamics of the system,
as mentioned above, can be modeled as a multivariate
Gaussian distribution x
O
≈ N (µ(x
I
),K(x
I
,x
I
)), where
K, the covariance matrix, plays a fundamental role in
GPs.
K(x
I
,x
I
) =
k(x
I
1
,x
I
1
) k(x
I
1
,x
I
2
) ... k(x
I
1
,x
I
N
)
k(x
I
2
,x
I
1
) k(x
I
2
,x
I
2
) ... k(x
I
2
,x
I
N
)
.
.
.
.
.
.
.
.
.
.
.
.
k(x
I
N
,x
I
1
) k(x
I
N
,x
I
2
) . . . k(x
I
N
,x
I
N
)
(3)
This matrix K is formed by a kernel function
k(x
I
i
,x
I
j
) that provides the covariance between two el-
ements x
I
i
and x
I
j
. Similarity is a required property in a
kernel function as two similar inputs (x
I
i
,x
I
j
) and their
corresponding outputs (x
O
i
,x
O
j
) will have a higher cor-
relation than for dissimilar inputs/outputs. One of the
most used kernel functions is the Radial Basis Func-
tion (RBF), which is defined as follows:
k(x
I
i
,x
I
j
) = σ
2
1
exp
−
1
ℓ
(x
I
i
− x
I
j
)
T
(x
I
i
− x
I
j
)
+ σ
2
3
δ
i j
(4)
where σ
2
1
is the signal variance, ℓ is the length-
scale and σ
2
3
is the noise variance. In general, they
are called hyperparameters. The posterior distribution
stands for the estimate x
O∗
given some unknown data-
points x
I ∗
, so that the joint distribution can be defined
as
x
O
x
O∗
≈ N
x
I
x
I ∗
,
K(x
I
,x
I
) K(x
I
,x
I ∗
)
K(x
I ∗
,x
I
) K(x
I ∗
,x
I ∗
)
!
(5)
Data-Driven Control of a PEM Electrolyzer
269

The posterior distribution over x
O∗
is calculated
with the conditional probability property of Gaussian
distributions.Hence, mean and covariance become
µ
∗
= µ(x
I ∗
) + K(x
I ∗
,x
I
)K(x
I
,x
I
)
−1
(x
O
− µ(x
I
)),
Σ
∗
= K(x
I ∗
,x
I ∗
) − K(x
I ∗
,x
I
)K(x
I
,x
I
)
−1
K(x
I
,x
I ∗
)
(6)
A common assumption in practice is
[µ(x
I
),µ(x
I ∗
)]
T
= 0. GPs can thus be expressed
by their second-order statistics, the covariance matrix
K, which is a positive semidefinite matrix.
4 NONLINEAR MODEL
PREDICTIVE CONTROL
STRATEGY
Although the PEM electrolyzer model can be lin-
earized as in (Mora and Bordons, 2022), to conse-
quently propose a linear controller (Barros-Queiroz
et al., 2024), our approach is to deal with nonlinear
dynamics, looking for improved performance. In fact,
identifying a linear model is relatively easy; more-
over, when the plant is in operation around the op-
erating point, good performance can be achieved.
Figure 3: Block diagram of data-driven control system.
Nonlinear models may be very difficult in devel-
oping; nevertheless, learning methods such as the one
presented in the previous Section, can help in this
task. The electrolyzer model is identified off-line;
hence, the control loop is less complex than in the
case where the model shifts over time. A discrete rep-
resentation of the nonlinear model can be expressed
as:
x
k+1
= f (x
k
,u
k
,v
k
) (7)
where x
k
is the state/output (T
el
), u
k
is the ma-
nipulated variable (
˙
Q
cool
) and v
k
is the disturbance
(I
el
,T
amb
) at the instant k.
One of the better control strategies, both within
the industry and within the research community, has
been Model Predictive Control (MPC). This formula-
tion integrates different control algorithms (e.g. ro-
bust, optimal, stochastic, adaptive, and so on). How-
ever, stability and robustness proofs have been diffi-
cult to obtain because of the finite horizon used (Ca-
macho and Bordons, 1999). Despite having a non-
linear model, MPC concepts can be readily used.
However, there are some issues with regard to non-
convexity in optimization problems and processing
time.
Another goal of this study is to regulate the elec-
trolyzer temperature T
el
to maximize its hydrogen
production without reducing its useful life. Hence,
a Nonlinear Model Predictive Control (NMPC) strat-
egy is proposed in this study. According to equation
(7) and defining a reference temperature T
re f
, the op-
timization problem to be solved at each instant k can
be formulated as
min
˙
Q
cool
J(
ˆ
T
el
,
˙
Q
cool
) := δ
N
p
∑
i=1
(T
re f
(k + i) −
ˆ
T
el
(k + i|k))
2
+ λ
N
u
∑
i=1
(
˙
Q
cool
(k + i))
2
s.t.
˙
Q
min
≤
˙
Q
cool
≤
˙
Q
max
where N
p
and N
u
are the prediction and control
horizons, respectively, δ and λ are weight factors to
adjust the controller and
˙
Q are the boundaries for
the manipulated variable. Since the cooling system
can operate only between a maximum and a minimal
value, the input variable
˙
Q
cool
must be constrained.
Hence, the optimization problem attempts to reduce
the error between the reference and the estimated tem-
perature (
ˆ
T
el
) coming from the GPR model. The data-
driven control system is depicted in Fig. 3.
5 EXPERIMENTS
In this Section, we present the results of performing
two types of experiments to control the electrolyzer
temperature T
el
. First, we identify the nonlinear dy-
namics of the system using GPR; second, we propose
a NMPC strategy to regulate the output temperature
with the model initially identified. Indeed, the phe-
nomenological model of the system is not used to de-
velop the control strategy, but rather for testing the
controller in it. The simulations are run in Matlab
®
on a laptop with an Intel
®
Core i9-13900H 2.6 GHz
CPU and 32 Gb RAM.
5.1 Data Used in the Study
On the one hand, data related to ambient temperature
T
amb
were collected throughout the four seasons of the
year in Seville, Spain. Actually, five different scenar-
ios were used (i.e. autumn, winter, spring, summer
ICINCO 2025 - 22nd International Conference on Informatics in Control, Automation and Robotics
270
and extreme summer). On the other hand, data related
to photovoltaic cells to generate electrical current in
the system I
el
were collected on sunny/cloudy days.
Therefore, ten different combinations were generated
between T
amb
and I
el
. Additionally, data were sam-
pled every second, which means 86400 samples per
day.
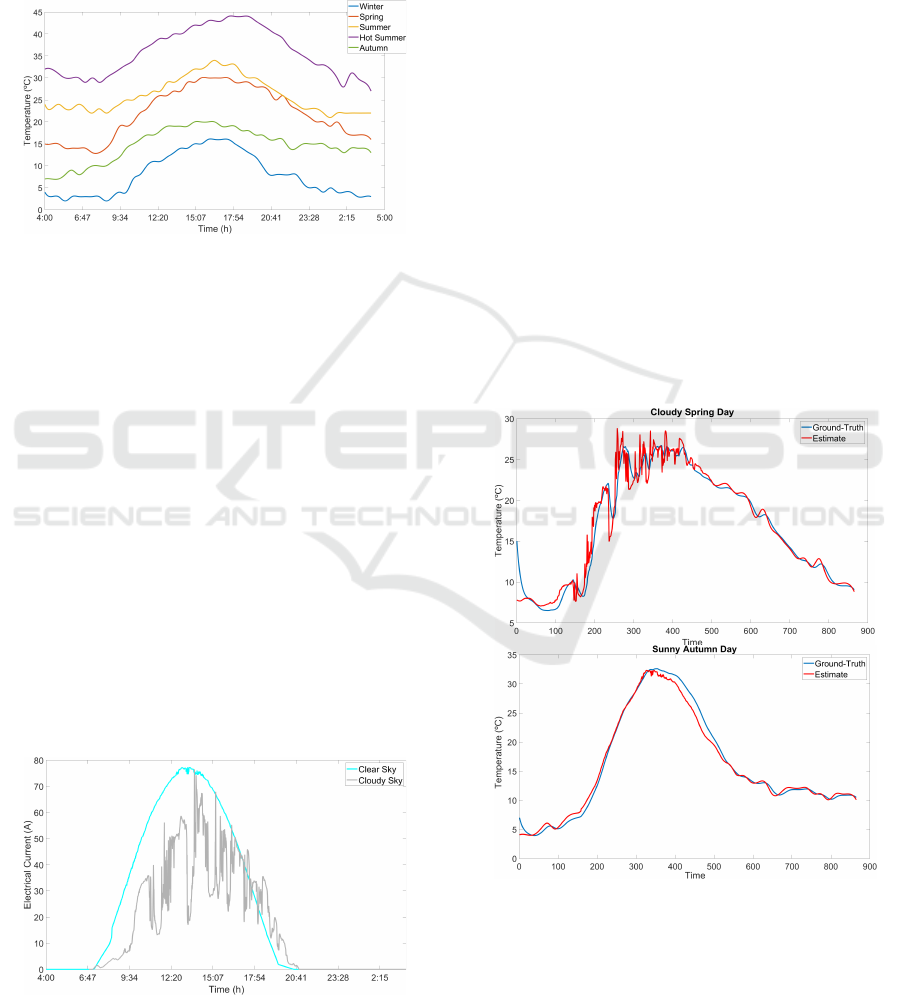
Figure 4: Ambient temperature.
The disturbances of the system correspond to the
ambient temperature (Fig. 4) and the current ap-
plied to the electrolyzer (Fig. 5). The temperature of
Seville T
amb
varies from 3ºC to 44ºC throughout the
year. The hottest months are July and August, as well
as the coldest, January and February. The behavior of
I
el
comes from the photovoltaic system that shows the
influence of irradiance on this variable. As expected
in this kind of system, the electrical current on cloudy
days is reduced compared to sunny days. Moreover,
note that both disturbances have nonlinear behavior,
which is the reason to use a nonlinear regressor (GPR)
and a nonlinear control strategy (NMPC) to identify
the system and regulate the output temperature, re-
spectively.
In addition, the optimal operating range for this
electrolyzer should be between 5 A - 80 A, therefore,
I
el
is saturated at 80 A approximately as the tempera-
ture of Seville can provoke higher levels of electrical
current into the electrolyzer.
Figure 5: Electrical current from a photovoltaic cell.
5.2 Identification of the System
As stated above, the variables [I
el
,T
amb
,
˙
Q
cool
] define
the dynamics of the system. In Section 3 some fun-
damentals of GP are described as a method to con-
struct an estimate of this dynamics. We have defined
three inputs denoted as x
I
and one output denoted as
x
O
to construct a dataset that describes such dynam-
ics. The variables I
el
and T
amb
have been measured
from the photovoltaic system and the climatological
station, respectively. The PEM electrolyzer has been
excited with step signals in the variable
˙
Q
cool
to pro-
duce different levels of temperature at the output of
the electrolyzer T
el
.
One of the purposes of this study is to get as much
data as possible to create a digital twin (Machado
et al., 2023) of the system. Therefore, the step sig-
nals must be enough to reproduce the system dy-
namics; otherwise, the reproductions are poor, or the
method is not capable of generalizing new inputs.
Thus, we set 7 different levels of cooling capacity
(0,25,50,75,100,125,150) W. Note that GPR does
not make distinction between disturbances I
el
,T
amb
and the manipulated variable
˙
Q
cool
, they are all inputs
for this method.
Figure 6: GP model of PEM electrolyzer.
The dataset comprises 6,048,070 samples, by
grouping different scenarios (e.g. summer-cloudy-75
W, spring-sunny-25 W, winter-cloudy-150 W and so
on) and collecting samples every second; neverthe-
less, it has been resampled to 100 seconds to reduce
computational complexity without compromising the
Data-Driven Control of a PEM Electrolyzer
271
quality of reproductions. In this experiment, the re-
duced dataset (60,480 samples) is used as a train-
ing set to learn the complete behavior of the system
throughout the year. The training time has been ap-
proximately 0.63 seconds. To validate a proper learn-
ing, new inputs x
I ∗
associated with the variable
˙
Q
cool
(heat dissipated) are used. In this case, we estimate
the output x
O∗
(i.e.
ˆ
T
el
) with 2 different excitations (30
W, 70 W) in
˙
Q
cool
. During the training and validation
process, the hyperparameters (σ
2
1
, ℓ, σ
2
3
) must be tuned
to achieve better performance.
Two different scenarios (Cloudy spring day, Au-
tumn sunny day) are used to compare ground-truth
(phenomenological model) with estimates (GPR).
The simulations have been conducted over a 24 hour
period, starting at 4:00 a.m. Qualitatively, estimates
(red line) are very similar to ground-truth (blue line)
as can be seen in Fig. 6. Quantitatively, we have used
the root mean squared error (RMSE) to measure the
error between the ground-truth and the estimate. The
scenario of a cloudy spring day shows an RMSE of
1.31ºC and the scenario of a sunny autumn day shows
an RMSE of 0.93ºC, which means that an average low
distance between the 2 curves is presented.
5.3 Nonlinear Control Strategy
The results in the previous Section show the behav-
ior of the system in open-loop. In this Section a
NMPC strategy (i.e. closed-loop) is implemented to
preserve the electrolyzer temperature T
el
below a ref-
erence temperature T
re f
because of the reasons ex-
plained above. In Section 4 the input variable
˙
Q
cool
(i.e. manipulated variable), the disturbances I
el
and
T
amb
and the output variable T
el
(i.e. controlled vari-
able) are defined.
The optimization problem searches for the opti-
mal value of
˙
Q
cool
that minimizes the quadratic error
between T
re f
, which has been set to 30 ºC, and
ˆ
T
el
,
which is the estimated temperature obtained from the
GP model. Moreover, the constraint must be satisfied
˙
Q ∈ {0,150}. The function fmincon from Matlab
®
along with the interior point algorithm are used to
solve the optimization problem. The prediction N
p
and control N
u
horizons are set to 10 samples. The
computational latency to solve the optimization prob-
lem has been approximately 415.81 seconds.
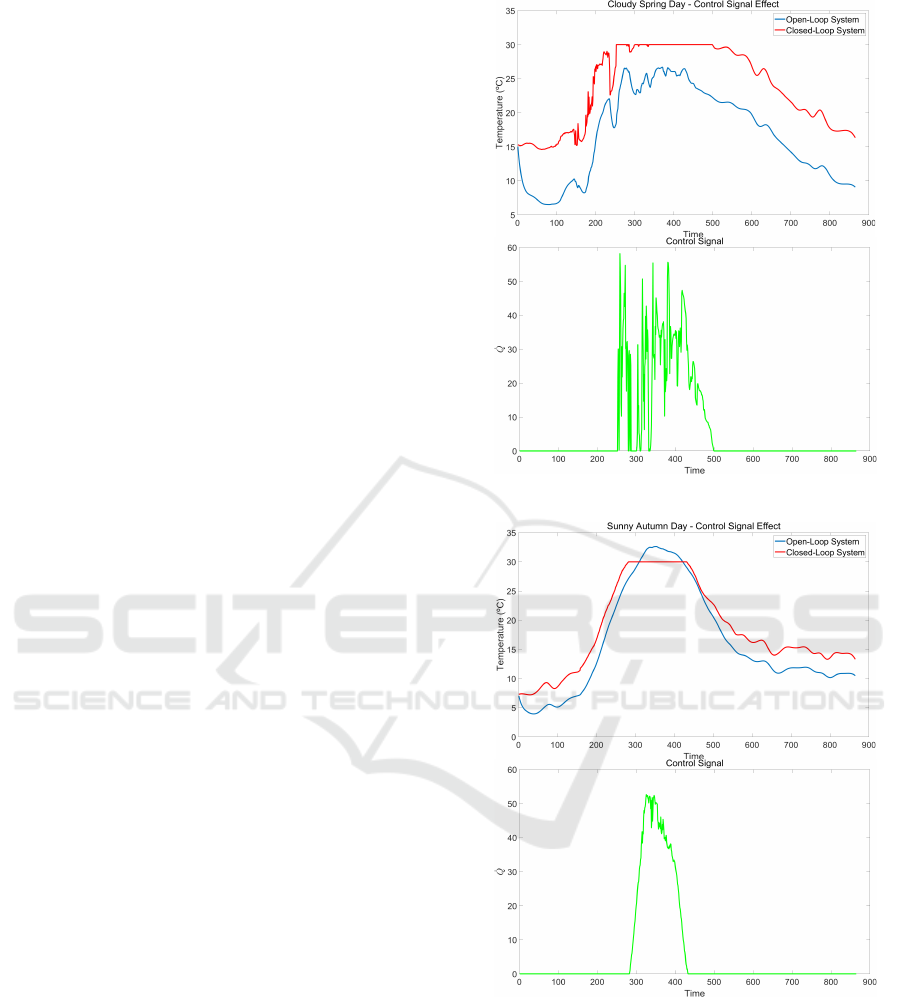
As in the experiment of the previous Section,
two different scenarios are proposed to evaluate the
NMPC strategy, the cloudy spring day and the sunny
autumn day. The phenomenological model is used to
test the performance of the control law; the blue line
and the red line represent the behavior of the open-
loop and closed-loop system, respectively (see Fig. 7
Figure 7: Control signal effect - Cloudy spring day.
Figure 8: Control signal effect - Sunny autumn day.
and Fig. 8). The two scenarios show a controlled
temperature in the electrolyzer less than or equal to
the reference temperature. Note that neither of them
overcomes T
re f
. The control signal effect (green line)
is more intense in the cloudy spring day than in the
sunny autumn day as the former reachs the set-point
faster than the latter; therefore a higher correction is
needed.
ICINCO 2025 - 22nd International Conference on Informatics in Control, Automation and Robotics
272

6 CONCLUSIONS AND FUTURE
WORK
In this study, we presented a data-driven control ap-
proach for a PEM electrolyzer. A dataset was built
from a phenomenological model of the system. This
dataset was used to build a GPR-based machine learn-
ing model. Furthermore, a NMPC strategy is pro-
posed to control the output temperature of the elec-
trolyzer from the machine learning model. The ex-
periments corroborated a good system identification
by providing a low RMSE between the ground-truth
and estimate, as well as the use of such a machine
learning model to develop a control strategy that pre-
serves the temperature at the set-point.
The results suggest that a data-driven control strat-
egy is useful when a phenomenological model does
not exist or when it is too simple to represent non-
linear dynamics. Direct measures in the system are
enough to build a dataset and develop a machine
learning model.
Future work will implement the data-driven con-
trol strategy in the real system (PEM electrolyzer), be-
sides, it will include a covariance analysis to represent
confidence in the estimate, as well as a tuning of the
weight factors to find a smoother control signal. Fur-
thermore, a stochastic MPC approach (Hern
´
andez-
Rivera et al., 2024) would be interesting to deal with
measurement uncertainties. Finally, a stability analy-
sis is considered to extend these results.
ACKNOWLEDGEMENTS
The authors acknowledge support from the Na-
tional Program for Doctoral Formation (Minciencias-
Colombia, 885-2020), and the emerging research
group Multi-Robot and Control Systems (MACS) for
their assistance with the review of the manuscript.
REFERENCES
Barros-Queiroz, J., Torrico, B., Bordons, C., Nogueira,
F., and Ridao, M. (2024). Temperature control for
a PEM electrolyser powered by a renewable source,
volume 45, pages 1–6.
Becerra-Mora, Y., Chicaiza, W. D., juliana Sobral Barros-
Queiroz,
´
Angel Acosta, J., and Esca
˜
no, J. M. (2024).
Aprendizaje de la se
˜
nal de control para un elec-
trolizador tipo PEM, volume 45, pages 1–6.
Becerra-Mora, Y. A. and Acosta, J.
´
A. (2024). Data-driven
learning and control of nonlinear system dynamics.
Nonlinear Dynamics.
Camacho, E. F. and Bordons, C., editors (1999). Model pre-
dictive control. Springer-Verlag, Berlin Heidelberg.
Carmo, M., Fritz, D. L., Mergel, J., and Stolten, D. (2013).
A comprehensive review on pem water electrolysis.
International Journal of Hydrogen Energy, 38:4901–
4934.
Hern
´
andez-Rivera, A., Velarde, P., Zafra-Cabeza, A., and
Maestre, J. M. (2024). Optimal drug administration in
cancer therapy using stochastic non-linear model pre-
dictive control. In 2024 European Control Conference
(ECC), pages 862–867.
Keller, R., Rauls, E., Hehemann, M., M
¨
uller, M., and
Carmo, M. (2022). An adaptive model-based feed-
forward temperature control of a 100 kw pem elec-
trolyzer. Control Engineering Practice, 120:104992.
Machado, D. O., Chicaiza, W. D., Esca
˜
no, J. M., Gallego,
A. J., de Andrade, G. A., Normey-Rico, J. E., Bor-
dons, C., and Camacho, E. F. (2023). Digital twin of
a fresnel solar collector for solar cooling. Applied En-
ergy, 339:120944.
Ministerio para la Transici
´
on Ecol
´
ogica y el Reto
Demogr
´
afico (MITERD) (2020). Hoja de
ruta del hidr
´
ogeno: Una apuesta por el
hidr
´
ogeno renovable. Vicepresidencia Cuarta
del Gobierno de Espa
˜
na. Dispon
´
ıvel em:
https://www.miteco.gob.es/content/dam/miteco/
es/ministerio/planes-estrategias/hidrogeno/
hojarutahidrogenorenovable tcm30-525000.PDF.
Molina, P., Rios, C., de Leon, C. M., and Brey, J. (2024).
Heat management system design and implementation
in a pem water electrolyser. International Journal of
Hydrogen Energy.
Mora, M. and Bordons, C. (2022). Desarrollo y vali-
daci
´
on experimental del modelo din
´
amico de un elec-
trolizador pem de 1kw para su integraci
´
on con gen-
eraci
´
on renovable. XLIII Jornadas de Autom
´
atica: li-
bro de actas, pages 560–567.
Ogumerem, G. S. and Pistikopoulos, E. N. (2020). Para-
metric optimization and control for a smart proton ex-
change membrane water electrolysis (pemwe) system.
Journal of Process Control, 91:37–49.
Rasmussen, C. and Williams, C. (2006). Gaussian Pro-
cesses for Machine Learning. The MIT Press.
United Nations Framework Convention on Climate
Change (UNFCCC) (2015). Paris agreement.
https://unfccc.int/files/meetings/paris nov 2015/
application/pdf/paris agreement spanish .pdf. Ac-
cessed: 2024-05-30.
Data-Driven Control of a PEM Electrolyzer
273
