
Cardiovascular Disease Prediction Using Machine Learning
Saravanan
N P
1
, Maninmaran A
2
, Kanisha A
1
, Karthickrajan S
1
and Keerthana Devi S
1
1
Department of Computer Science and Engineering, Kongu Engineering College, Perundurai, Tamilnadu, India
2
Department of Mathematics, Kongu Engineering College, Perundurai, Tamilnadu, India
Keywords: Cardiovascular, KNN, LR, NB, CVD, AdaBoost.
Abstract: Cardiovascular disease is a major cause of death worldwide, and developing predictive models for early
detection and treatment initiation is crucial. A suite of machine learning algorithms, including KNN, LR, and
NB, has been developed to improve predictions for CVD. The Cardiovascular Disease Dataset, the largest
dataset with over 70,000 records, was pre-processed to recover from missing values, normalize continuous
attributes, and remove outliers. Ensemble approaches were found to be more useful than individual classifiers.
Bagging trained multiple copies of the same model on different data subsets, improving basic classifier
accuracies by an average of 1.96%. Boosting had the highest AUC score of any model, with an average
accuracy of 73.4%. The stacking model, which stacked Cat boost, AdaBoost, and other tree classifiers, showed
the best results, with a train accuracy of 84.33% and a test accuracy of 95.05%. This suggests the potential of
machine learning methods in developing more accurate classifiers for CVD prediction. The stacking model is
significantly better than the rest, indicating the potential for the development of sophisticated diagnostic tools
that improve patient outcomes through correct and timely diagnosis
1 INTRODUCTION
The increasing use of fitness and health bands, ECGs,
and CT scans has significantly advanced medical
technology, particularly in diagnosing cardiovascular
diseases. However, the cost and limited availability of
these tests contribute to the tragic death toll of 17
million people worldwide annually due to
cardiovascular disease. Risk factors include excessive
drinking, hypertension, and age, which are prevalent
in high-income countries and account for 87% of
deaths in the US. The current gold standard for
investigating cardiovascular disease is invasive
angiography, which is expensive, risky, and requires
high-level technical skill. This calls for research into
developing non-invasive, affordable, and widely
applicable techniques for CVD investigation.
This paper presents an intelligent CVD diagnostic
method using predictive machine-learning models
and ensemble methods like bagging, boosting, and
stacking.The model is trained and tested using a large
Kaggle database, the "Cardiovascular Disease
Dataset," which contains over 70,000 records. This
data set provides a deeper understanding of risk
factors and outcomes of cardiovascular disease,
ensuring more realistic and high-performing models.
The study compares base models with ensemble
models, investigating various techniques like
bagging, boosting, and stacking. The comparison is
based on the superiority of the approach in terms of
robustness improvement or capacity increase
compared to traditional articles that focus on just one
methodology.
Advanced ensemble techniques, such as boosting
and stacking, are used to enhance prediction
capabilities by blending multiple models and personal
abilities. These techniques are further enhanced by
training a meta-model for stacking and iteratively
upgrading the model to focus on misclassified cases.
The study provides insights into the mechanisms
underlying cardiovascular disease (CVD) causation
and how to mitigate it by exploring key risk factors
and their interrelationships. The proposed project
aims to develop a non-invasive diagnostic tool that
can be used for early identification and treatment of
CVD, significantly reducing the high death rate
associated with this common disease. This paper
contributes to the knowledge on CVD prediction and
has applications in the medical field due to the ease
of generating accessible, reasonably priced diagnostic
N P, S., A, M., A, K., S, K. and S, K. D.
Cardiovascular Disease Prediction Using Machine Learning.
DOI: 10.5220/0013734300004664
Paper published under CC license (CC BY-NC-ND 4.0)
In Proceedings of the 3rd International Conference on Futuristic Technology (INCOFT 2025) - Volume 3, pages 877-886
ISBN: 978-989-758-763-4
Proceedings Copyright © 2025 by SCITEPRESS – Science and Technology Publications, Lda.
877

tools. This would lead to better patient outcomes and
save lives on a global scale. The study's structure
includes sections on related work, dataset description,
feature analysis, correlation tests, experimental
results, and implications.
2 LITERATURE REVIEW
Cardiovascular disease (CVD) accounts for
significant, worsening morbidity and mortality
worldwide, and the development of predictive models
is highly essential. As the increased demand for
automatic diagnostic structures in hospital therapy
continues, progress in information technology has
specifically played a crucial role in the diagnosis of
CVD (Azmi, et al. , 2022). Subramani et al conducted
a study on machine learning (ML) and deep learning
models to Cardiovascular disease prediction. Dataset
used herein contains samples of 918 after removing
Duplicates that have data from sources like
Cleveland, Hungarian, etc. The results indicate
classification methods, such as Random Forest (RF),
Logistic Regression (LR),Multi- Layer Perceptron
(MLP), and CatBoost. A stacking model achieved the
best accuracy of nearly 96%, utilizing Gradient
Boosting Decision Trees (GBDT) and SHAP for
feature selection. The model’s performance was
evaluated through metrics such as accuracy,
precision, recall, and AUC (Subramani, et al. ,
2023).For instance, Pasha et al. published a work on
deep learning for cardiovascular disease
prediction. techniques. They took the Kaggle dataset,
which contains information like age, gender, blood
Pressure, and Cholesterol Different machine learning
algorithms were tried. These include Support Vector
Machines (SVM), K-Nearest Neighbor (KNN), and
Decision Trees (DT). The results revealed that These
algorithms did not perform well on large data sets.
Thus, the authors implemented an The Artificial
Neural Network, through TensorFlow Keras,
improved the degree of prediction up to 85.24%,
surpassing the other models (Pal, et al. , 2022).
Pal et al. did a study on the prediction of
cardiovascular disease (CVD) using machine
learning (ML).The study utilized the UCI repository
data set and concentrated only on 13 key attributes.
Two ML K-Nearest Neighbor (K-NN) and Multi-
Layer Perceptron (MLP) models were employed. The
MLP the model succeeded in achieving a higher
accuracy at 82.47% with an AUC of 86.41% than the
K-NN model. with the accuracy of 73.77%. In
conclusion, the MLP model was proven to be more
effective on which inputs. automatic CVD detection,
showing improved performance over all key metrics
(Ali, et al., 2021).This is an article, titled "Heart
disease prediction using supervised machine learning
algorithms:" Performance analysis and comparison,
discusses the prospect of supervised machine. some
learning algorithms for forecasting cardiovascular
diseases (CVD). According to data from Kaggle, the
The study applied multiple classifiers, including K-
Nearest Neighbors (KNN), Decision Tree (DT), and
Random Forest (RF). The results show that RF, KNN,
and DT are perfect accuracy algorithms. sensitivity,
and specificity, making them highly effective for
CVD prediction. The study highlights the
Importantly, feature selection allows for the
enhancement of prediction accuracy by
demonstrating that Use of Machine learning in
clinical decision-making about heart disease
diagnosis (Shah, et al. , 2020).
Shah et al. tested a data set of 303 instances with
14 attributes that were chosen from the Cleveland
database for heart disease prediction. The four
machine learning algorithms Naïve Bayes, Decision
Tree, K-Nearest Neighbor (KNN), and Random
Forest. KNN achieved the highest accuracy at
90.79%, followed by Naïve Bayes at 88.16%,
Random Forest at 86.84%, and Decision Tree at
80.26%. The author concluded that KNN, Naïve
Bayes and Random Forest are effective in predicting
heart disease, with KNN delivering the best
performance (Krittanawong, et al. , 2020). This meta-
analysis published, assessed the predictive capability
of machine learning algorithms in the prediction of
cardiovascular disease on more than 3.3 million
patients across 103 cohorts. Custom-built algorithms
with boosting techniques performed reasonably for
the prediction of coronary artery disease and reported
an AUC of up to 0.93. The SVM and CNN algorithms
worked best to predict stroke, with an AUC of up to
0.92. However, there is still a big variety between
different algorithms, indicating the choice made
should be carefully evaluated clinically.The article
named "Cardiovascular Disease Risk Prediction with
Supervised Machine Learning Techniques" and
addresses the long-term risk of CVD using machine
learning models to predict such risk. Finally,
comparisons of some supervised learning algorithms
are presented; namely Logistic Regression, Support
Vector Machines (SVM), Naive Bayes, and Random
Forest algorithms, with respect to three measures of
accuracy, recall, and AUC metrics. It is realized that
the highest accuracy yielded by the Logistic
Regression model is around 72.1% with AUC being
at 78.4%, suggesting the best model for predicting the
risk for CVD (Pasha, Ramesh, et al. , 2020).In the
INCOFT 2025 - International Conference on Futuristic Technology
878

prediction of CVD, ensemble methods, particularly
bagging, prove to be really very powerful. Accuracies
range from as high as eighty-one. Similarly,
combining fuzzy Naive Bayes with genetic
algorithms The article "Heart Disease Prediction
Using Machine Learning Techniques", the K-NN and
Random Forest algorithms are employed in order to
make predictions for diseases of the heart. A Kaggle
dataset is used in the analysis with different features,
chest pain, cholesterol level, and age, to classify the
patient as having heart disease or not. The
percentages of accuracy by the K-NN algorithm stood
at 86.89%, while 81.97% was gained by the Random
Forest algorithm. The study concludes that machine
learning can be valuable in the early heart disease
diagnosis, which may reduce physical and mental
health damage (Dritsas, Alexiou, et al. , 2022). For
instance, This particular paper delivers a machine
learning-based approach to predict CVD using Naive
Bayes, Decision Trees, and K-Nearest Neighbours,
which offer algorithms for prediction. Stated are the
advantages related to AI in enhancing the level of
accuracy within predicting and aiding the clinician in
making diagnoses. The ensemble neural networks did
quite well in the study conducted, offering more
accuracy in assessing CVD risk. This would increase
the prognosis rate with reduced mortality throughout
the world. It claims an empirical approach in the
prediction of cardiac disease based on supervised
machine learning techniques that include Logistic
Regression, Decision Tree, Navie Bayes, SVM, and
K-Nearest Neighbors (K-NN). Based on a dataset
from the UCI repository, these models are evaluated
in terms of the performance metrics accuracy,
precision, and recall.It further reveals that the
accuracy of the method was the highest when the
technique of Logistic Regression was applied. Thus,
these early diagnosis may help reduce deaths. In the
future, more recommendations need to be generated
with ensemble techniques to further improve the
models (Gupta, Saha, et al. , 2021).
The investigation into those vast system learning
and ensemble methods puts forward dynamic steps in
research that helps predict CVD. Such innovation is
the ornament not only to the predictability skills of
the diagnostic model but also enables development
for non-invasive cost-effective diagnostic devices.
Such equipment could drastically revolutionize the
early diagnosis and treatment of CVD, thereby
bringing down the death rate due to such a killer
disease. This review leverages data technology
advances to contribute to global efforts in combating
CVD and improving outcomes of patients.
3 DATASET
The dataset used in this observe is available from the
Kaggle resource and first transformed into an
unprocessed country, which is organised as a comma-
separated values file. There are no null values in this
dataset. The variables of the dataset consists of
various forms of non-stop and specific sorts,which
enabled the model to be educated with a range of
functions. However, more careful inspection
discovered two critical issues: an enormous general
deviation within a few continuous variables and the
presence of outliers, which are also known as global
anomalies. These problems had to be addressed for
the dataset to be valid and clean enough for successful
gadget learning model training. The following
preprocessing operations were carried out to mitigate
those problems.
Table 1: Dataset
DATASET
S.no Attribute name Range
1 Age 29 to 77
2 Restin
g
blood
p
ressure 90 to 200
3 Serum cholesterol 126 to 564
4 Maximum heart rate 71 to 202
• Sex: Binary (0, 1)
• Fasting Blood Sugar > 120 mg/dl: Binary (0, 1)
• Resting ECG Results: 0, 1, 2
• Exercise Induced Angina: Binary (0, 1)
• Slope of the Peak Exercise ST Segment: 0, 1, 2
• Number of Major Vessels Coloured by
Fluoroscopy: 0 to 3
3.1 Trimming Extreme Values
Continuous variables with high trendy deviations
often signify the presence of outliers or severe values
that may result in a tilt in the statistical analysis. To
address this, the top and lower 2% percentiles of these
variables have been trimmed. Such trimming
successfully removed the influence of excessive data
points factors, and the residual records factors tend to
better reflect typical value within the dataset.During
the process of information checking outliers positive
anomalies were discovered which were no longer just
over but impossible. For example, those instances
where the SBP is recorded as lesser than the DBP are
deemed mis recorded. All such anomalies were
removed from the database so that the statistics being
utilized for version education become rational and
Cardiovascular Disease Prediction Using Machine Learning
879

sensible. This became a very important stage that
ensured the version's predictions are reliable.
3.2 Removal of Implausible Dataset
To get uniformity throughout the dataset, non-stop
numeric variables that have no longer become
categorical have been normalized. Normalization
refers to rescaling those variables towards a trendy
range, especially among zero and 1. This system
helps in managing the facts and standardizing it in a
great way for the gadget to understand it and learn
from this dataset. Normalization also prevents
dominance of the model by one variable due to the
scale of it.After all of these preprocessing steps, the
dataset was now prepared for model building.
Balancing the target variable-to-wit, reflecting the
presence or absence of cardiovascular disease was
one of the most important impacts of preprocessing.
This effect was achieved through careful trimming
and removal of outliers so the dataset was almost
uniformly presented with excellent and poor
instances. This stability is important because it
eliminates the need for additional weighting for the
period of information evaluation, which may
complicate the modelling process. The effect of
preprocessing on the distribution of continuous
variables is given in Figure 1. This comparison
compares the distributions before and after
preprocessing, emphasizing the success of the steps
taken to normalize and ease the records.
4 FEATURE ANALYSIS
A Pearson's coefficient heatmap was created to
examine the correlation between features and the
target variable The heatmap provided a
comprehensive overview of patterns and correlations.
Age and systolic blood pressure were also analysed,
as they had significant Pearson coefficients, making
it easier to view the target variable's distribution. The
graph showed that most patients with cardiovascular
disease had higher cholesterol and systolic blood
pressure levels. However, the age-target variable
relationship was not as clear in the clustering method.
To classify similarities in data points with the target
variable mapping, data analytics were focused on
using centroid-based clustering, specifically K-
Means. The data was analysed in two dimensions to
visually visualize the data. The centroids for four
continuous variables were plotted, and the target
variable mapping and cluster forms were obtained
through the application of graphs.
The study clusters diastolic and systolic blood
pressure variables with the largest Pearson and
LASSO coefficients, focusing on clusters 5, 6, and 7
for the majority of patients with cardiovascular
disease (CVD). Other continuous variables, age,
height, and weight, showed weaker yet significant
classification capabilities. K-Means and other
clustering methods can be useful for this
classification problem. Age shows a strong linear
relationship, while other variables reveal polynomial
or curved relationships.
Cardiovascular disease (CVD) patients often tend
to lean toward the right on most axes in the dataset
analysis, possibly due to the significant capability of
logistic regression to classify such cases. This
tendency reflects the dataset's intrinsic ability to
differentiate between patients with and without CVD.
To ensure the accuracy and reliability of the analysis,
a thorough filtering process was implemented to
measure feature relevance, focusing on both
categorical and continuous variables that might have
relationships with the target variable—CVD
diagnosis.In the initial stage, gender was excluded
from the logistic regression model due to a low z-
value and a p-value greater than 0.512, indicating its
minimal impact on predicting CVD. On the other
hand, other variables like age, systolic blood pressure,
cholesterol levels, and glucose levels displayed high
z-values, highlighting their strong correlation with
the target variable. The selection of these features
involved both visual and quantitative approaches to
ensure robustness, as the goal was to include variables
that genuinely contributed to the model's predictive
power.
A Pearson correlation heatmap was used to
identify the relationships between the continuous
variables and the target variable, providing a
comprehensive view of which features had the
highest associations with CVD. This step involved
examining the correlation coefficients between each
continuous variable and the target variable, allowing
for an intuitive understanding of potential influential
factors. Variables like age and systolic blood pressure
emerged as particularly important due to their high
Pearson coefficients, which suggested a significant
positive association with CVD. This insight led to a
more in-depth analysis of these variables, exploring
their distribution patterns and relationships with CVD
to determine their predictive strength.Given the
critical role of age and systolic blood pressure, further
analysis focused on understanding their direct impact
on CVD prevalence. Age is often a risk factor for
cardiovascular conditions, and the analysis revealed a
clear trend where older individuals had a higher
INCOFT 2025 - International Conference on Futuristic Technology
880

likelihood of CVD. Similarly, elevated systolic blood
pressure, a known indicator of hypertension, was
strongly correlated with increased CVD risk, making
it an essential variable for predictive modeling. The
combined influence of these variables allowed for
better calibration of the logistic regression model,
ultimately improving the accuracy of predictions.
To
better visualize the relationship between continuous
variables and CVD, a graph plotting continuous
variables against cholesterol levels was constructed.
Cholesterol is a well-established risk factor for CVD,
making it a critical focus for analysis. A random
sample of 400 data points was selected for plotting to
reduce potential biases and ensure that the findings
were representative of the overall dataset. The
resulting plot was descriptive, clearly illustrating that
higher cholesterol levels and elevated systolic blood
pressure were common among CVD patients. This
visual representation highlighted the significance of
these variables for further analysis, as their patterns
could be directly observed.
The complexity of the relationships between age,
blood pressure, and CVD risk made it difficult to
capture all nuances using simple plots. To address
this, the K-Means clustering method was employed,
Figure 1: Catboost classifier
which calculates the centroids and identifies distinct
clusters in a two-dimensional space. This method
effectively segmented the data into groups, revealing
underlying patterns that were not immediately visible
through standard plots.
5 SETUP OF EXPERIMENT
A detailed feature analysis was conducted using Least
Absolute Shrinkage and Selection Operator (LASSO)
to select the best set of features. Feature selection is
helpful in getting features that may possibly be
irrelevant for classification purposes since they can
damage model performance. LASSO performs this
operation through updating the absolute value of
feature coefficients by retaining features with more
significant coefficients and eliminating those with
lower coefficients. This procedure improves the
efficiency of the model by considering the most
significant predictors. Those features in the pre-
processed dataset, such as alcohol consumption,
smoking status, and glucose levels, we eliminated
from the analysis because their coefficients were less
than 0.01, as calculated on LASSO. We adopted 75%
of the dataset for training, while 25% was preserved
to evaluate the performance metrics on testing. To
ensure more randomness and enhance learning as
well as prevent overfitting, the data points were
randomised within the entire dataset.
We experimented using 10 K-Folds cross-
validation in order to ensure that our models are
strong. This will make sure that the results are reliable
and not dependent on a certain subset of the data.
Average performance metrics for each fold were also
calculated in order to ensure that they evaluate the
effectiveness of each model. For the major
hyperparameters, verbosity, iterations, and leaf
nodes, we also use a wide range of values with nested
loops to optimize. Then we use grid search to pick up
the best combination of hyperparameters for each
model in order to minimize performance errors. The
models were implemented in Python, leveraging the
Scikit-Learn library for modelling the given dataset.
Such an approach helped to systematically assess and
compare various machine learning algorithms, and
finally gave a clue about the best models predicting
the disease based on cardiovascular factors.
5.1 Boosting
Ensemble techniques try to reduce the variance across
a single model by taking the best of multiple
heterozygous or even homozygous models. Boosting
is an in homogenous technique; it is done by building
a strong classifier from several different weak
classifiers with an iterative process. Exploring
random forests using the bagging algorithm: In this
algorithm, many decision trees are fit over various
subsets of data. A fair degree of variation on the
Cardiovascular Disease Prediction Using Machine Learning
881
number of estimators for each of the ensemble models
will be used to measure the optimum number.
Boosting is a homogeneous technique wherein the
base classifier is learnt on subsets of data to aid in the
development of several models whose performance is
mediocre. The data points that were misclassified are
then split and fit into the subsequent model.
Therefore, by combining different weak learners with
a cost function, the variance of a model is reduced.
CART proved to be a suitable choice as a base
estimator since it is the algorithm underlying the
default tree. The major hyperparameters, for
example, estimators and the number of times the
model is boosted, were iteratively varied to reach the
optimum number.
Table 1: Performance metrics of traditional classifiers
S
n
o
Model
Train
ing
Accu
racy
%
Testi
ng
Acc
urac
y
%
Rec
all
%
Pre
cisi
on
%
A
U
C
%
F1
sc
or
e
%
1 Logist
ic
Regre
ssion
87.1
3
85.0
0
90 93 0.
85
91
.4
4
2 K-
neares
t
Neigh
b
ours
89.2
4
86.4
4
91 92 0.
86
91
.4
4
3 Decisi
on
Tree
89.6
6
87.7
2
92 94 0.
87
93
.0
0
4 Gauss
ian
Naïve
Bayes
88.8
5
87.3
5
89 95 0.
87
91
.8
8
5 SVC 88.2
4
86.2
9
91 92 0.
86
91
.4
4
6 Cat
boost
90.0
1
88.1
5
92 94 0.
88
93
.0
0
Then, the best combination of hyperparameters
was chosen by grid searching. We have implemented
an experiment by applying various boosting
algorithms, namely Gradient Boosting, AdaBoost,
and XG boost. Among the above mentioned, the
algorithm where we found to be the most efficient is
Gradient Boosting. It had a value of 88.00% in testing
accuracy. Estimators are important that measures the
performance of models. That is to say that accuracy
increases with the count of estimators that is used up
to 150, but after that it starts rising or falls except in
the case of XGBoost whose accuracy does not change
with the change in the number of estimators.
In summary, the ensemble methods known as
boosting were seen to outperform single models
considerably, and amongst these, gradient boosting
turns out to be a robust model in our experiments, too,
as is also aligned with our findings by respect of
accuracy and stability of the model.
5.2 Bagging
Bagging is the method of creating multiple copies or
variants of one predictor and combining them to
achieve an aggregated predictor.This improves the
performance of a weak classifier due to the use of
parallel homogeneous models, from which an
average of the output is derived using a function. The
base model was compared with every model that was
bagged. Recall and precision scores also improved.
This was shown by a decrease in the number of false
positives and false negatives, hence enhancing the
overall model performance.
Then, the random forest model was investigated.
It fits data on multiple decision trees and averages the
bias throughout the models. This avoids overfitting
on a singular decision tree while also decreasing the
variance within the data. However, the problem with
random forests is the complication involved in the
model, which increases the time computationally as
compared to a singular decision tree. Therefore, the
random forests were pruned and the number base
estimators was varied to determine the optimum
number that needs to be used. The optimum number
of trees was found to be 147, this gives an accuracy
of 87.66%.
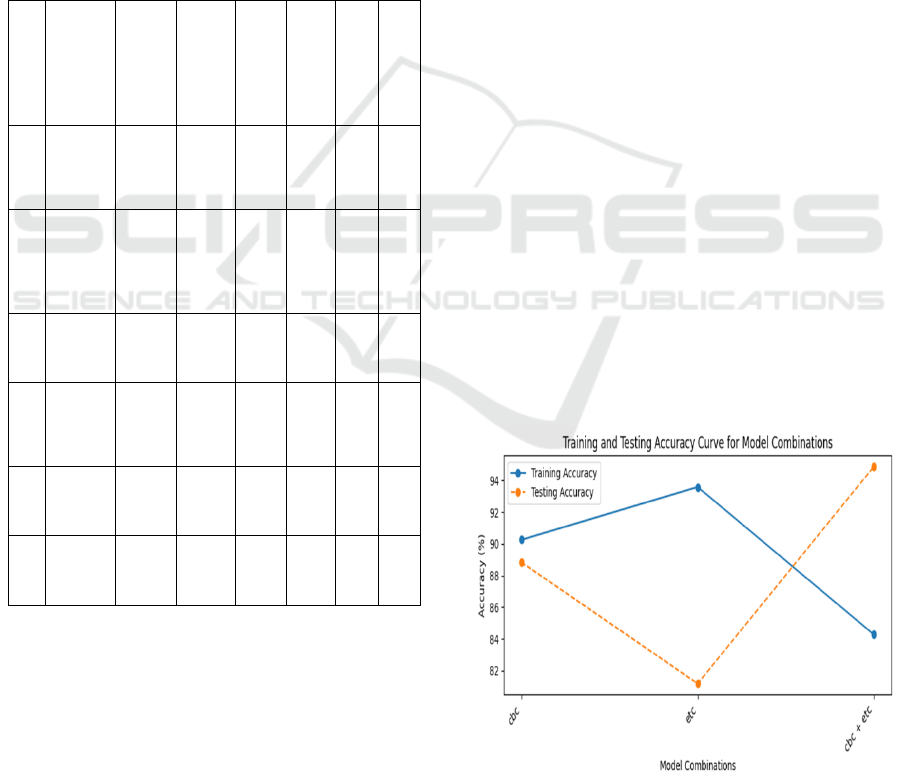
Figure 2: Training and testing accuracy curve
INCOFT 2025 - International Conference on Futuristic Technology
882
The last ensemble technique to be covered was
stacking, considered a very strong modelling
technique. It works based on the integration of other
weak learners to enhance predictive ability.
The layers in the case of stacking occur stacked
one after the other, with an output from one layer
flowing up to the next; in the last case, the top one is
the final layer that produces the final prediction, while
a direct feed from the original data set feeds inputs
into the bottom one. The binary logistic regression
classifier was used for meta-classification, which
combined all the different base classifiers into an
effective stacker. In order to stack the given set of
base classifiers available, the following were used:
• Gradient Boosting Classifier
• Cat boost Classifier
• Ada boost Classifier
• Extra Trees Classifier
A number of subsets of these base classifiers was
created using a combination strategy in order to arrive
at the optimum stacked model. This was achieved by
fitting each subset to the stacking model with logistic
regression as the final estimator. This led to a
situation in which the performance of various model
combinations could be evaluated systematically. The
stacking of Gradient Boosting, Cat boost, AdaBoost,
and Extra Trees classifiers by using logistic
regression as the meta-classifier yields a 95.05%
testing accuracy
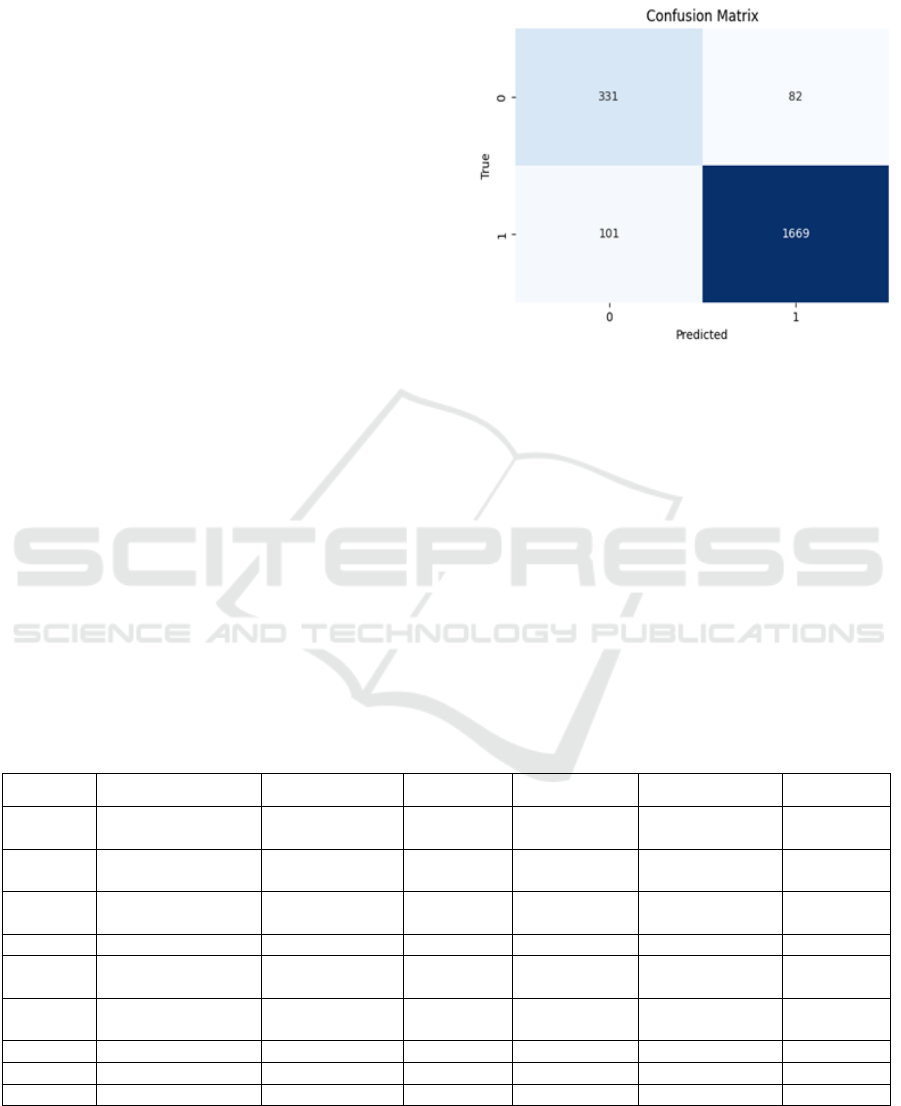
Figure 3: Confusion Matrix
The experiments using the stacking approach
demonstrated that such an approach indeed does
prove amazingly effective in improving the predictive
accuracy of disease prediction of disease prediction
of cardiovascular disease. Making use of the strengths
of a number of base classifiers in making predictions,
logistic regression combining the predictions has
effectively secured the highest model prediction
accuracy in the results and hence holds promise for
its application.
Table 2: Statistical evaluation of bagged models
S.no Model Accuracy% Recall Precision F1 AUC
1 Bagged Logistic
Re
g
ression
87.50 85.00 86.80 85.88 0.86
2 Bagged K-Nearest
Nei
g
hbors
86.44 86.44 86.44 86.44 0.85
3 Bagged Decision
Tree
87.72 87.72 87.72 87.72 0.87
4 Ba
gg
ed SVC 86.29 86.29 86.29 86.29 0.85
5 Bagged Gaussian
Naive Bayes
87.35 87.35 87.35 87.35 0.86
6 Bagged Random
Forest
87.66 87.66 87.66 87.66 0.87
7 XG boost 84.18 84.18 84.18 84.18 0.84
8 Gradient Boosting 88.00 88.00 88.00 88.00 0.88
9 AdaBoost 87.97 87.97 87.97 87.97 0.88
Cardiovascular Disease Prediction Using Machine Learning
883
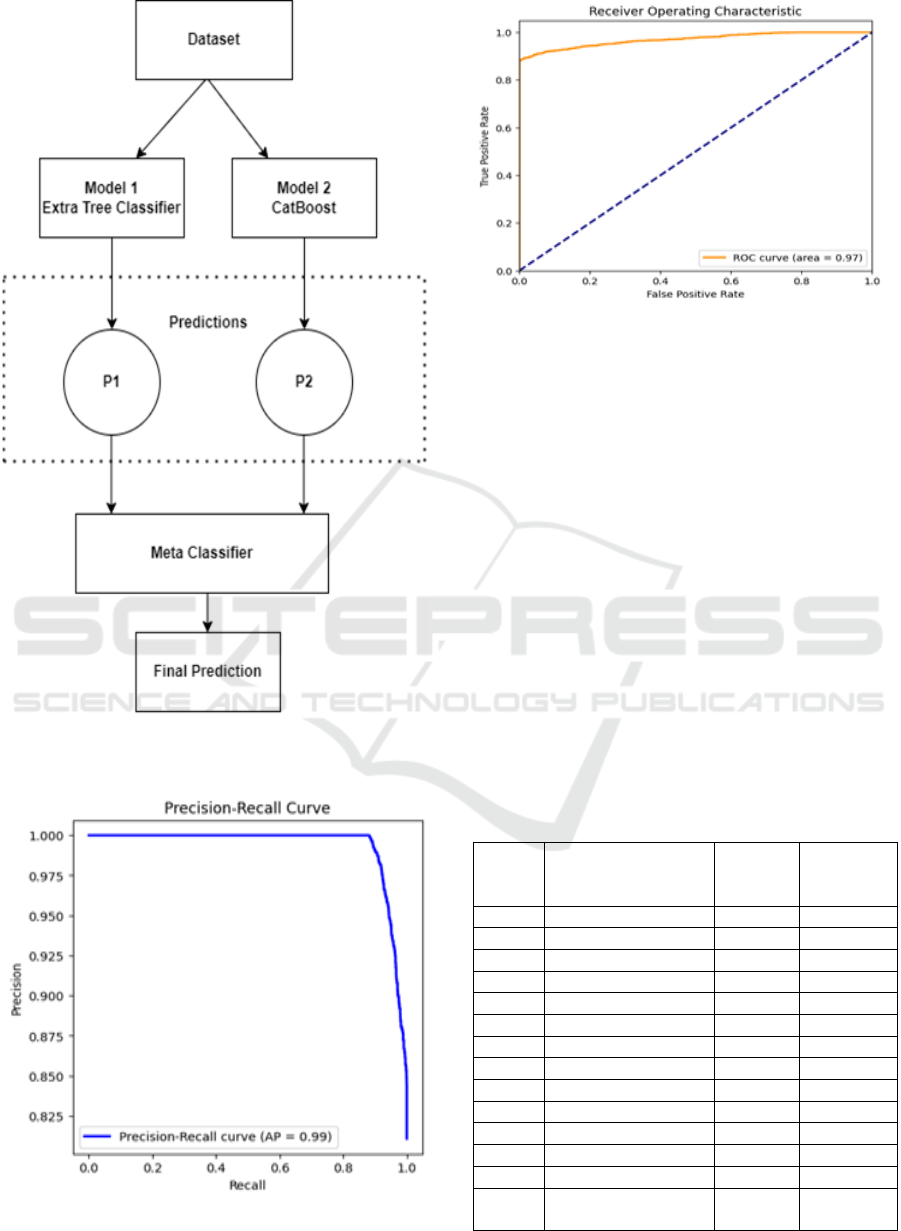
Figure 4: Over stacking workflow
Figure 5: Precision-Recall Curve
Figure 6: ROC Curve
6 RESULT & DISCUSSION
Recent research on cardiovascular disease prediction
has primarily focused on conventional classifiers,
such as boosting and random forest classifiers.
However, the stacking and bagging technique has
shown considerable reliability in this context. The
Cleveland dataset has shown that decision trees and
random forest classifiers are more suitable for
diagnosing cardiovascular disease. In this study,
decision tree, random forest, and other sophisticated
classifiers showed high accuracy levels. Gaussian
Naive Bayes and Random Forest models achieved
high accuracy of 87.35% and 87.66%, respectively.
However, boosted models like AdaBoost, Gradient
Boosting, and XG boost outperformed the base
classifier in all metrics. The stacked model achieved
Table 3: Performance of various models and combinations
S.no Model
Training
accuracy
%
Testing
accuracy
%
1 XG boost 93.36 84.18
Lo
g
istic Re
g
ression 87.13 85.00
2 LGBM 92.43 85.77
3 KNN 89.24 86.44
4 Gaussian NB 88.85 87.35
5 Random Forest 89.61 87.66
6 Decision Tree 89.66 87.72
7 Extra Tree 90.39 87.81
8 Ada Boost 90.26 87.97
9 Gradient Boosting 90.37 88.00
10 SVM 88.24 86.29
11 XG boost 93.36 84.18
12 Cat Boost 90.01 88.15
13
Stacking (Best
Combo)
84.33 95.05
INCOFT 2025 - International Conference on Futuristic Technology
884

a remarkable testing accuracy of 95.05% by
combining base models like Gradient Boosting, Cat
boost, AdaBoost, and Extra Trees, and logistic
regression as a meta-classifier.
This resulted in higher accuracy values than single
base classifiers and other ensemble techniques tested
in the study. The paper presents a stacked model that
significantly improves over traditional methods in
cardiovascular disease prediction. The model is larger
and more comprehensive than previous research,
allowing for more training and validation options.
The study aims to provide a practical and robust
predictive model for cardiovascular disease,
demonstrating the potential of stacking, especially
with a combination of base models and logistic
regression meta-classifier, as an alternative approach
to traditional classifiers and ensemble methods. The
proposed stacking model achieves state-of-the-art
accuracy in experiments and has the potential to be
more applicable to real-world scenarios. The paper
suggests further research on more base model and
meta-classifier combinations and applying stacking
to more medical datasets to better test and perfect this
technique.
7 CONCLUSION
It clearly discusses the prediction of cardiovascular
diseases using various machine learning techniques.
Data analytics carried out initially revealed massive
patterns and needed features for binary logistic
classification. Essential techniques like statistical
analysis and k-nearest neighbours played a significant
role in the effective selection of features from the
dataset. However, it was found that the base models
initially explored, such as KNN, Logistic Regression,
etc, had their accuracy capped at a certain level. The
outcomes of this work based on the ensemble
techniques show significant improvements of
accuracy in prediction compared to direct use of base
models. Techniques of bagging, such as Random
Forest and Extra Trees, witnessed quite impressive
improvements in performance with accuracy levels
coming to 87.81%. The boosting methods show a
better outcome generally, where results of AdaBoost,
Gradient Boosting, and XG boost showed an
accuracy level coming to 88.00% only with Gradient
Boosting.
The most significant gain was obtained by the
stacking ensemble. Here again, we used
heterogeneous models like Gradient Boosting, Cat
boost, AdaBoost, and Extra Trees in combination
with logistic regression as meta-classifiers. In fact,
we obtained a testing accuracy of 95.05% with this
model of stacking. This therefore proves the
theoretical advantage of stacking: using the best
model of different base models could deliver better
predictive performance. K-Folds Cross-Validation
validated the consistencies of these results with low
standard deviations in accuracies, thus ensuring a
very reliable and stable model performance.This
means that the models appear pretty good at
predicting positive cases but could improve much
when all cases are concerned.
Future work will focus on testing this proposed
stacking model for practical validity and robustness
of prediction by using real test data from some lab
tests. More advanced ensemble techniques, such as
ensemble neural networks, may also be worked upon
to better enhance the predictive abilities of the models
we are developing. The present research was limited
to traditional ensemble methods like boosting,
bagging, and stacking, and further results can be
obtained through an extension of these boundaries to
incorporate more complex techniques. In general, this
study introduces the potential that ensemble
techniques, specifically stacking, can be used to
improve the accuracy of disease prediction for
cardiovascular disease and can be better than a typical
classifier by providing a more effective and reliable
approach.
DECLARATION OF COMPETING
INTEREST
The authors declare that they have no known
competing financial interests or personal
relationships that could have appeared to influence
the work reported in this paper.
REFERENCES
Azmi, J., et al., A systematic review on machine learning
approaches for cardiovascular disease prediction using
medical big data. Medical Engineering & Physics,
2022. 105: p. 103825.
Subramani, S., et al., Cardiovascular diseases prediction by
machine learning incorporation with deep learning.
Frontiers in Medicine, 2023. 10.
Pal, M., et al., Risk prediction of cardiovascular disease
using machine learning classifiers. Open Med (Wars),
2022. 17(1): p. 1100-1113.
Ali, M.M., et al., Heart disease prediction using supervised
machine learning algorithms: Performance analysis and
Cardiovascular Disease Prediction Using Machine Learning
885

comparison. Computers in Biology and Medicine,
2021. 136: p. 104672.
Shah, D., S. Patel, and S.K. Bharti, Heart Disease
Prediction using Machine Learning Techniques. SN
Computer Science, 2020. 1(6): p. 345.
Krittanawong, C., et al., Machine learning prediction in
cardiovascular diseases: a meta-analysis. Scientific
Reports, 2020. 10(1): p. 16057.
Machine Learning Based Algorithm for Risk Prediction of
Cardio Vascular Disease (Cvd). Journal of critical
reviews, 2020. 7(09).
Pasha, S.N., D. Ramesh, S. Mohmmad, A. Harshavardhan,
and S. Shabana, Cardiovascular Disease Prediction
using Deep Learning Techniques, in Proceedings of the
International Conference on Recent Advances in
Engineering and Management (ICRAEM 2020), IOP
Conf. Ser.: Mater. Sci. Eng., vol. 981, 2020, p. 022006.
doi:10.1088/1757899X/981/2/022006.
Dritsas, E., S. Alexiou, and K. Moustakas, Cardiovascular
Disease Risk Prediction with Supervised Machine
Learning Techniques, in Proceedings of the 8th
International Conference on Information and
Communication Technologies for Ageing Well and e-
Health. 2022. p. 315-321
Gupta, C., Saha, A., and Reddy, N.V., Cardiac Disease
Prediction using Supervised Machine Learning
Techniques, in AICECS 2021, Journal of Physics:
Conference Series, vol. 2161, no. 1, 2022, p.012013.
doi:10.1088/1742-6596/2161/1/012013.
INCOFT 2025 - International Conference on Futuristic Technology
886
