
Quantitative Analysis of Ambient Temperature Effects on Steptime
Variations in Industrial Pneumatic Actuators
Jon Zubieta
a
, Unai Izagirre
b
and Luka Eciolaza
c
Mondragon Unibertsitatea, Electronics and Computer Science Department, Goiru Kalea, 2,
Arrasate - Mondragon 20500, Gipuzkoa, Spain
Keywords:
Ambient Temperature, Pneumatic Actuators, Sub-Cycle Time Analysis, Condition Monitoring, Predictive
Maintenance, Context-Aware Anomaly Detection, Industrial Control Systems, Industrial Automation.
Abstract:
This paper presents a quantitative analysis of the influence of ambient temperature on the cycle time of pneu-
matic actuators in industrial production environments. Sub-cycle time periods, known as Steptimes, are used
to characterize the duration of individual machine stages without requiring additional sensors. Building on the
concept of Mini-terms and following the IEC 60848 GRAFCET standard, Steptimes are defined as the elapsed
time between the activation and deactivation of PLC-controlled steps. Although the potential impact of ambi-
ent temperature on actuator performance is often acknowledged qualitatively, few studies have addressed this
effect through precise, quantitatively measured data. In this work, a detailed experimental study is conducted
using a PLC-controlled system composed of four automated modules. Steptimes and ambient temperature
have been continuously monitored and their effects modeled statistically. The results show a consistent in-
verse correlation between temperature and Steptimes, as expected. The contribution of this research work
is twofold: first, the feasibility and potential of using Steptime measurements to detect subtle environmental
effects in industrial assembly lines is demonstrated. Second, the impact of ambient temperature in highly
automated industrial assembly lines is quantitatively measured. By modeling subtle environmental effects,
deviations in Steptime can be more accurately interpreted, reducing the risk of false alarms and improving
system reliability.
1 INTRODUCTION
Monitoring sub-cycle time periods in industrial pro-
duction machinery, such as the time taken for indi-
vidual components to complete their tasks, provides
valuable insights into their operational health. These
measurements enable data-driven condition moni-
toring without requiring additional sensors, making
them an efficient tool for industrial environments.
An early concept in this field is that of Mini-terms
(Garcia and Montes, 2019a), (Garcia and Montes,
2019b), (Garc
´
ıa and Mont
´
es, 2019), defined as a sub-
division of the cycle time. Mini-terms enable granu-
lar analysis of component behavior by isolating time
intervals that reflect the performance of individual ac-
tuators or subsystems.
Building on this concept, (Zubieta et al., 2025)
proposed a scalable and standardized methodology
a
https://orcid.org/0000-0003-1831-3665
b
https://orcid.org/0000-0002-9811-5775
c
https://orcid.org/0000-0003-3966-7104
to define sub-cycle time periods of machines pro-
grammed in a PLC in compliance with the IEC 60848
standard, which defines the GRAFCET methodology.
In this approach, sub-cycle time periods, referred to as
Steptimes, are defined as the time elapsed between the
activation and deactivation of a specific step within
the machine’s operating sequence.
Unlike Mini-terms, which typically focus on ac-
tuator movements alone, Steptimes can be applied to
any functional step controlled by the PLC, including
compound actions involving multiple elements. They
are also task-based measurements rather than purely
action-based, meaning they can distinguish between
the same physical action performed in different con-
texts. For example, a pneumatic cylinder moving
from point A to point B may exhibit different Step-
times depending on whether it is operating under load
or unloaded. Variations in Steptimes can reveal early
signs of degradation or anomalies in actuators, valves,
or mechanical subsystems.
However, interpreting these time-based metrics
Zubieta, J., Izagirre, U. and Eciolaza, L.
Quantitative Analysis of Ambient Temperature Effects on Steptime Variations in Industrial Pneumatic Actuators.
DOI: 10.5220/0013733600003982
Paper published under CC license (CC BY-NC-ND 4.0)
In Proceedings of the 22nd International Conference on Informatics in Control, Automation and Robotics (ICINCO 2025) - Volume 1, pages 259-266
ISBN: 978-989-758-770-2; ISSN: 2184-2809
Proceedings Copyright © 2025 by SCITEPRESS – Science and Technology Publications, Lda.
259

without considering environmental factors such as
ambient temperature can result in systematic devia-
tions in timing being mistakenly classified as anoma-
lies. This limitation motivates the present work,
which aims to quantify the effect of ambient temper-
ature on multiple pneumatic systems under real oper-
ating conditions.
Context-aware anomaly detection has become es-
sential in industrial diagnostics, enabling differentia-
tion between deviations induced by external factors,
such as ambient temperature or workload, and gen-
uine faults arising from internal component degrada-
tion. Contextual anomaly detection methods strive to
capture anomalies between elements with some type
of relationship, which is often unknown beforehand
(Su
´
arez-Varela and Lutu, 2025).
Among these extrinsic variables, ambient tem-
perature is a critical but frequently overlooked fac-
tor. Temperature changes can alter air viscosity, pres-
sure stability, and mechanical tolerances—especially
in pneumatic components, which are highly sensi-
tive to such physical conditions. While prior research
and standards (International Organization for Stan-
dardization, 2010) acknowledge the general impact of
temperature on compressed air systems, existing stud-
ies tend to be qualitative or based on simulations.
The main objective of this work is to quantita-
tively analyze the impact of ambient temperature on
the cycle time of pneumatic actuators used in in-
dustrial production lines, focusing on Steptime vari-
ations observed in a PLC-controlled experimental
setup. The ultimate aim is to enhance context-aware
anomaly detection by distinguishing timing devia-
tions induced by environmental conditions from those
caused by actual component degradation. This dis-
tinction will contribute to more accurate and reliable
predictive maintenance in industrial environments.
The results show that while some pneumatic cylin-
ders exhibit a strong correlation between ambient
temperature and Steptime duration, others remain
largely unaffected. This actuator-specific variability
highlights the need for localized context-aware mon-
itoring rather than universal assumptions about tem-
perature sensitivity.
This work makes two main contributions, by pro-
viding regression analyses, calculating R
2
values, and
per-cylinder behavior across a large set of samples.
On one hand, the results demonstrate that Steptime
measurements can effectively capture subtle environ-
mental influences in industrial assembly lines. On
the other hand, the impact of ambient temperature in
highly automated industrial assembly lines has been
quantitatively measured, a factor often acknowledged
but rarely quantified in existing literature.
The findings are especially relevant for re-
searchers aiming to design robust, temperature-aware
anomaly detection strategies in real industrial au-
tomation environments, as well as for those seeking
to develop holistic and precise monitoring systems.
2 RELATED WORK
Understanding how component behavior evolves un-
der different conditions is essential for developing ro-
bust condition monitoring and fault detection strate-
gies in industrial systems. In recent years, there has
been increasing interest in using time-based metrics,
such as cycle durations or sub-cycle time intervals,
to assess machine health without additional sensors.
However, the interpretation of these metrics is often
done in isolation, without considering external influ-
ences or contextual information.
This section reviews existing research in two rele-
vant areas. First, the studies addressing the influence
of ambient temperature on the performance of pneu-
matic actuators have been examined. This study fo-
cuses primarily on these components. Subsequently,
an overview is presented of context-aware anomaly
detection approaches that integrate environmental and
operational context into fault-detection frameworks.
2.1 Environmental Influence on
Pneumatic Actuator Dynamics
The influence of temperature on pneumatic systems
has been recognized across various industrial studies,
although it is often addressed only indirectly or quali-
tatively. In their review of artificial neural network ap-
plications for HVAC and thermal systems, (Mohanraj
et al., 2012) mention that ambient temperature affects
system dynamics and energy efficiency, yet no quanti-
tative relationship is established between temperature
and actuator behavior or timing.
(Sorli et al., 1999) present a dynamic model of
pneumatic actuators based on thermodynamic princi-
ples, which includes temperature as part of the gas be-
havior within the actuator chambers. However, their
study is simulation-based and does not provide exper-
imental validation of how ambient temperature affects
the cycle time of real actuators.
(Fang et al., 2018) experimentally analyze the
effect of internal heating on the performance of a
pneumatic engine. Although the study includes tem-
perature variations and quantifies their influence on
output power and torque, it focuses on energy en-
gines rather than standard pneumatic actuators, and
ICINCO 2025 - 22nd International Conference on Informatics in Control, Automation and Robotics
260

the heating is applied internally rather than through
ambient changes.
(Park and Joung, 2022) examine how heat load
influences the thermal control performance of pneu-
matic loop heat pipes. While this work includes pre-
cise temperature control analysis, it is focused on
thermal management devices rather than actuator dy-
namics, and does not investigate timing or speed re-
sponses.
Finally, (Pham et al., 2020) explore the effect
of humidity on friction in pneumatic cylinders. Al-
though related, their focus is on surface interaction
and tribology rather than dynamic response, and tem-
perature is not examined.
Across these studies, the consensus is that envi-
ronmental conditions (temperature, humidity) can af-
fect pneumatic behavior, yet none of them offer a
quantitative correlation between ambient temperature
and pneumatic actuator cycle time. This gap is par-
ticularly relevant for condition monitoring and pre-
dictive maintenance, where timing deviations may
be misinterpreted if temperature effects are not ac-
counted for. The present work addresses this gap by
providing a regression-based experimental analysis of
ambient temperature influence on pneumatic actua-
tor timing, validated through a PLC-controlled exper-
imental setup representative of industrial systems, in-
corporating both pneumatic and electric actuators.
2.2 Contextual Anomaly Detection
Context-aware anomaly detection is increasingly rele-
vant in industrial diagnostics, as it distinguishes devi-
ations from extrinsic factors (e.g., temperature, work-
load) from true faults due to component degrada-
tion. In contrast, traditional methods often rely on
fixed thresholds and neglect context, leading to false
alarms.
(Chandola et al., 2009) classify anomalies into
point, contextual, and collective types. A point
anomaly occurs when a single instance deviates
strongly from the dataset, such as an unusually high-
value credit card transaction for a user.
A contextual anomaly is anomalous only in a
given context. Detection requires distinguishing con-
textual attributes (e.g., time, location) from behavioral
attributes (observed values). For instance, 5
◦
C may
be normal in winter but unusual in summer, or a high-
value purchase typical at holidays but suspicious oth-
erwise.
Collective anomalies arise when a group of re-
lated data points is anomalous as a whole, though
each may appear normal individually. They often
occur in time-series, sequences, or graphs—for ex-
ample, a normal-looking sequence of computer op-
erations that together indicate a cyberattack. Unlike
point anomalies, they depend on inter-point relation-
ships, and unlike contextual anomalies, they result
from internal patterns rather than environmental at-
tributes.
(Hayes and Capretz, 2014) proposed a two-stage
framework for Big Sensor Data, combining univari-
ate Gaussian detection with a context-aware post-
processing layer built on MapReduce k-means clus-
tering. By leveraging spatial, temporal, and opera-
tional metadata, the system remains scalable and re-
duces false positives. Tests on a commercial dataset
showed that context filtering improves anomaly de-
tection in large sensor networks.
Koio et al. (Juba and Koio, 2025) proposed a
wearable IoT framework that monitors occupational
hazards and falls by combining real-time analytics
with context (ambient conditions, posture, motion).
This approach reduces false positives and demon-
strates the value of context-aware models for worker
safety in high-risk environments.
3 EXPERIMENTAL SETUP
The experimental setup (Figure 1) includes four mod-
ules representing machines in a sequential line, pro-
grammed with GRAFCET methodology.
Figure 1: Experimental use-case.
Figure 2 illustrates the interaction between the
four modules. Module 1 operates independently,
while Modules 2, 3, and 4 are interdependent. Mod-
ules 2 and 3 function in parallel, although Module
2 exhibits a longer cycle time. Once both modules
complete their respective tasks, Module 4 initiates its
operation. Upon completion, the cycle restarts with
Modules 2 and 3. As Module 2 consistently deter-
mines the overall cycle duration, it constitutes a bot-
tleneck in the system, following widely accepted def-
initions in the literature (Azid et al., 2020), (Su et al.,
2022), (Yang et al., 2022).
Quantitative Analysis of Ambient Temperature Effects on Steptime Variations in Industrial Pneumatic Actuators
261
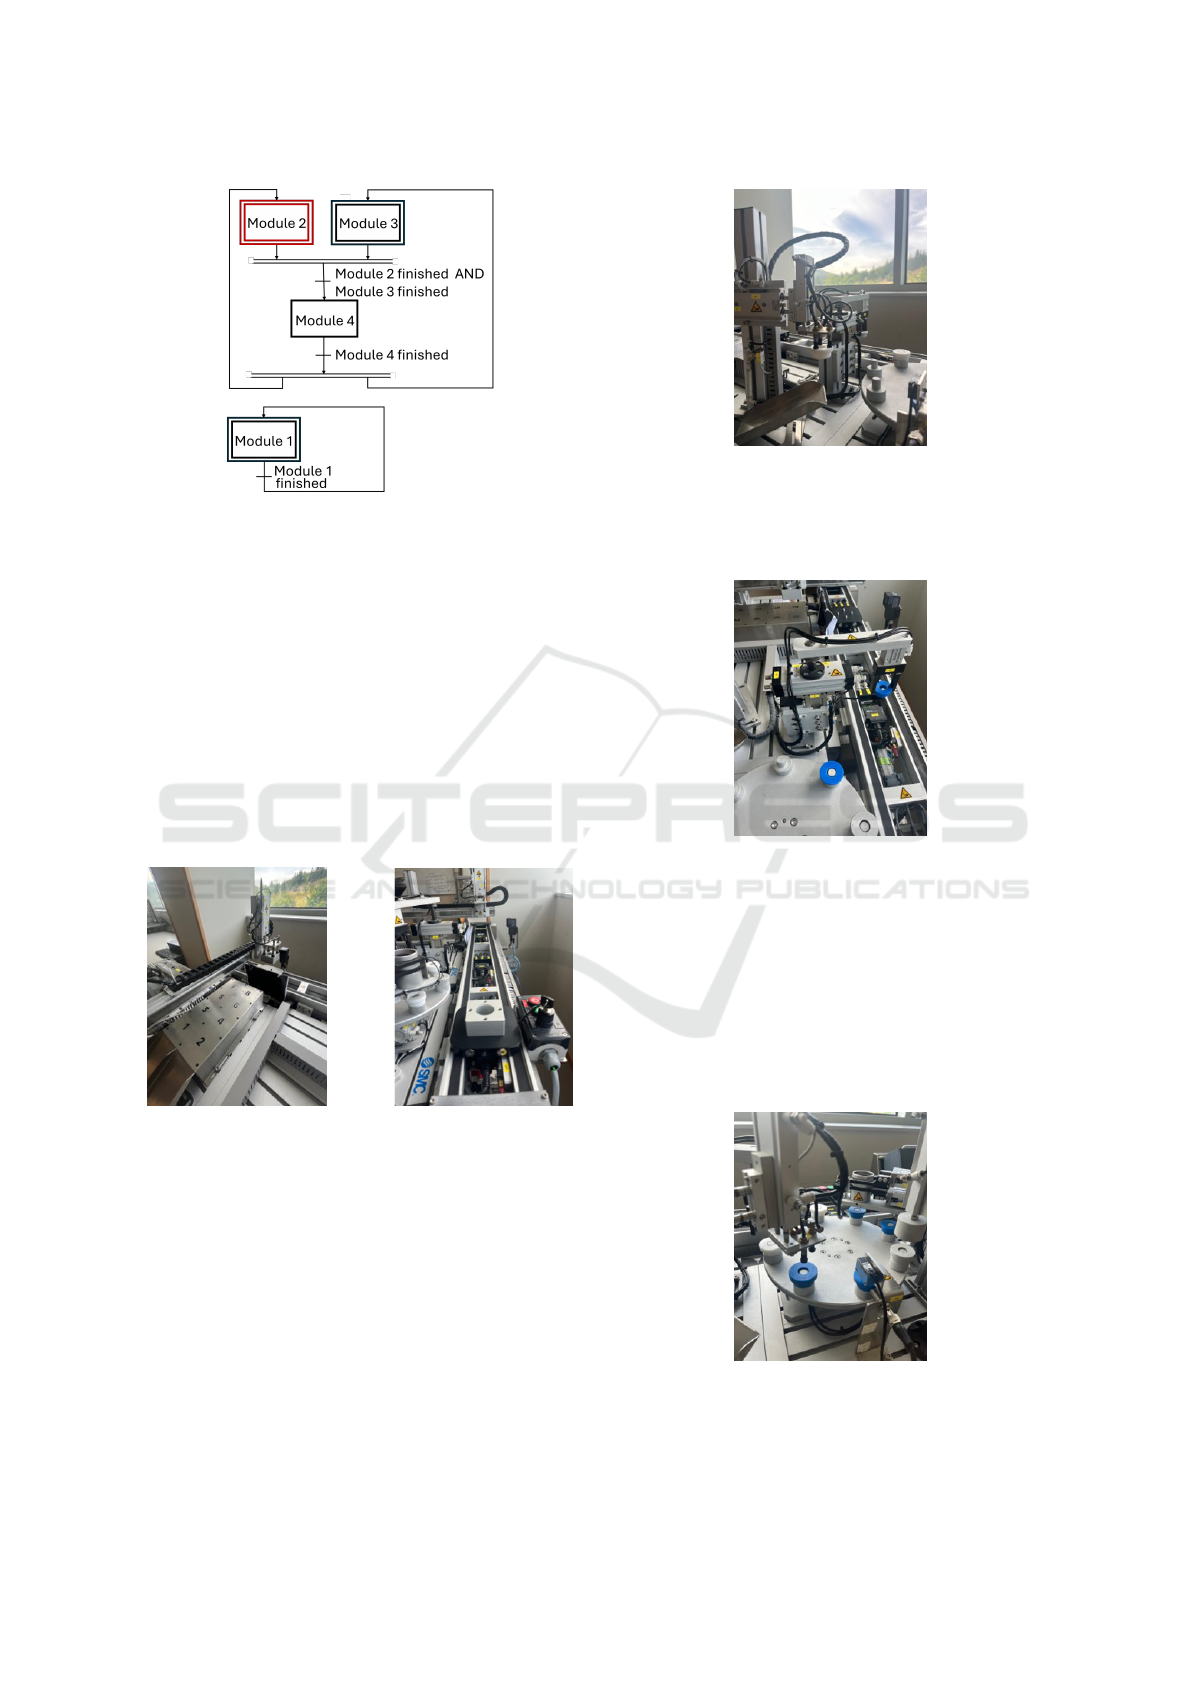
Figure 2: GRAFCET diagram from Modules 1, 2, 3 and 4.
The experiments were carried out using a Siemens
1516-F PLC, which acted as the central controller
throughout the study. System data were collected us-
ing the OPC-UA client-server communication proto-
col. The four modules comprising the experimental
setup are described below.
• Module 1: As can be seen in figure 3, it has two
main components: (a) a crane with a vacuum grip-
per actuated vertically by a pneumatic cylinder to
lift parts from a platform , and (b) a conveyor belt
that transports the part and returns it to its initial
position. The crane then replaces the part on the
platform, repeating the cycle continuously.
(a) (b)
Figure 3: Module 1 setup.
• Module 2: This module has a horizontal pneu-
matic arm with a vacuum gripper mounted on a
vertical pneumatic cylinder. The gripper picks a
part from a rotary platform, transfers it to a sec-
ond location, then returns it. The table advances
one position and the cycle repeats (Figure 4).
• Module 3: This module has an arm that rotates
around a vertical axis to reach two positions. At
the first, it picks a part from a rotary platform
with a pneumatic gripper on a cylinder; at the sec-
ond, it delivers the part. The arm then returns it
Figure 4: Module 2 setup.
to the platform, and once Module 2 completes its
task, the table advances and the cycle repeats (Fig-
ure 5).
Figure 5: Module 3 setup.
• Module 4: This module is composed of a rotary
table that receives two parts per cycle, one from
Module 2 and one from Module 3. Once both
parts are placed, the table rotates by one posi-
tion. Modules 2 and 3 then pick up the parts from
the new positions, perform their respective opera-
tions, and return the parts to the table. The plat-
form rotates again, completing the cycle and initi-
ating a new one (Figure 6).
Figure 6: Module 4 setup.
ICINCO 2025 - 22nd International Conference on Informatics in Control, Automation and Robotics
262
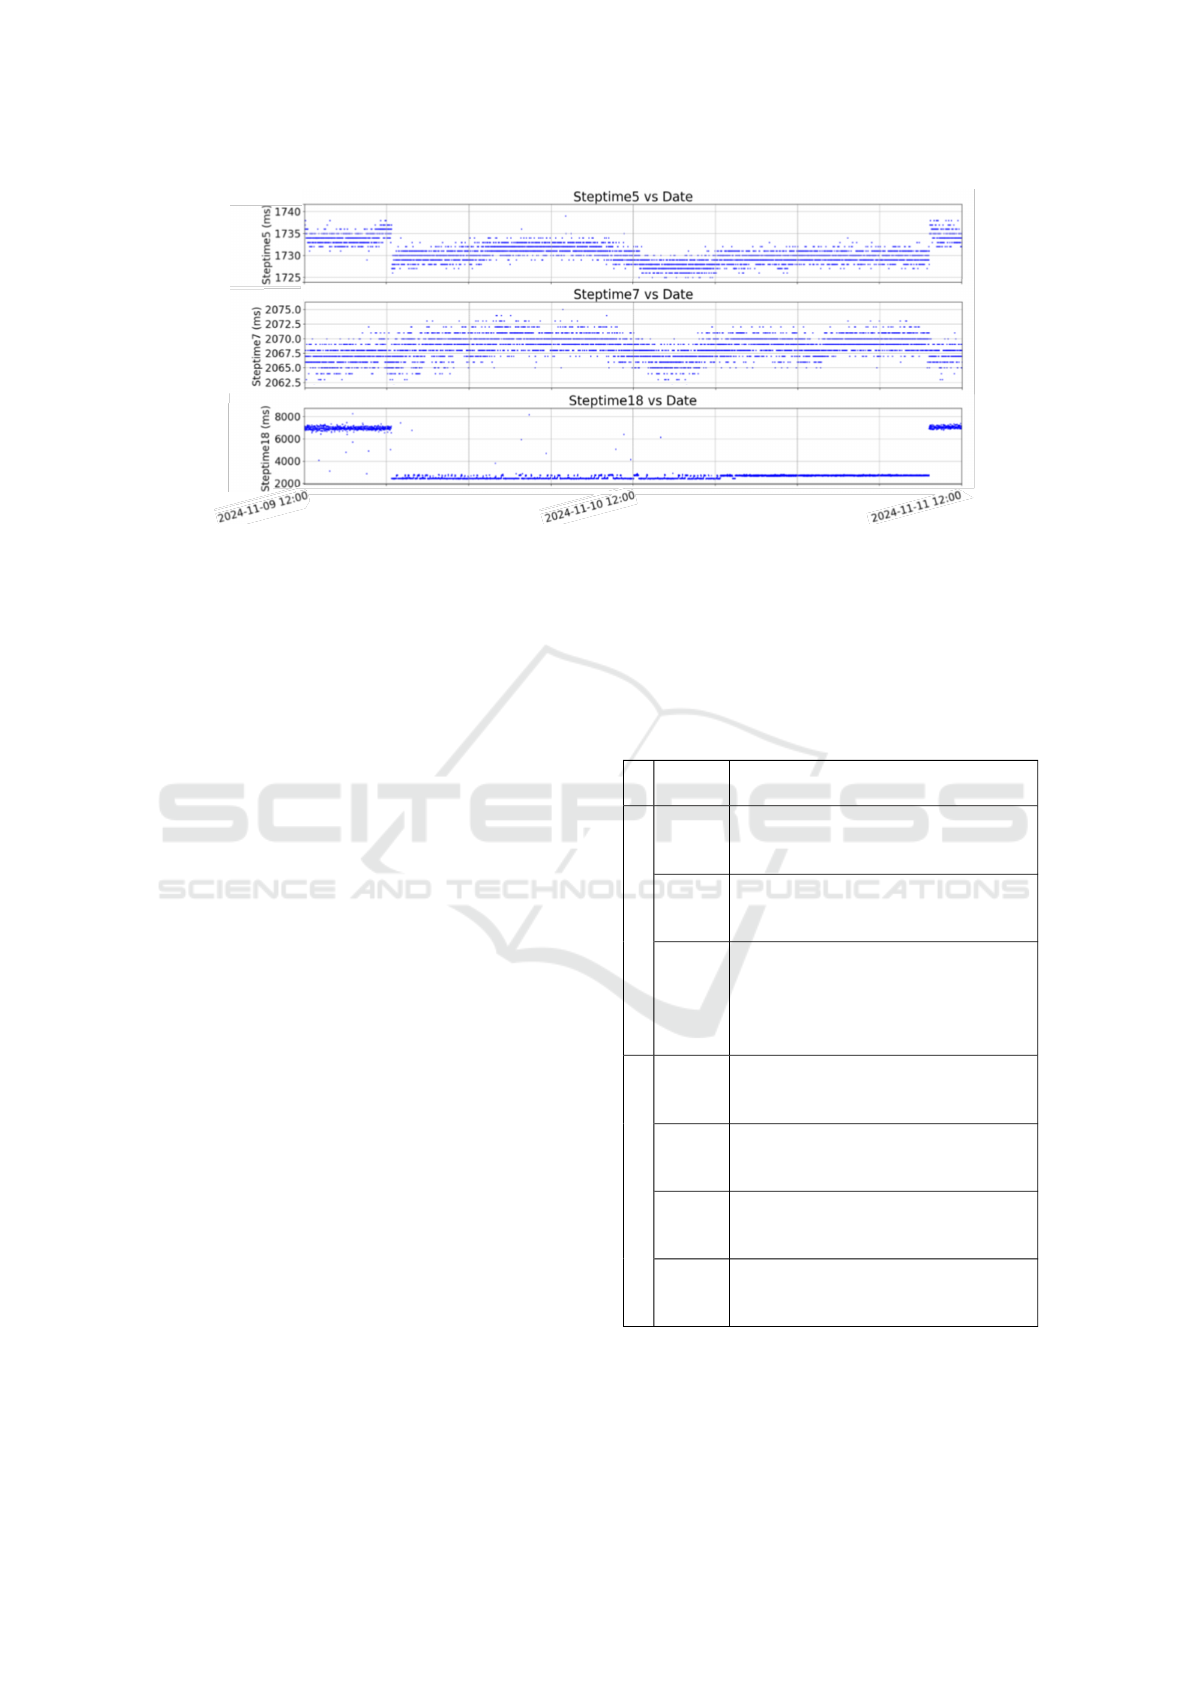
Figure 7: Time series data of Steptime5, Steptime7 and Steptime18 from the experimental use-case shown in section 3.
4 EXPERIMENTAL PROCEDURE
Environmental factors such as ambient temperature
can affect the behavior of components like pneumatic
cylinders and valves, thereby influencing the dura-
tion of operations within a production cycle. Previous
work (Zubieta et al., 2025) has shown that anomalies
in the production line are reflected in Steptime vari-
ations; accordingly, fluctuations in ambient tempera-
ture are also expected to impact Steptime values.
Experiments were carried out in a laboratory in-
sulated from outdoor conditions and equipped with an
air conditioning system that operated on working days
but was inactive during weekends. During weekdays,
additional heat sources included the automated se-
tups, robots, and researchers, resulting in temperature
oscillations between 22 and 25 °C. In contrast, week-
ends without air conditioning showed nearly constant
temperatures close to 22 °C.
Steptimes represent the interval between the acti-
vation and deactivation of a specific step in the pro-
duction line. Each time a step is deactivated, its Step-
time is recorded. Figure 7 illustrates the high resolu-
tion and precision of Steptime measurements, show-
ing the time series of Steptimes 5, 7, and 18 over two
days of uninterrupted machine operation.
The literature indicates that the effect of ambient
temperature in industrial assembly lines has been dis-
cussed only qualitatively, with few quantitative stud-
ies. To address this gap, Steptime measurements were
collected across a range of temperatures and statisti-
cally modeled against ambient temperature, with the
aim of assessing their thermal sensitivity and identi-
fying the most affected stages.
5 RESULTS AND DISCUSSION
Table 1 summarizes the definitions of the Steptimes
analyzed in this section.
Table 1: Definitions of Steptimes analyzed in Section 5.
Step-
time
Definition
Module 1
8, 3,
14, 17
Extension time of vertically
mounted pneumatic cylinders (rod
down).
5, 9,
11
Retraction time of a vertically
mounted pneumatic cylinder (rod
down).
15 Two parallel actions: retraction of
a vertical cylinder (rod down) and a
conveyor belt driven by an electric
motor; duration set by the longer
action.
Module 2
2 Extension time of a horizontally
mounted pneumatic cylinder (un-
loaded).
9 Extension time of a horizontally
mounted pneumatic cylinder (under
load).
3 Extension time of a vertical pneu-
matic cylinder (rod down, un-
loaded).
7 Extension time of a vertical pneu-
matic cylinder (rod down, under
load).
Results in Figure 8 show a clear visual relation-
ship between ambient temperature and Steptime 8.
The time-series and ambient temperature (yellow)
over six consecutive days of machine operation re-
Quantitative Analysis of Ambient Temperature Effects on Steptime Variations in Industrial Pneumatic Actuators
263
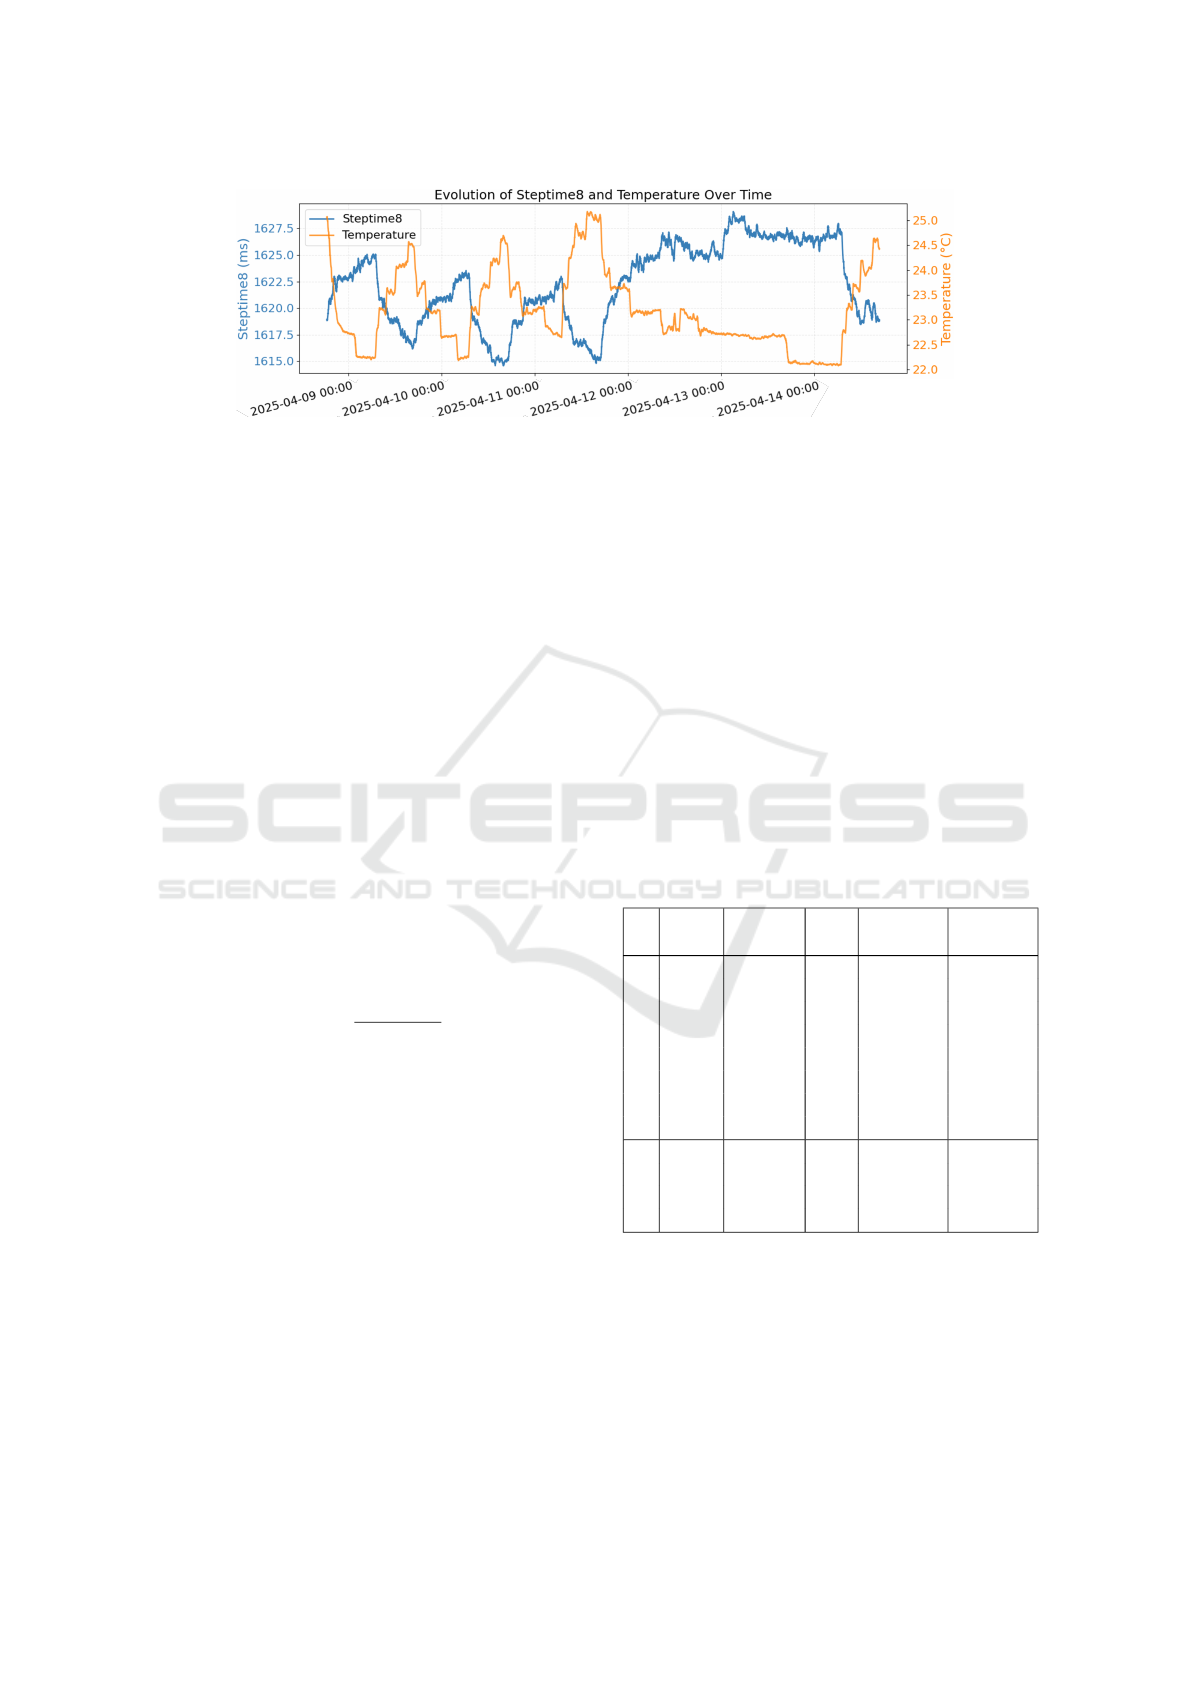
Figure 8: Temporal variation of Steptime 8 and ambient temperature.
veals a marked inverse correlation. During April
12–13, the temperature remained relatively stable,
corresponding to the weekend when the laboratory air
conditioning was turned off. Consistently, Steptime 8
also exhibited reduced variability in this period.
5.1 Statistical Analysis
To quantify the relationship between Steptimes and
ambient temperature, a simple linear regression
model was employed as shown in (1):
Y = β
0
+ β
1
X + ε (1)
where Y denotes the Steptime (ms), X the ambient
temperature (°C), β
0
the intercept, β
1
the slope, and
ε the random error term accounting for variability not
explained by the model. β
1
shows how much Step-
time (ms) is expected to change when the temperature
increases by 1 ºC.
On the other hand, model performance for each
Steptime was assessed using the coefficient of deter-
mination (R
2
), defined as in equation (2).
R
2
= 1 −
∑
(y
i
− ˆy
i
)
2
∑
(y
i
− ¯y)
2
(2)
where y
i
are the observed values of a given Step-
time, ˆy
i
the corresponding regression predictions ob-
tained with the equation (1, and ¯y the mean of the
Steptime. R
2
therefore expresses, for each operation,
the proportion of variability in its duration that is ex-
plained by ambient temperature. For example, R
2
=
0.59 for Steptime 8 indicates that 59% of its variation
is attributable to temperature changes, whereas values
close to zero imply that temperature has very little in-
fluence on those operations.
To determine whether the observed tempera-
ture–Steptime associations could be attributed to ran-
dom variability, we tested the null hypothesis that
the regression slope is zero (H
0
: β
1
= 0) for each
Steptime. A two-sided t-test was used to obtain p-
values, and statistical significance was interpreted at
α = 0.05. The p-value quantifies the probability of
observing a slope at least as extreme as the estimated
one if, in truth, temperature had no effect. We report
exact p-values (values < 0.001 shown as “< 0.001”
) as indicators of statistical evidence; practical rele-
vance is summarized by the slope (ms/
◦
C) and R
2
.
As in any linear regression, validity relies on the
assumptions of linearity, independence, homoscedas-
ticity, and approximate normality of residuals. These
assumptions were not formally tested in this study, but
the consistency of the results across different Stepti-
mes and modules supports the adequacy of a linear
model within the observed temperature range.
5.2 Statistical Analysis Results
Table 2 summarizes the regression results for the most
relevant Steptimes from Modules 1 and 2.
Table 2: Selected Steptimes from Module 1 and Module 2.
Step-
time
Slope
(ms/°C)
R
2
p-value n (sam-
ples)
Module 1
3 -4.02 0.57 < 0.001 13851
5 -5.64 0.53 < 0.001 13820
8 -3.97 0.59 < 0.001 13809
9 -5.56 0.45 < 0.001 13794
11 -5.64 0.53 < 0.001 13797
14 -3.98 0.57 < 0.001 13806
15 -3.14 0.05 < 0.001 13693
17 -3.49 0.50 < 0.001 13813
Module 2
2 -3.19 0.21 < 0.001 21697
3 -1.17 0.02 < 0.001 21704
7 -0.20 0.00 0.01 21681
9 -3.40 0.03 < 0.001 21700
For Module 1, all Steptimes exhibit negative slopes,
indicating that higher ambient temperature systemat-
ically reduces their duration. The effect sizes vary
between –3.14 and –5.64 ms/
◦
C, with Steptimes 5, 9,
and 11 showing the strongest sensitivities. The corre-
sponding R
2
values (0.45–0.59) suggest that between
45% and 59% of the variability in these Steptimes can
be explained by temperature. All associated p-values
ICINCO 2025 - 22nd International Conference on Informatics in Control, Automation and Robotics
264
are below 0.001, confirming that these trends are sta-
tistically significant.
By contrast, Module 2 Steptimes display weaker
and more inconsistent relationships with temperature.
Although the slopes remain negative, their magni-
tudes are generally smaller (–0.20 to –3.40 ms/
◦
C)
and the R
2
values are close to zero (0.00–0.21). This
indicates that ambient temperature explains little of
the timing variability in Module 2. Only Steptime 7
shows a marginally significant effect (p = 0.01) but
with negligible explanatory power (R
2
= 0.00).
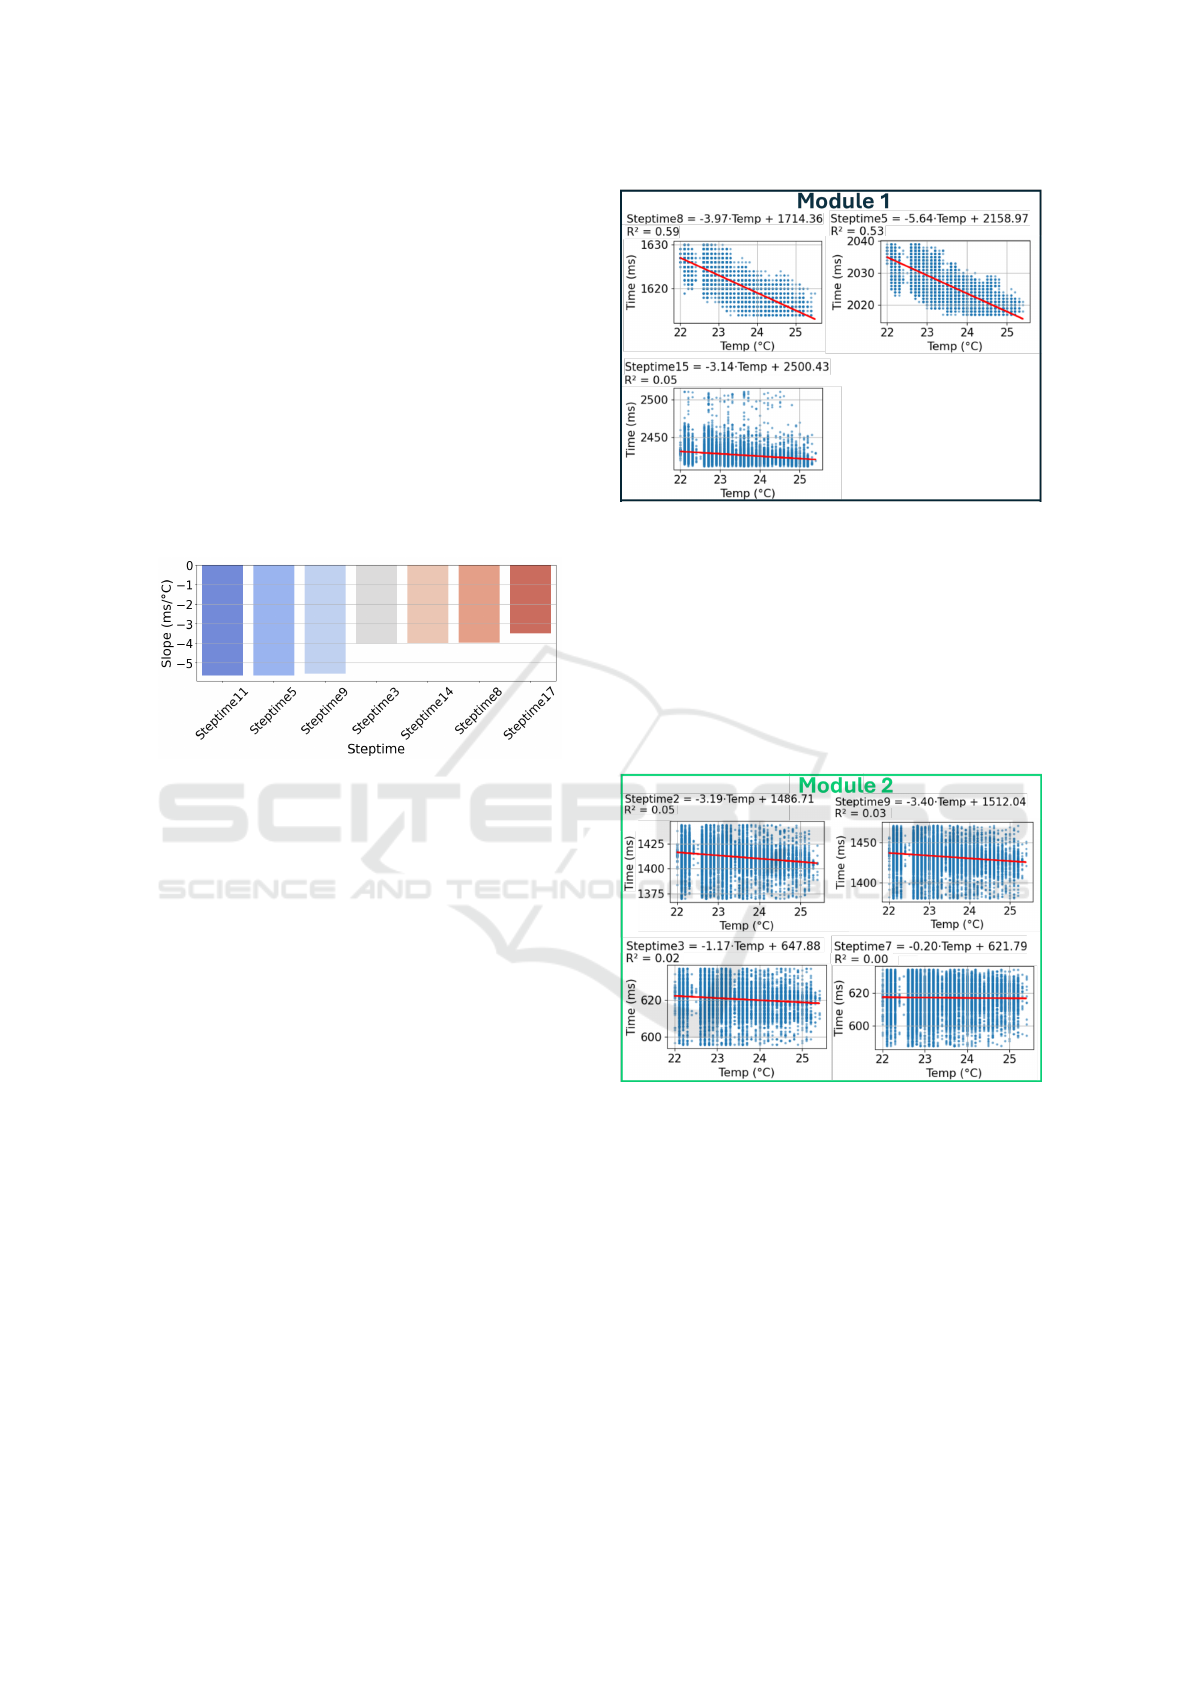
Figure 9 summarizes the most temperature-
sensitive Steptimes across the entire use case, pre-
senting the estimated slopes in ms/°C. Notably, all of
these steps belong to Module 1.
Figure 9: Estimated Temperature Sensitivity of the Most
Affected Steptimes in the use case (all from module 1).
Extension-related Steptimes (3, 8, 14, and 17)
exhibit more moderate slopes (between -3 and -
4 ms/
◦
C). This pattern suggests that the mechani-
cal and pneumatic dynamics during retraction phases
are more strongly influenced by temperature changes
than during extension phases, possibly due to dif-
ferences in internal chamber pressures and frictional
forces.
Figure 10 presents the linear regression results for
three representative Steptimes from Module 1. Step-
times 8 and 5 exhibit clear negative slopes, with esti-
mated coefficients of –3.97 ms/°C and –5.64 ms/°C,
respectively. Their corresponding R
2
values (0.59 and
0.53) indicate a moderate to strong linear correlation
between ambient temperature and Steptime duration.
These results confirm that both operations are sig-
nificantly influenced by temperature variations, with
Steptime 5 showing a particularly high thermal sen-
sitivity. In contrast, a conveyor belt and a pneumatic
cylinder operate in parallel within Steptime 15. Since
both actions start simultaneously and the belt is the
last to complete its task, the Steptime duration is de-
termined by the belt. Due to the mechanical nature of
the conveyor and its electric drive, it is barely influ-
enced by temperature changes, which explains its low
R
2
= 0.05.
Figure 11 shows regression results for four Step-
Figure 10: Linear Regression and R
2
between Stepti-
mes(ms) from Module 1 and Temperature(Cº).
times from Module 2. Although slopes remain nega-
tive, the very low R
2
values (0.00–0.05) indicate that
temperature explains little of their variability. Thus,
Module 2 timing is largely unaffected by ambient
temperature in the observed range. These differences
highlight the need for actuator-specific analysis, as
sensitivity may depend on movement type, load, or
control strategy.
Figure 11: Linear Regression and R
2
between Stepti-
mes(ms) from Module 2 and Temperature(Cº).
6 CONCLUSIONS AND FUTURE
WORK
This study presented a quantitative analysis of how
ambient temperature influences the cycle time of
pneumatic actuators in industrial production lines. By
monitoring Steptimes, the experiments demonstrated
that temperature measurably affects operation dura-
tions. A simple linear regression model quantified this
relationship through temperature coefficients (β
1
) and
coefficients of determination (R
2
). The effect mag-
Quantitative Analysis of Ambient Temperature Effects on Steptime Variations in Industrial Pneumatic Actuators
265

nitude varied across steps, suggesting that mechani-
cal configuration, load conditions, and movement dy-
namics shape each actuator’s thermal sensitivity.
These findings demonstrate that Steptime mea-
surements provide a sensitive, non-invasive indicator
of environmental influences in assembly lines. Incor-
porating such context into monitoring can improve di-
agnostics, reduce false alarms, and enable earlier de-
tection of genuine degradation.
On the other hand, no abnormal operation, faults,
or failures of the pneumatic actuators were observed
within the tested ambient range (22–25 °C). The influ-
ence of temperature was reflected exclusively in vari-
ations of Steptime values, without leading to perfor-
mance degradation or malfunction.
Future work will develop a context-aware mon-
itoring system to automatically distinguish whether
Steptime deviations arise from external factors or gen-
uine faults. The approach relies on correlations be-
tween Steptimes during normal operation: external
influences will be reflected consistently in these cor-
relations, whereas intrinsic faults will disrupt them.
ACKNOWLEDGEMENTS
The authors would like to thank the Basque Gov-
ernment and their HAZITEK program for supporting
project “GIZAK-IA”.
REFERENCES
Azid, I. A., Ani, M. N. C., Hamid, S. A. A., and Kamarud-
din, S. (2020). Solving production bottleneck through
time study analysis and quality tools integration. In-
ternational Journal of Industrial Engineering, 27(1).
Chandola, V., Banerjee, A., and Kumar, V. (2009).
Anomaly detection: A survey. ACM computing sur-
veys (CSUR), 41(3):1–58.
Fang, Y., Lu, Y., Yu, X., and Roskilly, A. P. (2018). Exper-
imental study of a pneumatic engine with heat supply
to improve the overall performance. Applied Thermal
Engineering, 134:78–85.
Garc
´
ıa, E. and Mont
´
es, N. (2019). Mini-term 4.0. a real-
time maintenance support system to prognosticate
breakdowns in production lines. In ICINCO (1), pages
180–187.
Garcia, E. and Montes, N. (2019a). Mini-term, a novel
paradigm for fault detection. In IFAC MIM 2019, 9th
IFAC Conference on Manufacturing Modelling, Man-
agement and Control, pages 165–170. IFAC / Elsevier.
Garcia, E. and Montes, N. (2019b). Mini-term, a novel
paradigm for fault detection. IFAC-PapersOnLine,
52(13):165–170.
Hayes, M. A. and Capretz, M. A. (2014). Contextual
anomaly detection in big sensor data. In 2014 IEEE
International Congress on Big Data, pages 64–71.
IEEE.
International Organization for Standardization (2010). ISO
8573-1:2010: Compressed air – Part 1: Contaminants
and purity classes. Standard, International Organiza-
tion for Standardization, Geneva. ISO 8573-1:2010.
Juba, I. and Koio, M. (2025). Wearable iot for dual mon-
itoring: Real-time occupational hazard detection and
resident fall prevention. International Journal of Age-
ing, Safety, healthcare & Science Innovation, pages
69–86.
Mohanraj, M., Jayaraj, S., and Muraleedharan, C. (2012).
Applications of artificial neural networks for refrig-
eration, air-conditioning and heat pump systems—a
review. Renewable and sustainable energy reviews,
16(2):1340–1358.
Park, C. and Joung, W. (2022). Effect of heat load
on pneumatic temperature control characteristics of
a pressure-controlled loop heat pipe. International
Journal of Heat and Mass Transfer, 186:122472.
Pham, V.-H., Nguyen, T.-D., and Bui, T.-A. (2020). Be-
havior of friction in pneumatic cylinders with different
relative humidity. Tribology in Industry, 42(3):400.
Sorli, M., Gastaldi, L., Codina, E., and de las Heras, S.
(1999). Dynamic analysis of pneumatic actuators.
Simulation Practice and Theory, 7(5-6):589–602.
Su, X., Lu, J., Chen, C., Yu, J., and Ji, W. (2022). Dy-
namic bottleneck identification of manufacturing re-
sources in complex manufacturing system. Applied
Sciences, 12(9):4195.
Su
´
arez-Varela, J. and Lutu, A. (2025). Uncovering issues in
the radio access network by looking at the neighbors.
arXiv preprint arXiv:2504.14686.
Yang, Q., Liu, W., et al. (2022). Production line balance
optimization design of s company. Manufacturing and
Service Operations Management, 3(1):57–71.
Zubieta, J., Izagirre, U., Eciolaza, L., de Buruaga, A. S.,
and Galdos, L. (2025). Step-time measurement:
A scalable sub-cycle time defining methodology for
anomaly detection and predictive maintenance in se-
quential production lines. Journal of Manufacturing
Systems, 83:1–11.
ICINCO 2025 - 22nd International Conference on Informatics in Control, Automation and Robotics
266
