
Comparative Web Performance Evaluation of Leading Mobile
Platforms
Aira Udaybhasker, Popuri Varun Kumar, Tangaturu Devendranath Reddy and Radha D
Department of Computer Science and Engineering,
Amrita School of Computing, Bengaluru, Amrita Vishwa Vidyapeetham, India
Keywords: Mobile Websites, Web Analysis, Performance Metrics, SEO, User Experience.
Abstract: In today’s world of the Internet, the performance of websites plays a vital role in driving business success and
keeping users satisfied. The paper aims at analyzing three popular sites categorized as the mobile site, known
in this work as Website 1, Website 2, and Website 3. The assessment focuses on factors such as page load
speed, mobile and desktop responsiveness, SEO optimization, user interface design and website traffic. The
metrics analyzed using tools such as SimilarWeb, Pingdom, and SEOSiteCheckup show how each impacts
users experience and search rankings. The identified insights help to answer fundamental research questions
by presenting the advantages and disadvantages of each platform and providing information about their
efficiency and possible improvement. From these findings, we provide practical implications to enhance
performance, usability, and user satisfaction of mobile websites. In conclusion, this research aims at
contributing to the current knowledge of the mobile web environment so as to inform the creation of more
effective and efficient platforms in the constantly growing international mobile market
1 INTRODUCTION
Web management still changes because of the
advancement of technology, and the internet acts as a
central tool in business online. While in the past such
companies used to directly interact with the
customers, today they are fully dependent on the
technology for listings, customers, and markets. The
specimens like Website 1, Website 2, Website 3 that
are popular mobile sites not only expand the coverage
for digital services but also improve the openness and
ease for users. The key to the effectiveness of a
mobile website is, therefore, the effective, easily
navigable, and well-structured content and clear and
effective interaction between all the players in the
process.
In the heavily saturated world of Internet, the
function of a mobile platform depends on web
performance factors and, in particular, SEO (Siji and
Goutham, 2019). Web analysis is important for such
purposes as users behavior study, SEO efficiency
evaluation, security issues, and utilization of the best
user experience. Elements such as page load time,
mobile friendliness, SEO report, and user
engagement help managers to discover opportunities
(Radeshkumaran and Harini, 2015), (Hegde and PM,
2014). These elements should be optimized in a
market where convenience is a key to success; a
perfectly optimized and convenient mobile platform
can help to become a leader on the market and
increase conversion coefficients. Web analysis, as a
result, can be a very effective means of understanding
the strengths, weaknesses and prospects of the sector
in the field of the online mobile platform.
This research performs a detailed web review of
three widely-used mobile websites, namely Website
1, Website 2, and Website 3 using SimilarWeb,
Pingdom, and SEOSiteCheckup. Evaluation of load
time, device performance, and search engine
optimization (SEO) optimization, user experience
(UX), design and layout, security measures, content
quality, and marketing strategies are the major areas
assessed in the analysis. In this paper, the results
obtained in data collection and web performance
analysis are used as the basis for comparing these
platforms.
The rest of the paper is structured as follows:
Section 2 presents the Literature Review, Section 3
explains the Experiment Setup in detail, Section 4
covers the Experimental Results, and Section 5
concludes by summarizing the findings and
suggesting future research directions.
Udaybhasker, A., Kumar, P. V., Reddy, T. D. and D, R.
Comparative Web Performance Evaluation of Leading Mobile Platforms.
DOI: 10.5220/0013733500004664
Paper published under CC license (CC BY-NC-ND 4.0)
In Proceedings of the 3rd International Conference on Futuristic Technology (INCOFT 2025) - Volume 3, pages 821-829
ISBN: 978-989-758-763-4
Proceedings Copyright © 2025 by SCITEPRESS – Science and Technology Publications, Lda.
821

2 RELATED WORK
In the current world, website performance and user
experience are now important aspects for
organizations, including those that operate in the
niche sectors such as travel and tourism. Close
examination of this literature survey will reveal a set
of studies on how to reap the benefits of website
optimization, how to use analytics and, in general,
how to improve the user experience across numerous
industries. Whether it is enhancing the loading time
of a website through image optimization and web
traffic analysis or the surprising role of data science
in helping inform strategic decisions for the web
presence these works emphasize the necessity of
having a powerful online platform. Especially
important to corporations that are managing patrons’
experiences, their study underlines the importance of
technology advancements toward increasing user
satisfaction, revenue, and resources. These findings
can be useful for building various strategies of web
sites in the customer-oriented industries to achieve
proper interchange and improvement of service
quality.
N. Kumaladewi et.al applied WebQual 4.0,
Importance Performance Analysis (IPA), and
GTmetrix to a study of user satisfaction and web
performance. A survey was conducted among 84
students and the obtained WebQual index average,
equal to 81% points, suggests the Web site quality,
with usability 79%, information quality 83%, and
service interaction quality 83%. The IPA analysis
brought out important areas of concern regarding
learnability or the ability to teach and discuss the site
as well as the ease of navigation improvement when
compared to the GTmetrix performance test that gave
the site a Grade C indicating general satisfactory but
could be improve technical performance. On balance,
the findings reveal that indeed the website is
positively evaluated; nonetheless, targeted
improvements are needed to increase users
satisfaction and performance of the website
(Kumaladewi, Rahajeng, et al. , 2023).
The work of Kumar et.al emphasize the
vulnerability of websites and stress the idea of
monitoring and analyzing the performance of Web
sites with respect to accessibility, usability and
security. SEOptimer and Qualidator are two tools
they use to perform audits, and these highlight crucial
changes that have to be made for users to have a better
experience as well as point out the strongholds in
security. It is for this reason that their studies show
the significance of such tools in determining and
addressing problems that may hamper user
interaction and put a spotlight on security threats. The
study recommends performance checks as a best
practice to ensure continuous quality and safety
measures of website in the growing technological
environment (Kumar, Kumar, et al. , 2021).
The study by Cociorva examines the flow
dynamics of a website from the e-business standpoint
using multiple analytics tools to measure critical
parameters, including performance, accessibility, and
SEO. This paper explains how detailed analytics can
be useful in understanding the patterns of the users
and improving the e-commerce business strategies to
create greater operational efficiencies. Cociorva’s
work strongly focuses on the systematic analytics of
the problems and their efficient solution in order to
enhance the satisfaction of users and increase
business outcomes. According to his study, there is a
critical use of web analytics to shape business
innovation and sustain competitive advantage in the
digital economy (Cociorva, 2023).
The study examined by Sova et.al use GTMetrix
inside the Waterfall development environment to
analyze the performance of the startup websites,
concentrating only on the metrics that affect the
usability of web resources and the efficiency of
business activity. They describe how performance
evaluations during the early stages can have a large
impact on the design and functional improvements
needed to make startups work. The study discusses
how KPIs remain crucial in offering developers
insights that inform the determination of user
experiences and general business results that are far
better than before. This research would be beneficial
for young enterprises that are interested in building
and improving their homepages through systematic
development and testing (Sova and Tasliza, 2024).
Jansen et.al provide a good and detailed overview
of methods for website evaluation with an emphasis
on web analytics and KPIs. They discuss extensively
the benefits and processes that are linked to log files
and page tagging in the capture of precise user
information. Such data when interpreted properly
assists in formulating strategic changes which will
make website functionality meet business objectives,
improve customer experience, and increase revenue.
Their research emphasizes on how businesses should
incorporate analytics into their plans, as well as the
importance of analytics in enabling organizations to
make sound decisions and improve customer
engagement across the digital space (Booth and
Jansen, 2010).
The research conducted by Treiblmaier et.al gives
a comprehensive account of the various website
analysis techniques and gives a comprehensive
INCOFT 2025 - International Conference on Futuristic Technology
822

comparison of the methods hence giving a framework
in the assessment and improvement of the usability of
website with the user. Thus, the presented paper is
useful for both academic researchers and web
developers as it categorizes and describes various
evaluation techniques and their effects. In addition to
revealing the state of the art in Web analysis, this
approach underlines the need for further adaptation to
users’ feedback and new developments to enhance
the Websites’ effectiveness and satisfaction rate
(Treiblmaier, , et al. , 2007).
Singh, V.K. et.al conducted a comparative
analysis of journal coverage among three major
databases: SciVerse Web of Science, Scopus, and
Dimensions database. In their study they used the
most recent master journal lists, showing big
discrepancies in terms of coverage; Web of Science
offered the least coverage while Dimensions provided
the broader and most extensive coverage. Thus,
99.11% of the 58,620 total journals inside of WoS are
also inside both Scopus and Dimensions, with
96.42% of Scopus records also inside of Dimensions.
The study also showed differences in article
production trends and disciplinary distribution for 20
countries between the years 2010 and 2018. The
result shows that the selection of database can
significantly affect the bibliometric analysis, and
also, this study raise the possibility that Dimensions
may be especially beneficial as it is more inclusive
(Singh, Hassan, et al. , 2021).
Md. Tutul Hossain et.al developed a web-based
application for performance testing of e-commerce
site with using the WebpageTest, PageSpeed Insight
& GTmetrix performance testing tools. This study
concerns with nine performance factors such as Load
Time, First Byte, Total Blocking Time and so on and
that will examine ten e-commerce sites in
Bangladesh. The framework is created in
PHP/MySQL, CSS/HTML, allowing entering a URL
to analyze its performance automatically. Findings of
this study show that; WebpageTest and GTmetrix
yielded detailed reports where site7 had the lowest
TBT of 0.03s and site10 the highest LT of 17.78s.
Further plans for update is creating the mobile version
of the site and increasing testings (Hossain, Hassan,
et al. , 2021).
Panduwika et.al aims at optimizing the SFV
website through using Google PageSpeed Insight
optimization techniques. The optimization included
resizing images by 30% and converting them to the
WebP file format improving the website loading
speed with consideration to image quality. These
optimizations brought the PageSpeed score from 47
to 63 proving their efficiency. From the user
satisfaction survey done on twenty participants it was
found that 82% of the users were satisfied with
enhanced performance of the website such as loading
speed and image quality. Thus, further validates the
need for a consistent evaluation of the site’s
performance and improvements in areas that affects
the User Experience (Panduwika and Solehatin ,
2024).
Abrar M. Almatrafi et.al aims at examining the
effect of employing web analytics tool on the
performance of small and medium enterprises SMEs
in Saudi Arabia focusing on the e-commerce
segment. In the present research, applying data
collected from interviews of eight employees of
SMEs, the authors aimed to investigate the use of
Google Analytics, Zid Analytics, and other tools.
Main outcomes observed with the use of web
analytics tools include positive impact on financial
and non-financial performance, enhanced decisions
making, and achievement of strategic objectives of
businesses. The study revealed that the application of
the above tools increases business performance,
clients satisfaction, and organizational effectiveness
(Almatrafi and Alharbi, 2019).
The study conducted by Subbalakshmi et.al
propose an original Automatic Analytical Model to
Recommend Web Services based on Singular Value
Decomposition for feature reduction. The system also
identifies preferred services by disregarding
additional and excessive characteristics in service
descriptions. Subsequent to the feature reduction
technique, other methods, such as single linkage and
ward linkage, are then used to compare the similarity
score. The methodology enhances on scalability and
accuracy in the selection of the web service the
ranked list of web services is obtained through
analyzing dendrograms as a consequence. This
approach enables the firm to deliver efficient as well
as customized service recommendations
(Subbulakshmi, Ramar, et al. , 2018).
Some problems of accessibility of Web sites have
been investigated by P.A Vargas et.al and also
detailed by the webometrics ranking in 22 hospital
Web site. Such matters include the evaluation
frameworks for the purpose of the world wide web
consortium websites proposed by them. In this
process, the level of accessibility were validated for
several hospital websites, therefore, to identify the
ease with which a website could be accessed
according to the WCAG 2.0 standards, WAVE
Accessibility Checker tool was used.In the present
work, commonly the most violated types of pattern in
the analysis was role, name and value which depict
13.4% followed by information and relationships also
Comparative Web Performance Evaluation of Leading Mobile Platforms
823

guidelines of content without text with 12.8 Because
of some of the described problems, the study has
revealed the need to establish and enhance the
accessibility practices of the Web in order to
continuously enhance website and further make
content accessible to all users including the disabled
people (Vargas, Acosta, et al. , 2018).
A comparative study conducted by Panchal et.al
reviews the sustainable developmental trends of
digital marketing approach, SEO, SEM. It also
reviews literature about patterns and developments in
digitalization of marketing practices. The authors
employ a discussional approach, examining a number
of tools like keyword analysis and bidding strategies
of SEM. This case involves observations of
competitor bid costs, and additional methodology
includes identifying optimal keywords. The findings
also demonstrate that both SEM and SEO are used for
audience remove The increasing competitiveness,
therefore, makes the optimisation a cornerstone to
success. Information about other attractives of digital
marketing platforms for instance, monitoring the
success of the campaigns is also given(Panchal, Shah,
et al. , 2021).
The study examined by Alfiana et.al focuses on
how SEO can be used in order to enhance Web page
ranking on search engines. The methodology used in
the development is the Waterfall model which
consists of analysis, design, code, test and maintain
phases. It means the optimization process involves
on-page and off-page optimization including title
tagging, meta description, keyword usage, and link
building. As the evaluation proves, the execution of
SEO strategies enhances website visibility and its
ranking on SERPs ultimately enhancing traffic to a
business(Alfiana, Khofifah, et al. , 2023).
From the related studies, it is evident that the
factors such as website optimization, user experience,
and web analytics, significantly improve
organizational performance in different sectors
including travel, e-commerce, and education. These
works stress the need to enhance website loading
speed, traffic monitoring, and use of analytical tools
in decision making with regard to customers’
satisfaction. Web analytics and optimization is one of
the prominent areas of internet marketing business
research that has been focused in the context of
enlightening on how business enterprises have
effectively applied it in achieving overall business
performance, customer engagement and service
deliveries. As such, the current paper goes further
from this ground by providing a comparative web
analysis of three major real estate platforms Using
SimilarWeb and SEO site checkup, we have assessed
the platforms on SEO readiness, User experience,
Marketing approach and strategies, thus giving a deep
insight on the platforms’ strengths and weaknesses.
3 EXPERIMENTAL SETUP
In this study, we selected three most frequently
visited mobile websites which we will call Website 1,
Website 2, and Website 3 for the full-fledged web
performance evaluation. The evaluation was
conducted using three specialized tools: It is
SimilarWeb, Pingdom, and SEOSiteCheckup. With
these tools, it was possible to evaluate such aspects as
Web Speed Load Times, Responsiveness on
Different Device Types, SEO, UX Design, Security
Options, Content Quality, Geographical Reach,
Marketing, Customer Relations, Quality of Content,
and User Engagement.
We also used SimilarWeb in order to assess
website and marketing trends to determine the web
traffic, characteristics of visitors, and marketing
initiatives adopted by each site. SEOSiteCheckup
offered its users an opportunity to have a
comprehensive look at the SEO health by assessing
factors such as security, speed, and other factors that
influence the SEO status. The websites’ real-world
performance across mobile was tested using Pingdom
for web speed load times and devices. These tools
allowed for making a statistical comparison of the
effectiveness of each website on all identified criteria.
Utilizing information from these sources, the research
provided an overall assessment that outlined the
relative advantage and disadvantage of each mobile
website and how each of them performed in terms of
SEO, usability, content quality, and level of user
engagement.
4 EXPERIMENTAL RESULTS
Mobile websites were assessed using tools such as
SimilarWeb, Pingdom, and SEOSiteCheckup.
SimilarWeb gives details of website traffic, the users,
and marketing trends, thus giving a real picture of
user interaction and usage of the site. Pingdom
measures page load times and finds areas that could
benefit from optimization in order to improve website
performance. These are the SEO aspects that
SEOSiteCheckup considers in the assessment of site
rankings and the reach of the target audience, namely
the keyword and backlink. Altogether, these tools
create a set of strategies for evaluating and improving
INCOFT 2025 - International Conference on Futuristic Technology
824
the user experience, SEO state, and platform
performance of Website 1, Website 2, and Website 3.
4.1 Web Speed Load Times
In the current world with increasing use of the
internet, the time that it takes for a website to load is
very important. It is also important to note that
Website A was found to load in an average of 0.81
seconds, which will not only greatly improve the
satisfaction level of users, but may also help increase
conversion rates not forgetting the improved search
engine visibility. On the other hand, Website B takes
more time to load, a total of 6.33 seconds, and this
can be very off putting to clients and their likelihood
of abandoning the site, pulling down its search
ratings. Website C load time was 2.6 seconds and it
also has some issues with the bounce rate as users
expect that a website should be loaded in less than 3
seconds. This analysis brings out the need for website
optimization; every website needs to improve on their
speed and one of the ways is through image
optimization, caching and reducing the number of
http requests.
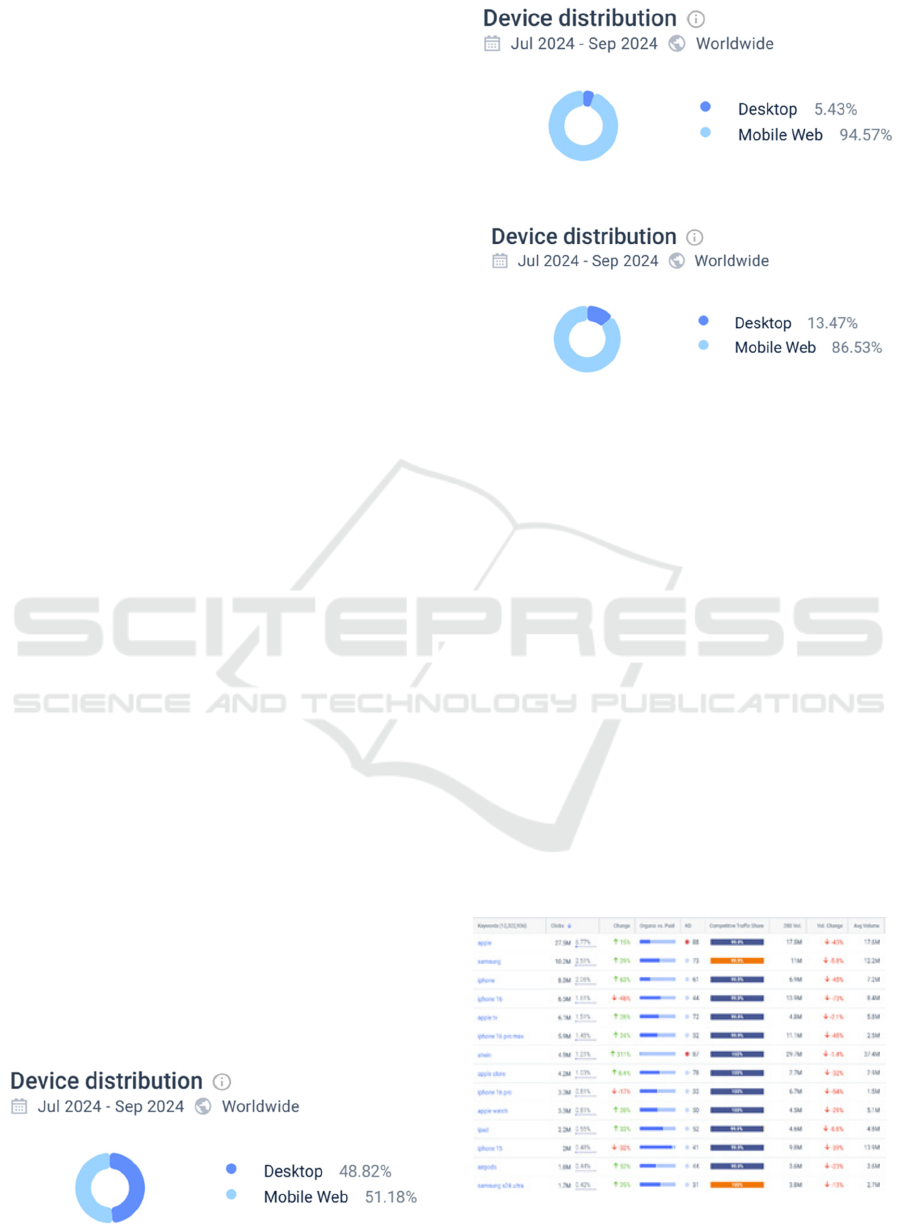
4.2 Responsiveness Across Devices
The examination of the responsiveness across the
devices shows the disparities of the user access
patterns for three websites. The analysis of the
visitor’s source for Website 1 reveals that almost
equal numbers of visitors use the desktop web
(48.2%) and mobile web (51.18%) as can be observed
in Fig. 1. On the other hand, Website 2 shows an
exclusive inclination to mobile web access with only
5.43% of the users using the desktop while 94.57%
users using the mobile as represented in Fig. 2 below.
Like Website 3, the mobile usage preference is
evident with only 13.47% of the users doing it on
desktop while 86.53% on a mobile as depicted in Fig.
3. This data clearly demonstrates the need to have
mobilefriendly websites since the majority of users
on Websites 2 and 3 use their mobile devices to
access the sites, thus merits the use of responsive
design to improve on the experience of users across
the devices.
Figure 1: Device Distribution of Website 1
Figure 2: Device Distribution of Website 2
Figure 3: Device Distribution of Website 3
4.3 SEO Optimization
As clearly indicated in the keyword data set, Website
1 (blue) receives the highest clicks with keywords
such as ‘apple’, ‘iphone’ and ‘apple tv’. This means
that Website 1 SEO strategy comprises focusing on
high search volume brand related terms, though there
is a dip in volume on some keywords like ‘iphone 16’
and ‘iphone 15’ which shows that there is need to
update some of the models. In Website 2 (orange),
there is a high traffic for the keyword “samsung”
indicating that there is a strong correlation between
brand and SEO keywords; however there is a slight
trend of decreased search volume and more focus
should be made on updating the site’s content on the
latest releases on Samsung. Website 3 (green) has a
good level of organic traffic for such keywords as
‘shein’, which means targeting e-commerce or
trending products successfully but the website nearly
has no visibility for other tech-related words. As
indicated in the Fig. 4, it was evident that each of the
Figure 4: Insights based on Top Keywords, Search Volume
and Competition
Comparative Web Performance Evaluation of Leading Mobile Platforms
825

websites could attain a better SEO by applying an optimum
content strategy for the new trends and using a combination
of the organic and paid approaches in the high competition
keywords especially those that have higher trend in the
search.
4.4 User Experience (UX)
Website 1 is rather famous for its clear and simple
navigation that allows achieving a great homogeneity
of UX across all the devices. User experience is
simple, intuitive navigation, and multiple integrated
tools and accessibility features that matter to users of
all skill levels. The smooth transition between the
hardware and software and the relatively fast
response time make the platform particularly
appealing to those users who prefer operation without
complications. Website 2 aims to provide more
functionality and user options in terms of
personalization, compared to Website 1. While this
approach is lovable by users who love to interact with
the different functionalities, the availability of many
options feels congesting to some users as they don’t
want many functions. On the other hand, Website 3
provides a relatively fresh look which is almost stock,
in comparison with the other two websites in the
project. It provides a clean, fast experience which still
stays true to the Android looks and feels while
introducing new elements exclusive to the tablet.
Website 3 is significantly widely used to help the
users because of the platform that is constantly
updating with new content and features.
4.5 Design and Layout
The first website follows the minimalism design
paradigm which focuses on the simplicity, the straight
lines, and the beauty of the design. This design
consistency across devices reinforces brand identity
and also creates an environment of familiarity to the
users. Its layout choices are about functionality and
usefulness, which helps to create a positive
interaction between design and usability. Website 2 is
less conservative and more experimental in design;
the use of bright and clear images and graphics make
this site eye-popping. It has been also a first mover in
bringing innovative device form factors like the
foldable type to enable new forms of engagement
with a device. This type of design is particularly
appealing to those who like to be on the leading edge
of technology. However, Website 3 does not bear a
complex design, which is set in simplicity and the
lack of glittering and sparkling elements. They
continue to keep their devices’ look professional and
simple for those who do not wish to have complicated
designs on their devices. While not as unique as the
other three, Website 3 is built on the premise of
durability and functionality.
4.6 Security Features
Website 1 is oriented to offering the maximum
protection with the main reference to the user’s
personal information. Some of the features include
facial recognition, app tracking transparency and the
closed environment that helps the company to shield
the user data from outside intruders. These measures
make it number one for users who want to have full
control of their information privacy. Website 2
equally provides reliable security measures of an
enterprise level such as Knox Security that is intended
to protect data and applications. The secure folder
feature also adds to the privacy, you have the option
to put your personal data and documents in another
secure encrypted space. Due to this high level of
security, Website 2 is especially suitable for business
persons and users who deal with confidential
information. Website 3 also provides basic security
options like fingerprint and face identification which
makes the safety needs of users meet. They don’t
have some of the more sophisticated enterprise
safeguards of Website 2, but for average personal
usage, they are sound.
4.7 Content Quality
Website 1 is very particular with the quality and
safety of the information that it provides to its clients.
It offers a limited number of ‘edgy’ applications,
contents and system updates that would meet high
standards of quality. The audience can be confident
that the application of strict standards can make
content safe and enhance its functionality. Website 2,
although has a great number of applications, some of
which are exclusive, services, and payment solutions,
can be of variable quality due to the use of third-party
software. This variety is to provide users a lot of
different tools and media, but some may get annoyed
by the fact that not everything is as polished as in
Website 1. Website 3 is all about basics of the website
with a simple content environment that has few if not
any preinstalled applications and services. It stands
well with those users who are most particular about
not cluttering their gadgets with unnecessary
applications and services since they can manage them
on their own.
INCOFT 2025 - International Conference on Futuristic Technology
826
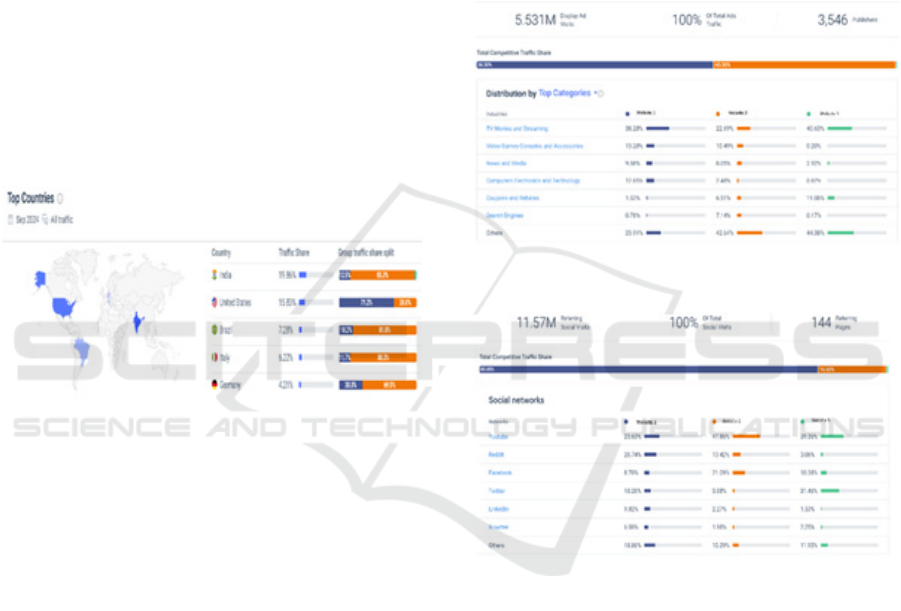
4.8 Geographical Coverage
The region preferences of the users are depicted in the
Fig. 5 which shows geographical coverage of the
websites. The largest number of visitors come from
India, while the second most number of visitors are
from the United States, third from Brazil, fourth from
Italy and fifth from Germany. Overall, the set data
points to different preferences of the three websites
within these regions. While Website 2 is clearly
preferred in the Indian, Brazilian, Italian and, to a
lesser extent, German-speaking regions, it is evident
that Website 2 has regional strengths. At the same
time, users of the United States demonstrate high
popularity of Website 1, which points to the different
actions and conditions in this area. The study also
highlights the differences in the competition and the
users’ preferences by geographical region, which is
important information when conducting a strategic
analysis and advertising campaigns.
Figure 5: Geographical Coverage
4.9 Marketing Strategies
According to the findings, Website 1, Website 2, and
Website 3 have different social media and display ads
plans. As seen in the chart Website 2 gets more traffic
from social media referral with YouTube and
Facebook showing a lot of emphasis on video content
and more engagement via such media platforms.
Website 1 is not far behind with a significant amount
of traffic from Reddit, linkedin and other social media
platforms which suggest a focus on discussion based
platforms where establishing brand affinity is the
priority. Website 3 is most effective on Twitter and
YouTube, with communicative, technically oriented
audiences in real-time and via video. As for display
ads, Website 1 is ahead in the “TV Movies and
Streaming” and “Video Games Consoles and
Accessories,” which presides over an entertainment-
centric approach towards digital advertising. Website
2 performs well at “Search Engines” and “Coupons
and Rebate”, which means it is highly likely to target
on search engine ads and coupon promotions, for
Website 3, it is high likely to be related to
entertainment, especially, streaming services. Every
brand has an opportunity to fine-tune its approach by
exploring the channels and content types that
generated high engagement even deeper to ensure
that their content gets to the right audience
effectively.
Fig. 6 shows a competitive analysis of social media
referral traffic for Mobile websites while Fig. 7
displays ad visits data for various publishers.
Figure 6: Competitive Analysis of social media referral
Figure 7: AD visits
4.10 Customer Support
Website A provides chat, email and phone support,
mostly giving positive reviews about effective
communication as Website B also provides support
over phone and email but the response time is not
always positive. It also provides an extensive FAQ
page, which may seem rather general for some users.
According to the type of furnishing, Website C has a
chat support.; there is immediate support available for
the users and FAQ section which incorporates the
guidelines of the users for improving the Website C
services making users a part of the community.
Comparative Web Performance Evaluation of Leading Mobile Platforms
827
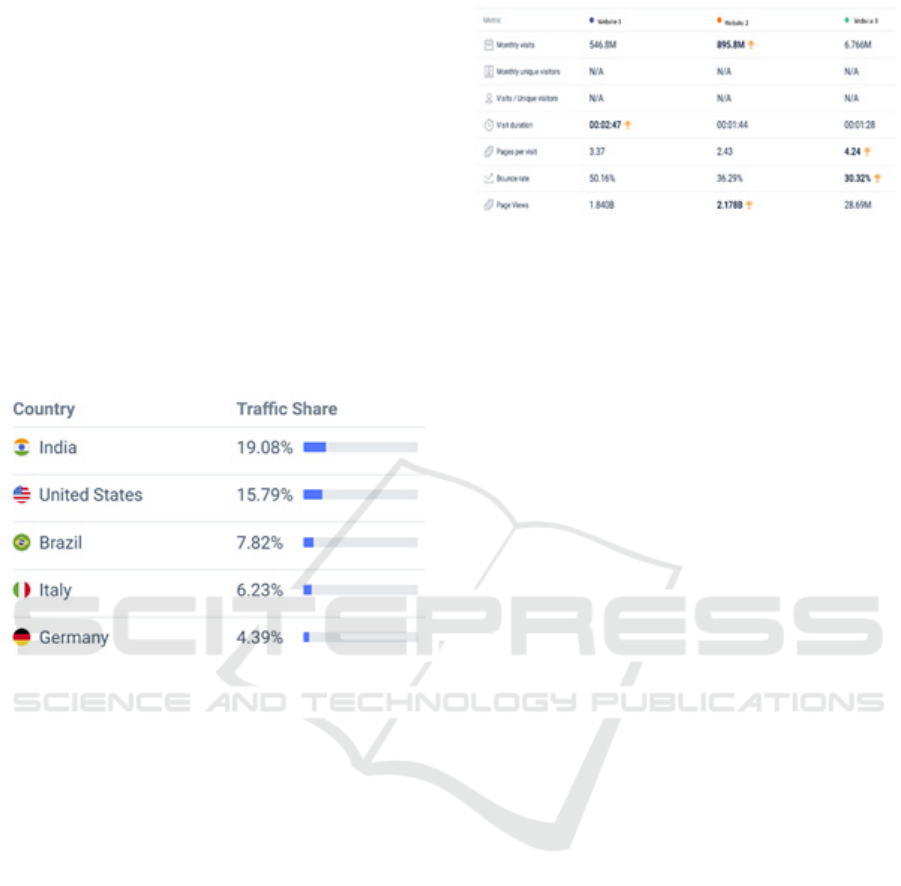
4.11 Community and User Engagement
The data in Fig. 8 reveals the traffic share distribution
across different countries, highlighting the global
reach and user engagement of the platform. India
leads with a substantial 19.08% traffic share,
suggesting strong user engagement and a significant
community base from this region. The United States
follows with 15.79%, indicating active participation
from North America. Brazil, Italy, and Germany also
contribute notable traffic shares at 7.82%, 6.23%, and
4.39%, respectively, reflecting a diverse international
user base. This distribution suggests the platform’s
appeal across various geographies, with India and the
United States being primary contributors to its online
presence and community engagement.
Figure 8: Traffic shares by different Countries
4.12 Metrices
This comparison of three Mobile Websites shows that
each has unique characteristics in terms of the
identified performance indicators. Website 2 is the
most visited with a monthly unique visitors of 895.8
million and total page views amounting to 2.178
billion. However, Website 1 has the main advantage
shown in the visitors’ average time spent on the site
of 2:47 which proves guests’ interest in Website 1
content. However, Website 3 with the least number of
monthly visit and page view has a higher number of
pages per visit 4.24 and the least bounce rate of
30.32% which shows that users are more engaged on
this website. These are shown in terms of traffic in
Fig. 9 where Website 2 has the upper hand, bounce
rate in which Website 1 has the lower rate, and
session per user in which Website 3 has a higher rate.
Figure 9: Comparison of Key Performance Metrics Across
Mobile Websites: Website A, Website B, and Website C
5 CONCLUSION AND FUTURE
WORK
Website 1 is suitable for users who want to get a
perfect, smooth experience with the focus on privacy
and uniformity. Because of its emphasis on quality
and ease of use, it attracts the users who are concerned
about company’s image and protection. Website 2 has
a broad customer base because of the wide products
and services offered as well as the unique designs that
appeal to the advanced and the basic users of the
devices. Its security aspect and marketing plan make
it suitable for almost any age group and ranks it high
in user preference. Website 3 offers affordable
premium devices, good UX, and a focus on the
community which will attract mature, technology-
oriented, cost-conscious consumers who like to be
involved in the development. It has been able to
create a brand that appeals to the younger more
technologically inclined users who are looking for a
quality service at an affordable price.
The following research could expand on the
effects of new technologies such as AR, AI, and VR
for each platform’s user interface and device
functions. Furthermore, reviewing environmental
sustainable activities that firm adopts including
material acquisition, recycling initiatives, and carbon
footprint would provide meaningful information on
how each brand respond to green consumption
attitudes. Another avenue is privacy since the various
geographies have their data protection laws; knowing
how each of the platforms handles laws such as
GDPR and CCPA would help in getting an
understanding of the level of data protection. Finally,
examining the stability and the rate of user inertia
regarding these platforms as well as loyalty after the
extensive introduction of new products and following
the changes in users’ preferences – this would
enhance understanding how such platforms evolve
and remain interesting and relevant on the market.
INCOFT 2025 - International Conference on Futuristic Technology
828

REFERENCES
N. Kumaladewi, E. Rahajeng, and B. Arif, ”Analyze and
Measure Website Quality Using WebQual 4.0,
Importance Performance Analysis Methods and
GTMetrix,” in *2023 11th International Conference on
Cyber and IT Service Management (CITSM)*,
November 2023, pp. 1- 6.
N. Kumar, S. Kumar, and R. Rajak, ”Website Performance
Analysis and Evaluation using Automated Tools,” in
*2021 5th International Conference on Electrical,
Electronics, Communication, Computer Technologies
and Optimization Techniques (ICEECCOT)*,
December 2021, pp. 210- 214.
A. Cociorva, ”Website Performance Measurements and
Related Analysis,” *Informatica Economica*, vol. 27,
no. 4, 2023.
E. Sova and S.S. Tasliza, ”Performance Analysis of
Business Startup Website Using GT-Metrix with
Waterfall Software Development Life Cycle Method,”
*International Journal Science and Technology*, vol.
3, no. 1, pp. 56-63, 2024.
D. Booth and B.J. Jansen, ”A Review of Methodologies for
Analyzing Websites,” in *Web Technologies:
Concepts, Methodologies, Tools, and Applications*,
2010, pp. 145-166.
H. Treiblmaier, ”Web Site Analysis: A Review and
Assessment of Previous Research,” *Communications
of the Association for Information Systems*, vol. 19,
no. 1, p. 39, 2007.
V.K. Singh, P. Singh, M. Karmakar, J. Leta, and P. Mayr,
”The Journal Coverage of Web of Science, Scopus and
Dimensions: A Comparative Analysis,”
*Scientometrics*, vol. 126, pp. 5113-5142, 2021.
M.T. Hossain, R. Hassan, M. Amjad, and M.A. Rahman,
”Web Performance Analysis: An Empirical Analysis of
E-commerce Sites in Bangladesh,” *International
Journal of Information Engineering and Electronic
Business*, vol. 11, no. 4, p. 47, 2021.
P. Panduwika and S. Solehatin, ”Performance
Measurement Implementation on the Smart Fisheries
Village Website Using PageSpeed Insight,” *Journal of
Soft Computing Exploration*, vol. 5, no. 2, pp. 161-
172, 2024.
A.M. Almatrafi and Z.H. Alharbi, ”The Impact of Web
Analytics Tools on the Performance of Small and
Medium Enterprises,” *Engineering, Technology
Applied Science Research*, vol. 13, no. 5, pp. 11753-
11762, 2023.
S. Subbulakshmi, K. Ramar, A. Shaji, and P. Prakash,
”Web Service Recommendation Based on Semantic
Analysis of Web Service Specification and Enhanced
Collaborative Filtering,” in *Intelligent Systems
Technologies and Applications*, Cham, 2018.
P. Acosta-Vargas, T. Acosta, and S. Lujan-Mora,
”Framework for ´ Accessibility Evaluation of Hospital
Websites,” in *2018 International Conference on
eDemocracy eGovernment (ICEDEG)*, pp. 9-15,
2018.
A. Panchal, A. Shah, and K. Kansara, ”Digital marketing-
search engine optimization (SEO) and search engine
marketing (SEM),” International Research Journal of
Innovations in Engineering and Technology, vol. 5, no.
12, p. 17, 2021.
F. Alfiana, N. Khofifah, T. Ramadhan, N. Septiani, W.
Wahyuningsih, N. N. Azizah, and N. Ramadhona,
”Apply the search engine optimization (SEO) method
to determine website ranking on search engines,”
International Journal of Cyber and IT Service
Management, vol. 3, no. 1, pp. 65-73, 2023.
Similarweb, ”Similarweb: Website Traffic and Analytics,”
[Online]. Available: https://www.similarweb.com/.
Pingdom, ”Pingdom Website Speed Test,” [Online].
Available: https://tools.pingdom.com/.
SEO Site Checkup, ”SEO Site Checkup: Analyze Your
Website SEO,” [Online]. Available:
https://seositecheckup.com/.
S. Rani Siji and S. Goutham, ”A Novel Approach for Meta-
Search Engine Optimization,” in *Ambient
Communications and Computer Systems*, Advances in
Intelligent Systems and Computing, vol. 904, Springer
Singapore, Singapore, 2019.
Radeshkumaran and N. Harini, ”Analysis of Web Server
Performance Based on Scheduling Algorithms,” in
*Proceedings of IEEE 2nd International Conference on
Knowledge Collaboration in Engineering
(ICKCE2015)*, 2015.
V. Hegde and S. PM, ”Web Performance Testing:
Methodologies, Tools and Challenges,” *International
Journal of Scientific and Engineering Research*, vol. 2,
pp. 67-73, 2014.
Comparative Web Performance Evaluation of Leading Mobile Platforms
829
