
Recovery and Readiness Monitoring Using Wearable Technology
in Young Triathlon Athletes
Ine De Bot
a
, Jasper Gielen
b
and Jean-Marie Aerts
c
M3-BIORES, Division Animal and Human Health Engineering, Department of Biosystems, KU Leuven,
Kasteelpark Arenberg 30, 3001 Heverlee, Belgium
Keywords: Readiness, Recovery, Triathlon Athletes, Wearables, Physiological Monitoring, Regression Analysis.
Abstract: This study explored the concept of ‘readiness to perform’ by monitoring twelve youth triathletes (under 23
(U23) and 19 (U19) years old) over three months using the Oura Ring. Physiological data from the wearable
were analyzed for all participants; subjective assessments of training intensity (Rating of Perceived Exertion
(RPE)) and recovery (Total Quality Recovery (TQR) questionnaire) were conducted only in the U23 subgroup.
Stepwise linear regression was used to describe five (Balance) Scores contributing to the Readiness Score
(RS). Subsequently, given the limited transparency of Oura’s algorithm, the RS was modeled using three
approaches: through (1) its real contributors (RMSE = 3.18, R² = 0.71), (2) approximated contributors via
regression and three additional contributors (RMSE = 4.09, R² = 0.52), and (3) directly measured variables
with RPE and TQR scores (RMSE = 4.88, R² = 0.29). Individual-level analysis was prioritized, though a
general model for describing the RS was also developed (RMSE = 3.48, R² = 0.60). Sleep emerged as the
primary contributor to readiness, followed by physical activity and resting heart rate.
1 INTRODUCTION
Technology has become integral to modern sports,
driving advancements in real-time monitoring of
athletes’ physiological data and performance
analysis. However, trust in the reliability and validity
of data provided by innovative technology remains a
key concern among coaches and practitioners,
highlighting the need for critical evaluation and
informed use of technological tools (Aerts et al.,
2025).
Training load quantifies the overall demand and
impact of a training session, both physical and
psychological, on an individual's body (Impellizzeri
et al., 2023). Readiness and recovery are
conceptualized in this study as the readiness to train
well and potentially perform well, and the adaptation
to the (previous) training load, respectively. These
processes are influenced and determined by various
factors, with training load and intensity being key
factors, as reflected by the fundamental concept of
training theory. This concept revolves around the
a
https://orcid.org/ 0009-0009-8357-6550
b
https://orcid.org/0000-0002-9459-836X
c
https://orcid.org/0000-0001-5548-9163
structured and systematic planning of exercise
sessions to improve athletic performance.
Furthermore, rest, sleep, nutrition, and various
physiological markers are critical determinants of
readiness and recovery. Adequate rest and sleep is
essential for comprehensive recovery, as also proper
nutrition, balanced in macro- and micronutrients and
hydration, is fundamental for optimal performance
(Walsh et al., 2021; Watson, 2017; Beck et al., 2015).
Equally relevant are physiological markers, such as
heart rate (variability) (HR(V)) and resting heart rate
(RHR), which reflect the state of the autonomic
nervous system (Schneider et al., 2018). Lastly, also
immunological, biochemical and hormonal markers
can be assessed in monitoring an athlete’s recovery
status. However, no single marker serves as a gold
standard in monitoring readiness and recovery.
Effective recovery monitoring of an athlete
requires a multidimensional approach, incorporating
subjective feedback and social factors to account for
non-training related factors, with objective
(physiological) data. Context is crucial, as
208
De Bot, I., Gielen, J. and Aerts, J.-M.
Recovery and Readiness Monitoring Using Wearable Technology in Young Triathlon Athletes.
DOI: 10.5220/0013733100003988
Paper published under CC license (CC BY-NC-ND 4.0)
In Proceedings of the 13th International Conference on Sport Sciences Research and Technology Support (icSPORTS 2025), pages 208-216
ISBN: 978-989-758-771-9; ISSN: 2184-3201
Proceedings Copyright © 2025 by SCITEPRESS – Science and Technology Publications, Lda.

physiological measures like HRV are sensitive to
non-training related stressors (Flatt et al., 2018).
This study investigates recovery and readiness of
young triathletes, hypothesizing that data collected by
wearable technology (i.e., Oura Ring), combined with
reference training load and recovery measures, will
demonstrate associations with the overall readiness
level of the athletes. Four main objectives are
formulated, focusing on the individual athlete.
The first objective is to map the athletes' current
sleep, training load, recovery and readiness patterns,
and accordingly investigate associations between the
corresponding collected variables. The second
objective involves modeling and approximating five
different (Balance) Scores that contribute to Oura’s
Readiness Score (RS), using (linear) regression
analyses. The third objective is to identify and
characterize the most significant contributors to the
athlete’s readiness, more specifically Oura’s RS, by
(linear) regression analyses. By this interpretable
method, insights into the compilation of the RS and
the importance of the most significant contributors
are identified. The fourth objective parallels the third,
but focuses on approximating the RS by including
physiologically measured variables and subjective
training load and recovery data in (linear) regression
models, rather than Oura's stated contributors.
2 MATERIALS AND METHODS
2.1 Participants and Study Design
Twelve young triathletes participated in this study.
Six U23 triathletes (3 female, 3 male, aged 19-21
years), with a weekly average amount of training
hours between 13 and 19 hours, of which on average
20% of the time is spent on running, 33% on
swimming, 40% on cycling and the remainder on
strength training. In addition, six U19 triathletes (2
female, 4 male, aged 17-18 years) participated in this
study (13 to 17 weekly training hours).
Over the course of three months, the participants
wore a personal Oura Ring (Gen3, firmware 2.9.32-
2.9.33) throughout both day and night, to monitor key
biometrics (i.e., Activity Scores; High/Low Activity;
Steps; Total Burn; Sleep Scores; Deep Sleep, Light
Sleep, REM Sleep, and Total Sleep Time; Respiratory
Rate; Sleep Efficiency; Sleep Latency; Sleep Timing;
RHR; Average HRV; Body Temperature; Recovery
Index; RS). Oura was selected because of its reported
technical quality, wearing comfort, data reporting and
data availability, and its functionalities within
monitoring readiness. This smart ring provides daily
scores (0-100), with the RS being a key metric in this
study. It is a composite measure, derived from, inter
alia, HRV, and recent sleep and activity levels,
providing an indication of the user's readiness to face
more challenges, or the need for rest and recovery.
Furthermore, participants were instructed to
report an individual rating of perceived exertion
(RPE) score per training session, on a 10-point scale,
ranging from ‘rest’ to ‘maximal exertion’. The
session RPE (sRPE) method, as proposed by Foster et
al. (2001), was used to calculate the total load index
of a session. Additionally, both subjective and
objective data regarding recovery were collected via
the Total Quality Recovery (TQR) questionnaire
(Kenttä & Hassmén, 1998). To maximize compliance
of the athletes and to avoid questionnaire fatigue
(Halson, 2014), the TQR questionnaire was preferred
above longer questionnaires, and no strict daily
completion was adopted; instead, participants were
instructed to complete the questionnaire at least twice
a week, enabling retrospective reporting for multiple
past days. The TQR scale consists of two parts: TQR
perceived (TQRper) – perceived recovery on a 6-20
scale, ranging from ‘no recovery at all’ to ‘maximal
recovery’ – and TQR action (TQRact) – a more
objective score based on an athlete's engagement in
recovery actions across four domains: nutrition, sleep
and rest, relaxation and emotional support, and
stretching and cooling-down. Research has confirmed
the effectiveness of TQR in monitoring training load
effects and individual responses, for both daily and
less frequent (e.g., microcycle) implementation
(Nässi et al., 2017; Debien et al., 2020). No explicit
additional interventions were performed that deviated
from their daily routines and training schedules.
RPE and TQR data were not collected for U19
participants due to their late inclusion and the non-
routine recording of subjective data. In total, Oura
data were recorded over an average of 77.83 (± 6.70)
days, with ~8% missing data due to, inter alia, device
non wear. For the U23 population, an average number
of 76.67 (± 19.55) TQRper, 70.00 (± 14.30) TQRact,
and 168.83 (± 50.23) RPE datapoints were obtained.
The study was approved by the Social and Societal
Ethics Committee of KU Leuven (G-2023-7108-R2).
2.2 Data Processing and Analysis
Data processing comprised three main phases (Figure
1), focusing on (linear) regression analysis. While the
true relationships may be non-linear, linear models –
which additionally allow the inclusion of interaction
terms – were chosen for their interpretability and
alignment with the study’s exploratory objectives.
Recovery and Readiness Monitoring Using Wearable Technology in Young Triathlon Athletes
209
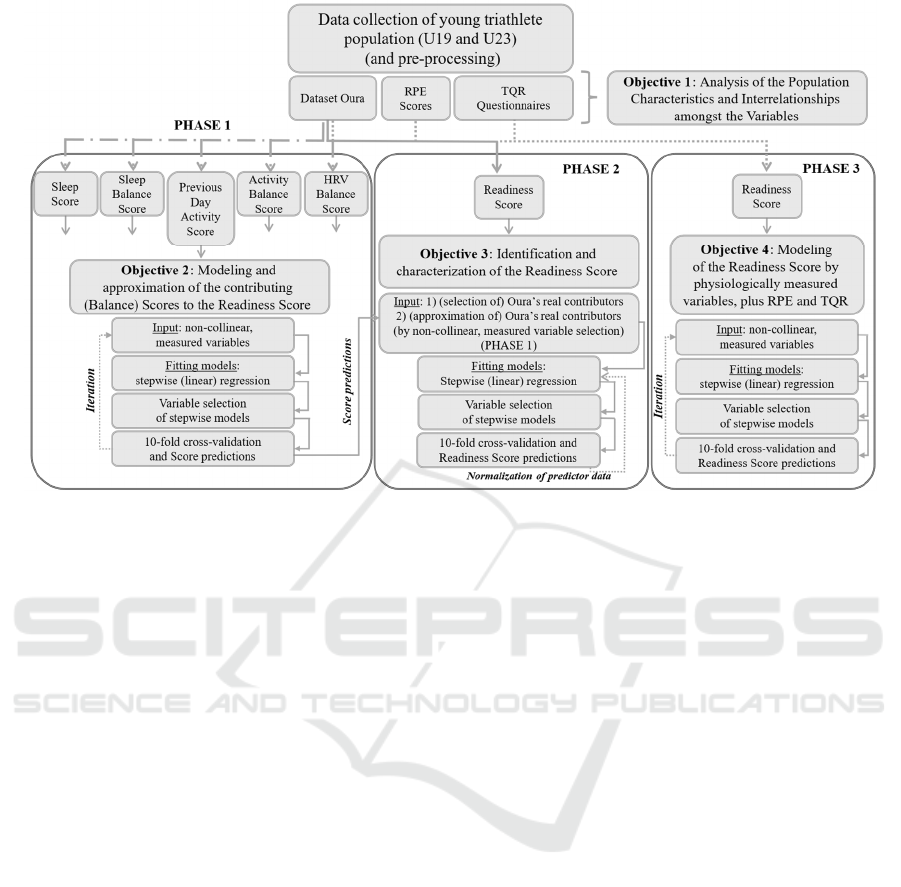
Figure 1: Overview of the implemented three-phase data processing flow for analyzing Oura’s Readiness Score.
RPE = Rating of Perceived Exertion; TQR = Total Quality Recovery.
Model performance for fitting and predicting the
investigated scores per individual athlete was
assessed using the (adjusted) coefficient of
determination (R
(a)
²) and root mean squared error
(RMSE). Overall model significance was assessed
through a global F-test, as were individual estimated
regression coefficients evaluated for significance
(with 𝛼 = 0.05). Model validation for each athlete's
scores was performed using 10-fold cross-validation.
Prior to regression analysis, the assumption of
independence among predictor variables was
assessed by investigating for multicollinearity, with a
condition index tolerance level of 30 and a variance-
decomposition proportion tolerance of 0.5
Phase 1 (Figure 1) analyzed five scores provided
by Oura, each contributing to the RS. For these
scores, individual regression models were
constructed, using non-collinear, actual measured
variables from the Oura dataset (i.e., no composite
measures) that best represent the respective score, as
predictor data. Oura's Recovery Index was not
approached as no measured variables allowed
approaching this score. Following data-fitting,
athlete-specific predictor variable sets were defined.
Subsequently, in a cross-validation loop, a regression
model was reconstructed for each individual score
and athlete, based on the aforementioned selection of
predictor variables. Through iterative variable
subsetting, an average performance of R² > 0.75 and
RMSE < 4.00 for each of the five investigated scores
was pursued. The resulting predictions from this
phase served as inputs for Phase 2.
In Phase 2 (Figure 1), Oura’s RS was analyzed in
more detail, adopting a structure analogous to Phase
1. Regression models were developed distinguishing
between two predictor sets: (1) Oura's real
contributors, and (2) approximations of these
contributing scores derived from Phase 1 combined
with three additional factors (i.e., RHR, Temperature
Deviation, and Recovery Index). These eight
variables collectively represent Oura's official RS
contributors. After the final cross-validation step and
obtaining a model with a proper accuracy, a second
model fitting on the corresponding, this time
normalized, predictor data was performed. This
process was performed for the models based on the
real contributors only, where variable importance was
derived from the fraction of its estimated model
coefficient to the total absolute sum of the different
coefficients, excluding the intercept. Moreover, an
attempt was made to obtain a general model that
might approximate the RS for each of the athletes.
In Phase 3 (Figure 1), again an analogous
structure was adopted. Unlike previous phases, this
phase expanded the potential predictor variables
beyond Oura's stated contributors by including all
measured, non-collinear Oura variables, alongside
RPE and TQR scores. This allowed the construction
and evaluation of regression models representing the
RS by using an alternative subset of variables.
icSPORTS 2025 - 13th International Conference on Sport Sciences Research and Technology Support
210

3 RESULTS AND DISCUSSION
3.1 Population Characteristics and
Variable Interrelationships
3.1.1 Sleep Features
Adequate sleep is vital for comprehensive recovery,
encompassing physical, psychological, immune, and
endocrine functions, whereby insufficient sleep can
impair performance and hinder recovery (Walsh et
al., 2021; Watson, 2017). On average, the U23
athletes slept 7.94 (± 0.58) hours, and the U19 athletes
7.86 (± 0.33) hours, including daytime naps. Our
observations align with previous research suggesting
that athletes often report sleep durations below
recommended levels, which may be associated with
poorer sleep efficiency and quality compared to non-
athletes. Contributing factors include demanding
training and competition schedules, travel, and
increased stress levels (Roberts et al., 2019).
The U23 population averaged a Sleep Score of
80.45 (± 5.72), while the U19 athletes averaged 79.79
(± 3.91). The lowest average Sleep Score (i.e., 71.39
± 8.68) was associated with the least sleep hours,
while the highest average Sleep Score (i.e., 86.53 ±
4.01) was associated with the most sleep hours. This
strong association between sleep duration and Sleep
Score was confirmed by significant positive
correlations in all U23 athletes (p < 0.05), yielding
daily and seven-day average 𝑟 values of 0.74 and
0.65, respectively. Furthermore, Sleep Scores were
significantly correlated with RS for two U23 athletes
(p < 0.05), with daily 𝑟 values of 0.70 and 0.75
(seven-day average 𝑟 values of 0.68 and 0.87).
Due to collinearity among several sleep features,
total sleep duration was selected at the beginning of
the regression analyses without prioritizing collinear
variables with this variable.
3.1.2 Cardiac Features
Two overnight RHR variables – lowest and average –
were analyzed. As anticipated, these variables
showed an average daily and seven-day average
correlation of 𝑟 = 0.85, and 𝑟 = 0.90, respectively. The
average RHR was on average 49.96 (± 4.68) bpm for
the U23 athletes, and 51.35 (± 2.80) bpm for the U19
athletes. These lower values reflect exercise-induced
cardiac adaptations that enhance blood-pumping
efficiency, commonly observed in athletes compared
to non-athletes (Nystoriak and Bhatnagar, 2018).
The average HRV, as measured overnight and
provided as the rMSSD, ranged between 57.45 (±
9.51) ms and 170.73 (± 26.95) ms. Due to significant
inter-individual variability in HRV, focusing on
individual trends is a more meaningful approach than
comparison to others. Furthermore, since inconsistent
findings have been observed in scientific literature
when based on daily measurements, it has been
suggested that weekly or seven-day moving averages
offer a more valid approach (Plews et al., 2013).
The average RHR exhibited a significant
correlation (p < 0.05) with the average HRV for two
U23 athletes (i.e., 𝑟 = −0.71 and 𝑟 = −0.94 for daily
measurements, respectively, 𝑟 = −0.89 and 𝑟 = −0.95
for seven-day averages). One U19 athlete showed a
significant seven-day average correlation of 𝑟 = −0.70
between the average RHR and HRV. Hence, average
RHR and HRV appear to be inversely related.
Moreover, with consistently negative (significant)
correlation results, it was observed that the RS and
average RHR are likewise inversely correlated (i.e.,
daily and seven-day average correlation values up to
𝑟 = −0.68 and 𝑟 = −0.87, respectively).
Due to collinearity between average and lowest
RHR, the average RHR was preferred for further
analysis due to its greater robustness and reliability.
3.1.3 Readiness Score
An average RS of 79.31 (± 2.19) was observed. The
RS exhibited no significant high correlations with
other variables, besides these previously mentioned.
Given the extremely low and mostly non-
significant individual correlations, and daily average
values of 𝑟 = 0.01, 𝑟 = 0.07 and 𝑟 = 0.16 between the
RS and sRPE, TQRact and TQRper, respectively, in
the U23 group, the RS did not correlate with these
variables. This suggests that the RS was not reflected
in the athletes’ training load or recovery ratings. Since
training schedules were pre-determined, without
considering Oura data on the actual training day, the
lack of correlation likely stems from the absence of
RS data integration into the decision-making process.
Notably, it may be assumed that a recovery score is
linked to a readiness score for the athlete. However,
the results indicated no significant link between the
RS and TQR scores. Due to the lack of data, no
conclusions could be drawn for the U19 group.
3.1.4 Recovery Measures
The U23 athletes had an average TQRper score of
14.14 (± 1.42), indicating a ‘reasonable’ to ‘good’
recovery, and an TQRact score of 14.62 (± 1.42).
The two-part TQR questionnaire provides
comprehensive insight into training responses, as a
discrepancy between perceived recovery and
Recovery and Readiness Monitoring Using Wearable Technology in Young Triathlon Athletes
211

recovery actions can indicate maladaptation to
training load. Moreover, a practical guideline
suggests aligning TQRact and TQRper scores with
RPE ratings (reported on or converted to a 0-20 scale)
for adequate recovery (Kenttä & Hassmén, 1998).
However, in this study, consistently low and non-
significant correlations were observed between TQR
scores and the (s)RPE scores on the one hand, and the
two TQR scores among themselves on the other hand.
3.2 Investigation of Oura's (Balance)
Scores Contributing to the
Readiness Score
3.2.1 Sleep Score and Sleep Balance Score
Oura’s Sleep Score claims to reflect how well the
athlete slept each night, and is determined by the total
sleep duration, sleep efficiency, restless sleep, REM
sleep duration, deep sleep duration, sleep latency and
sleep timing. For the U23 population, the cross-
validation of the established models yielded an
RMSE between 2.07 and 3.85, with the exception of
one athlete (RMSE = 8.62). Hence, the model made
an overall error of 2 to 4 units out of 100. Equally, a
large fraction of the variance in the Sleep Score was
explained by all models, represented by an R² of 0.69-
0.86, with the exception of one athlete’s model that
performs worse than a simple mean-based prediction.
For the U19 population, an average RMSE of 2.86
and R² of 0.77 were obtained from cross-validation.
Total and deep sleep duration consistently
emerged as the key determinants of the Sleep Score
across all models, whether or not with an additional
interaction effect. Sleep efficiency was also a crucial
predictor, excluded from the model for only one
athlete. The primarily positive regression coefficients
for these three predictor variables indicate their
positive impact on the Sleep Score. Conversely, sleep
latency and timing were the least incorporated into
the models. Sleep latency consistently exhibited
negative regression coefficients, suggesting that
longer nocturnal wakefulness negatively impacts the
Sleep Score. The effect of sleep timing was
inconsistent. These findings underscore the critical
importance of sleep quantity and the deep sleep stage
for Sleep Score determination, aligning with their
recognized roles in physical recovery.
The Sleep Balance Score was approximated by a
combination of total sleep duration with sleep
efficiency. Given it is a Balance Score, time-shifted
data from the last 14 days, were presented as predictor
data. The validated models for the U23 population
exhibited an average RMSE of 3.98 and an R² of 0.75.
The U19 models demonstrated a considerable lower
performance (i.e., average RMSE of 5.30 and R² of
0.56, excluding one athlete). It is reasonable that the
excluded athlete's model exhibited substantial
overfitting, as indicated by an RMSE > 20 and an R²
< 0. The inclusion of 17 predictor variables in this
athlete’s model likely introduced model complexity
beyond the data's explanatory capacity.
The significantly explanatory variables included
in the descriptive models mainly corresponded to the
athlete's sleep duration from one up to ten days prior,
aligning with Oura's assignment of greater weight to
recent sleep patterns in computing the score.
Regression coefficients for recent sleep duration (1-5
days) were consistently positive, indicating their
positive effect. Furthermore, sleep efficiency was
only included in one U23 athlete’s model, indicating
that the sleep efficiency of the last day, as well as nine
to thirteen days prior were determinant. In contrast,
all U19 models incorporated at least one sleep
efficiency variable, ranging from the athlete’s sleep
efficiency from one to thirteen days before the score.
3.2.2 Previous Day Activity Score and
Activity Balance Score
The Previous Day Activity Score quantifies an
athlete’s (in)activity relative to their long-term
average. Initial model fitting identified burned
calories, inactive, low (HR < 60% of maximum), and
high active time (HR 80-100% of maximum) as the
consistently selected explanatory variables for this
score. The validation results exhibited an average
RMSE of 5.59 and 6.40 for the U23 and U19
population, respectively, indicating deviations of 5 to
6 units from true values. However, an overall average
R² of 0.80 was obtained from the validation process.
Almost all estimated regression coefficients were
negative, but a true interpretation is challenging as the
(regression coefficient of the) intercept for the
majority of athletes started with a value above 100.
Oura’s Activity Balance Score was analyzed
using burned calories, steps and high activity time,
from the preceding 14 days, shifted in time, as
predictor data. The cross-validation process yielded
an average RMSE of 6.56 (R² = 0.68) for the U23
population and 8.41 (R² = 0.49) for the U19
population. Ultimately, no adequate desired
performance was achieved for this score.
3.2.3 HRV Balance Score
The HRV Balance Score compares the athlete’s
average HRV from the past 14 days relative to their
long-term average, thereby giving greater emphasis
icSPORTS 2025 - 13th International Conference on Sport Sciences Research and Technology Support
212

on recent data. Due to limited long-term data, the
athlete’s average RHR over the past 14 days was also
included as predictor data alongside 14-day HRV
data, significantly improving model representation.
Cross-validation of the descriptive models for the
U23 group yielded RMSE values between 1.51 and
4.15 and R² values between 0.46 and 0.95, with the
largest prediction error coinciding with the greatest
explained variation in the score. For the U19 group,
cross-validation yielded an average RMSE of 2.76
and an R² of 0.84. Model analysis revealed that all but
one athlete's model included at least one RHR
variable. Proportionally, more HRV variables were
included, generally exhibiting positive coefficients,
indicating higher HRV correlated with an increased
HRV Balance Score. In contrast, RHR coefficients
exhibited both positive and negative values,
precluding unambiguous interpretation.
3.3 Investigation of the Readiness
Score
3.3.1 RS Approximated by Its Real
Contributors
A first approximation of the RS by regression
analysis was conducted based on its real reported
contributors (i.e., Sleep Score, Sleep Balance Score,
Previous Day Activity Score, Activity Balance Score,
average RHR, HRV Balance Score, Temperature
Deviation and Recovery Index). Validation of the
fitted regression models yielded an RMSE between
2.05 and 4.67, and an R² between 0.28 and 0.90. The
lowest explained variation by the validated regression
models (R² = 0.28) was obtained for the athlete with
the second highest estimated error (RMSE = 4.38).
Stepwise regression consistently selected the
Sleep Score across all athletes. Four U23 athletes
showed a significant positive regression coefficient
for this variable. Among the U19 athletes, five times
a positive regression coefficient, and one non-
significant negative one was observed. Hence, an
overall positive association with the RS was found.
The second contributor assessed was the Sleep
Balance Score. Likewise, this variable exhibited a
positively estimated regression coefficient for the
same four U23 athletes. For the U19 population, this
score was three times included with a positively
estimated coefficient, once with a negative
coefficient. Likewise, an overall positive association
with the RS was assumed. Using subsequently
normalized predictor data, it was shown that the Sleep
Score determined 15-35% of the RS among the U23
population, and 20-30% for the U19 population, with
one exception (<15%). For both populations, the
Sleep Score was one of the strongest contributors to
the RS. For the Sleep Balance Score, a contribution
to the RS of 5-15% for the U23, and 5-20% for the
U19 athletes, respectively, was found.
A third variable examined, and the second
variable included in the descriptive model for all
athletes, was the Previous Day Activity Score,
consistently showing a positive regression
coefficient, except for one athlete, indicating a
positive association with the RS. This may reflect a
confounding effect, where increased activity
correlates with higher readiness. However, Oura
posits that maintaining 5-8 hours of inactivity daily
would have a positive impact on the athlete’s activity
score, and subsequently RS, while both excessive
inactivity and overexertion will reduce the score. The
recurrent positive regression coefficient for the
Previous Day Activity Score in the descriptive
models of the RS is thus a rational finding. The
Activity Balance Score was included in ten athletes’
models, with nine showing a positive and one a non-
significant negative regression coefficient, likewise
suggesting a positive association with the RS. Across
the entire population, these two activity scores
contributed 7-15% (Previous Day Activity Score) and
7-25% (Activity Balance Score) to the RS models.
The athlete’s average RHR is the third variable
included in all regression models, with a consistently
negatively estimated regression coefficient, except
one positive but non-significant one, indicating an
inverse relation with the RS. An overall contribution
to the RS of 8-35% was observed. Furthermore, the
regression coefficient for the HRV Balance Score
showed mixed results. With five positive and three
times a negative regression coefficient, an overall
positive effect predominated. A relative importance
in describing the RS of 5-10%, up to 20%, for the U23
and U19 population, respectively, was found.
Temperature Deviation was the least frequently
included predictor variable, and by this considered as
the least contributing variable in describing the RS.
The variable appeared in only two models, with
positive coefficients, contributing from virtually 0 to
15%. In contrast, the Recovery Index was included in
all U23 models and three U19 models, consistently
showing a positive coefficient, indicating a positive
association with the RS. The relative importance in
determining the RS was 5-15%. Finally, for all
athletes, generally none to three interaction terms
were included in their model, but these terms’
importance did not prevail over the main effects.
In addition to the individual approach, a general
model was constructed to investigate whether also
Recovery and Readiness Monitoring Using Wearable Technology in Young Triathlon Athletes
213

this model could adequately describe the RS of all
athletes. For this general model, the following criteria
were applied: once a variable's main effect was
included for at least four out of the six U23 athletes,
this variable was included in the general model. For
interaction terms, a required occurrence for at least
two out of the six athletes was applied. Accordingly,
it was found that the Temperature Deviation variable
was the only RS contributor variable that did not meet
the selection criteria. However, this variable was still
included in the general model as an interaction term
associated with this variable was selected.
This led to the general regression model ([Eq. (1)]):
Readiness Score = Intercept + A*Sleep Score
+ B*Sleep Balance Score + C*Previous Day
Activity Score + D*Activity Balance Score
+ E*Average RHR + F*HRV Balance Score
+ G*Temperature Deviation + H*Recovery Index
+ I* Sleep Score*Sleep Balance Score
+ J*Sleep Score*Average RHR
+ K*Sleep Score*Temperature Deviation
(1)
With the values of the RS contributors and the
coefficients A to K being individual-specific.
The U23 models were used for variable selection,
whereupon the general model ([Eq. (1)]) was tested
on both the U23 and U19 group for its descriptive
capability. Because of the explicit requirement to
include the aforementioned selected variables in the
general model, not all variables had a significant
regression coefficient for each athlete. Positive
associations with the RS were found for sleep and
activity scores, as well as for the HRV Balance Score
and Recovery Index, while average RHR showed
consistently negative effects. Temperature Deviation
and interaction terms showed no clear pattern.
Model validation yielded RMSE values between
1.40 and 3.98, with the exception of one athlete
(RMSE = 7.10). Overall, the explained variation in
the RS by the general model (R²) ranged between 0.58
and 0.95, excluding one athlete. This athlete was the
only athlete for whom the general model exhibited a
poor performance in the validation process. These
results suggest that the proposed general model has
strong potential for describing and predicting the RS
but individual adjustments should not be excluded.
3.3.2 RS Approximated by Approximations
of Its Real Contributors
This regression analysis aimed to examine whether
models based on predicted (Balance) Scores could
adequately describe the RS. Consequently, the RS,
along with its contributors, would be uncovered and
identified in its totality, as opposed to the black-box
nature of the score that previously dominated.
It was found that sleep-related variables,
particularly the approximated Sleep Score and Sleep
Balance Score, were strong positive predictors of the
athletes' RS, underscoring the importance of sleep for
recovery and readiness. Likewise, activity-related
variables, especially the Previous Day Activity Score,
showed primarily positive associations with the RS.
Average RHR appeared inversely related to the RS,
while the HRV Balance Score and Recovery Index
had positive effects. Consistent with previous
findings, Temperature Deviation was the least
significant predictor of the RS. Model validation
yielded RMSE values between 2.60 and 5.44, with
badly an average predictive accuracy R² of 0.56,
excluding one athlete (RMSE = 7.74 and R² = 0.18).
In a one-to-one comparison of validation statistics,
models based on the true contributors exhibited
superior performance for all but two athletes.
3.3.3 RS Approximated by an Alternative
Subset of Predictor Variables
To meet the fourth objective, regression models using
multiple non-collinear, directly measured Oura
variables, in combination with sRPE and TQR scores,
were developed. Due to missing data, sRPE and TQR
scores were excluded for the U19 group. The models
exhibited poor performance (average validation R² =
0.29), with sleep-related variables, average RHR and
HRV, and respiratory rate most frequently included.
The models failed to adequately describe and predict
the RS, indicating that the subset of contributor
variables to the RS proposed by Oura is needed to
adequately describe the RS using regression models
which only allow the inclusion of main effects and
first-degree interaction terms.
3.4 Limitations
While devices like the Oura Ring show high validity
for directly measured metrics (e.g., RHR, HRV;
Kinnunen et al., 2020), their proprietary scores lack
transparency and gold-standard validation, without
which it remains unclear how well the RS reflects
actual physiological readiness. Therefore, caution is
advised when interpreting wearable-derived – black-
box – metrics for modeling purpose, as compounded
estimation errors may reduce accuracy – especially
for inferred parameters like readiness.
This study’s effort to deconstruct Oura’s scores
into interpretable models offers valuable insights, yet
icSPORTS 2025 - 13th International Conference on Sport Sciences Research and Technology Support
214

also highlights the need for prioritizing directly
measured, well-contextualized data. However, due to
the assumption of linearity, multicollinearity among
physiological variables, the inclusion of interaction
terms that may increase the risk of overfitting, and the
hierarchical structure and limited size of the dataset,
linear regression may not be the most robust
modeling approach for this context. Therefore, future
research should consider alternative modeling
techniques, and pursue external validation using
larger independent datasets and comparisons with
established physiological reference measurements to
assess the validity and generalizability of both the
model and underlying wearable metrics.
While the sRPE method is widely used and
correlates well with HR zones (up to 𝑟 = 0.84 for
endurance athletes (Borresen & Lambert, 2008)), it
lacks precision in time quantification, as it includes
total session duration regardless of pauses (Halson,
2014). Despite this, the simplicity, reliability, and
demonstrated agreement of the (s)RPE method with
more complex metrics support its continued use. In
addition, the TQR questionnaire lacked specificity for
triathlon, with outdated or not clearly defined items
(e.g., cooling down, stretching), limiting its relevance
and score potential. A sport-specific and updated
version, aligned with modern recovery strategies, is
recommended for future research. Noteworthy is the
unavailability of (s)RPE and TQR data for the U19
subgroup which restricts the generalizability of
findings, which are based on only six (U23) athletes.
Lastly, this study focused on twelve youth pre-
elite triathletes monitored over three months, limiting
generalizability to other populations or long-term
trends. Individualized monitoring prevailed over a
generalized approach due to varied physiological
responses among the athletes.
4 CONCLUSION
Readiness and recovery levels of young triathletes
can (potentially) be monitored using wearable
technology in combination with reference training
load and recovery measures. The primary focus
should be on the individual athletes’ responses, rather
than general trends, and their sleep patterns, both in
the short- and long-term. Beside objectively collected
data, the significance of subjective data should not be
underestimated. A novel contribution is presented, as
no prior published work has approximated the RS by
using simple regression analysis based on Oura’s
stated contributing factors, nor based on other
(physiological) wearable data or subjective measures.
REFERENCES
Aerts, J-M., Moons, K., Masci, F., Meeusen, R., Gielen, J.
(2025). Identifying stakeholder perspectives and
priorities for athlete monitoring technology: A mixed-
methods study based on interviewing Belgian high-
performance sports organisations. International Journal
of Sports Science & Coaching, 20(3), 973–987.
Beck, K., Thomson, J. S., Swift, R. J., von Hurst, P. R.
(2015). Role of nutrition in performance enhancement
and postexercise recovery. Open Access Journal of
Sports Medicine, 259.
Borresen, J., Lambert, M. I. (2008). Quantifying Training
Load: A Comparison of Subjective and Objective
Methods. International Journal of Sports Physiology
and Performance, 3(1), 16–30.
Debien, P. B., Miloski, B., Werneck, F. Z., Timoteo, T. F.,
Ferezin, C., Filho, M. G. B., Gabbett, T. J. (2020).
Training Load and Recovery During a Pre-Olympic
Season in Professional Rhythmic Gymnasts. Journal of
Athletic Training, 55(9), 977–983.
Flatt, A., Esco, M., Nakamura, F. (2018). Association
between Subjective Indicators of Recovery Status and
Heart Rate Variability among Divison-1 Sprint-
Swimmers. Sports, 6(3), 93.
Foster, C., Florhaug, J. A., Franklin, J., Gottschall, L.,
Hrovatin, L. A., Parker, S., Doleshal, P., Dodge, C.
(2001). A new approach to monitoring exercise
training. Journal of Strength and Conditioning
Research, 15(1), 109–115.
Halson, S. (2014). Monitoring Training Load to Understand
Fatigue in Athletes. Sports Medicine, Vol. 44, 139–147.
Impellizzeri, F. M., Shrier, I., McLaren, S. J., Coutts, A. J.,
McCall, A., Slattery, K., Jeffries, A. C., Kalkhoven, J.
T. (2023). Understanding Training Load as Exposure
and Dose. Sports Medicine, 53(9), 1667–1679.
Kenttä, G., Hassmén, P. (1998). Overtraining and Recovery
A Conceptual Model. Sports Medicine, 26(1).
Kinnunen, H., Rantanen, A., Kentt, T., Koskim ki, H.
(2020). Feasible assessment of recovery and
cardiovascular health: Accuracy of nocturnal HR and
HRV assessed via ring PPG in comparison to medical
grade ECG. Physiological Measurement, 41(4).
Nässi, A., Ferrauti, A., Meyer, T., Pfeiffer, M., Kellmann,
M. (2017). Psychological tools used for monitoring
training responses of athletes. Performance
Enhancement and Health, 5(4), 125–133.
Nystoriak, M.A., Bhatnagar, A. (2018). Cardiovascular
Effects and Benefits of Exercise. Front. Cardiovasc.
Med. 5:135.
Plews, D. J., Laursen, P. B., Stanley, J., Kilding, A. E.,
Buchheit, M. (2013). Training Adaptation and Heart
Rate Variability in Elite Endurance Athletes: Opening
the Door to Effective Monitoring. Sports Medicine,
43(9), 773–781.
Roberts, S. S. H., Teo, W. P., Aisbett, B., Warmington, S.
A. (2019). Extended sleep maintains endurance
performance better than normal or restricted sleep.
Medicine and Science in Sports and Exercise, 51(12),
2516–2523.
Recovery and Readiness Monitoring Using Wearable Technology in Young Triathlon Athletes
215

Schneider, C., Hanakam, F., Wiewelhove, T., Döweling,
A., Kellmann, M., Meyer, T., Pfeiffer, M., Ferrauti, A.
(2018). Heart rate monitoring in team sports-A
conceptual framework for contextualizing heart rate
measures for training and recovery prescription.
Frontiers in Physiology, 9:639.
Walsh, N. P., Halson, S., Sargent, C., Roach, G. D.,
Nédélec, M., Gupta, L., Leeder, J., Fullagar, H. H.,
Coutts, A. J., Edwards, B. J., Pullinger, S. A.,
Robertson, C. M., Burniston, J. G., Lastella, M., Le
Meur, Y., Hausswirth, C., Bender, A. M., Grandner, M.
A., Samuels, C. H. (2021). Sleep and the athlete:
Narrative review and 2021 expert consensus
recommendations. British Journal of Sports Medicine,
55(7), 356–368.
Watson, A. M. (2017). Sleep and Athletic Performance.
Sports Medicine, 16(6), 413-418.
icSPORTS 2025 - 13th International Conference on Sport Sciences Research and Technology Support
216
