
Anomaly Detection in Directed Energy Deposition: A Comparative Study
of Supervised and Unsupervised Machine Learning Algorithms
Berke Ayyıldızlı, Beyza Balota, Kerem Tatari, Shawqi Mohammed Farea and Mustafa Unel
Faculty of Engineering and Natural Sciences, Sabancı University, Istanbul, Turkey
Keywords:
Directed Energy Deposition (DED), Thermal Imaging, Anomaly Detection, Supervised Learning,
Unsupervised Learning, Machine Learning.
Abstract:
Directed Energy Deposition (DED) is a promising additive manufacturing technology increasingly utilized in
critical industries such as aerospace and biomedical engineering for fabricating complex metal components.
However, ensuring the structural integrity of DED-fabricated parts remains a significant challenge due to the
emergence of in-process defects. To address this, we propose a comprehensive anomaly detection framework
that leverages in-situ thermal imaging of the melt pool for defect identification. Our approach encompasses
both supervised and unsupervised machine learning techniques to capture diverse defect patterns and accom-
modate varying levels of labeled data availability. Supervised methods—including ensemble classifiers and
deep neural networks—are employed to learn from annotated thermal data, while unsupervised methods, such
as autoencoders and clustering algorithms, are used to detect anomalies in unlabeled scenarios and uncover
previously unknown defect patterns. The pipeline incorporates essential preprocessing techniques—such as
feature extraction, normalization, and class rebalancing—to enhance model robustness. Experimental eval-
uations offer a detailed comparison between the supervised classifiers and unsupervised models utilized in
this work, emphasizing the predictive performance and practical applicability of each learning paradigm. No-
tably, the supervised classification-based framework achieved high performance in detecting porosity-related
anomalies, with an F1 score of up to 0.88 and accuracy reaching 99%.
1 INTRODUCTION
Directed Energy Deposition (DED) is a key addi-
tive manufacturing process that enables the fabrica-
tion and repair of complex metal components layer
by layer using a focused energy source. Its flexibility
makes it particularly well-suited for high-stakes in-
dustries such as aerospace, healthcare, and automo-
tive manufacturing, where mechanical integrity is es-
sential for ensuring safe and reliable operation (Dass
and Moridi, 2019; Li et al., 2023). Compared to tradi-
tional manufacturing techniques, DED facilitates the
creation of intricate geometries and enables localized
repairs, offering significant advantages in both design
flexibility and material efficiency.
Despite these benefits, DED processes are prone
to critical in-process defects—most notably poros-
ity, lack of fusion, and cracking—that can degrade
the performance and service life of the fabricated
parts (Tang et al., 2022). Early identification of
such defects is essential, especially in applications
where structural failure could have catastrophic con-
sequences. Conventional inspection techniques, in-
cluding manual review and post-process nondestruc-
tive evaluation methods such as X-ray Computed To-
mography (XCT), are limited by their inability to pro-
vide real-time feedback and often require significant
time and resources (Tang et al., 2022; Herzog et al.,
2024). Additionally, fixed-threshold and rule-based
monitoring methods fall short in capturing the com-
plex and transient thermal patterns present in DED
processes (Herzog et al., 2024).
In contrast, machine learning (ML) has emerged
as a promising approach for real-time, non-invasive
defect detection, offering the ability to learn complex
and nonlinear relationships from high-dimensional
data sources such as thermal imagery (Gaja and Liou,
2018). These data-driven methods can generalize
across subtle patterns that are difficult to capture using
deterministic thresholds or handcrafted rules, making
them ideal for DED monitoring. In the existing lit-
erature, a variety of supervised ML classifiers have
been employed for defect detection, including dis-
criminant analysis, support vector machines, and en-
Ayyıldızlı, B., Balota, B., Tatari, K., Farea, S. M. and Unel, M.
Anomaly Detection in Directed Energy Deposition: A Comparative Study of Supervised and Unsupervised Machine Learning Algorithms.
DOI: 10.5220/0013729800003982
Paper published under CC license (CC BY-NC-ND 4.0)
In Proceedings of the 22nd International Conference on Informatics in Control, Automation and Robotics (ICINCO 2025) - Volume 2, pages 503-510
ISBN: 978-989-758-770-2; ISSN: 2184-2809
Proceedings Copyright © 2025 by SCITEPRESS – Science and Technology Publications, Lda.
503

semble methods (Khanzadeh et al., 2018), as well as
deep neural network architectures (Patil et al., 2023).
In addition, unsupervised learning techniques—such
as self-organizing maps (SOM), K-means clustering,
and Density-Based Spatial Clustering of Applications
with Noise (DBSCAN) —have also been explored for
identifying anomalies in thermal data during the DED
process (Taheri et al., 2019; Garc
´
ıa-Moreno, 2019;
Farea et al., 2024).
However, several research gaps remain unad-
dressed. First, there is a lack of comparative stud-
ies that rigorously evaluate supervised and unsuper-
vised ML methods side-by-side for DED defect de-
tection, especially in terms of robustness under real-
world conditions. Most prior works tend to focus
exclusively on one paradigm without assessing the
strengths and limitations of both. Second, threshold
selection in anomaly detection—particularly for un-
supervised methods like autoencoders—often lacks
standardized or domain-specific criteria, making it
difficult to generalize results across datasets and ap-
plications. Lastly, practical concerns such as extreme
class imbalance, data quality issues, and interpretabil-
ity are frequently underexplored, despite their signifi-
cant impact on real-world deployment.
In this study, we introduce a comprehensive
framework that leverages both supervised and unsu-
pervised ML techniques to detect porosity-related de-
fects in DED using thermal image data. The unsu-
pervised models include autoencoders and DBSCAN,
whilst the supervised models include Random For-
est, Extreme Gradient Boosting (XGBoost), and Con-
volutional Neural Networks (CNNs). These mod-
els are tested on a dataset comprising 1,564 thermal
images of the melt pool, where only 4.5% of im-
ages contain porosity-related defects (Zamiela et al.,
2023). This severe class imbalance introduces model-
ing challenges and necessitates preprocessing strate-
gies tailored to noisy, sparse, and imbalanced data.
A preprocessing pipeline was implemented to over-
come these limitations, including outlier removal,
data imputation, normalization, and class rebalancing.
Furthermore, feature extraction was used to support
interpretable models and reduce input dimensional-
ity. Extracted features include statistical descrip-
tors of the melt pool’s thermal distribution—such as
mean, standard deviation, skewness, and interquartile
range—which have been shown in prior research to
correlate with melt pool quality and porosity forma-
tion (Garc
´
ıa-Moreno, 2019).
This work offers a comparative study of ML meth-
ods for DED defect detection, with an emphasis on
practical issues such as data imbalance, preprocess-
ing complexity, thresholding strategies, and model
interpretability. By combining domain knowledge
with modern ML techniques, the proposed framework
aims to advance real-time defect detection in additive
manufacturing. Ultimately, the results contribute to
the goal of establishing DED as a robust and reliable
process for safety-critical industrial applications.
2 METHODOLOGY
2.1 Preprocessing Pipeline
Due to inconsistencies and noise present in the raw
thermal image data, a robust preprocessing pipeline
was implemented to prepare model-ready inputs and
enhance the performance of both supervised and un-
supervised learning models.
Some images in the dataset contain zero-valued
pixels and/or pixels with missing values. The values
of these pixels were imputed using the mean of their
respective columns within each image. Then, the ther-
mal data underwent min-max normalization, scaling
pixel values to the range of [0, 1]. This normalization
step was crucial for stabilizing gradient-based opti-
mizers in neural network training and ensuring con-
sistency and comparability across ML models.
For the shallow models, feature extraction was
employed to reduce dimensionality and enhance in-
terpretability. Each thermal image was transformed
into a structured feature vector comprising 11 statis-
tical descriptors: minimum (Min Temp), maximum
(Max Temp), mean (Mean Temp), standard devia-
tion (Std Temp), median (Median Temp), first quar-
tile (Q1), third quartile (Q3), interquartile range
(IQR), skewness, kurtosis, and peak temperature pixel
(High Temp Pixels). These features summarize the
spatial and statistical properties of the melt pool tem-
perature distribution, providing a compact and infor-
mative input format for training the supervised tree-
based classifiers—the Random Forest and XGBoost
classifiers.
Considering the inherent imbalance in the dataset,
the Synthetic Minority Oversampling Technique
(SMOTE) was employed during the training of the
supervised models. SMOTE generates synthetic mi-
nority class samples by interpolating between existing
anomalous instances, mitigating classification bias,
and improving the defect detection recall.
Collectively, these preprocessing strategies en-
sured the dataset’s compatibility and consistency
across diverse ML models, ultimately enhancing the
effectiveness and interpretability of the anomaly de-
tection framework.
ICINCO 2025 - 22nd International Conference on Informatics in Control, Automation and Robotics
504

2.2 Supervised ML Models
2.2.1 Ensemble Tree-Based Models
The ensemble tree-based models include two effective
classifiers as follows:
Random Forest: It is an ensemble ML algorithm
that combines multiple decision trees to deliver robust
predictions through majority voting (Rigatti, 2017).
Random forests are particularly effective in handling
high-dimensional data, reducing overfitting, and pro-
viding feature importance insights, making them a
preferable choice for anomaly detection in DED pro-
cesses using thermal image-derived features.
XGBoost: It is an advanced gradient boosting
framework that builds upon traditional tree-based en-
semble methods by employing iterative training of
shallow decision trees (Chen and Guestrin, 2016).
XGBoost is especially renowned for its performance
on structured, tabular datasets and its inherent robust-
ness in managing class imbalance, sparse features,
and noisy data, making it particularly suitable for
anomaly detection in DED processes.
Both classifiers were configured and fine-tuned to
achieve optimal performance while ensuring general-
izability. Through preliminary experimentation and
cross-validation, the hyperparameters were selected
according to Table 1, ensuring the best compromise
between predictive accuracy and model simplicity.
The random state was set at 42 for reproducibility of
experimental results.
For both classifiers, a structured feature vector
comprising 11 statistical features extracted from the
thermal images was used as input. The dataset was
divided into training and test sets using a stratified
70%-30% split, preserving the original class distribu-
tion within each subset. The SMOTE algorithm was
then applied solely to the training set to avoid data
leakage and realistically simulate practical scenarios,
resulting in balanced class proportions that enhance
the classifier’s sensitivity to anomalies.
By leveraging carefully extracted statistical fea-
tures, robust oversampling techniques, and thorough
hyperparameter tuning, these supervised approaches
significantly enhances the defect detection process, as
can be noticed in Section 3.
Table 1: Hyperparameters of Random Forest and XGBoost.
Random Forest XGBoost
Number of Estimators 100 Number of Estimators 100
Max. Depth 5 Max. Depth 3
Min. Samples per Split 5 L2 Regularization 1
Min. Samples per Leaf 2 L1 Regularization 0.5
Lastly, one of the inherent key strengths of Ran-
dom Forest and XGBoost lies in their transparency
regarding feature importance, allowing practitioners
to directly interpret and understand critical features
impacting anomaly detection outcomes. This inter-
pretability is particularly beneficial for manufacturing
engineers and quality analysts in pinpointing key in-
dicators of defects in real-world DED processes.
2.2.2 Convolutional Neural Network (CNN)
CNNs are a subclass of deep learning models, partic-
ularly effective for spatial data such as images. In this
study, CNNs were utilized in a supervised learning
context to directly classify thermal images as either
defective or non-defective.
After preprocessing, the dataset was split into
training and test sets with an 70%-30% stratified split
to preserve class distribution. To address the highly
imbalanced nature of the dataset, SMOTE was ap-
plied to the training set. Since SMOTE requires 2D
inputs, training images were first flattened, oversam-
pled, and reshaped back to their original shape.
The CNN architecture consisted of the following
layers:
• Conv2D (16 filters) with ReLU activation and
a 3 × 3 kernel, followed by a maximum pooling
layer.
• Conv2D (32 filters) with ReLU activation and
a 3 × 3 kernel, followed by a maximum pooling
layer
• Flatten layer to convert spatial features into a
dense vector.
• Dropout layer (rate = 0.3) to prevent overfitting.
• Dense layer (64 units) with ReLU activation.
• Output layer (1 unit) with sigmoid activation for
binary classification.
The model was compiled with the Adam opti-
mizer (learning rate = 0.001), using the binary cross-
entropy loss. The network was trained for 10 epochs
with a batch size of 16, using 20% of the training data
as a validation set.
2.3 Unsupervised ML Models
2.3.1 Autoencoder
Autoencoders are a class of artificial neural networks
primarily used for unsupervised learning and anomaly
detection. They are designed to learn compressed,
low-dimensional representations of the input data and
subsequently reconstruct the input from this encod-
ing. Deviations between the input and reconstructed
Anomaly Detection in Directed Energy Deposition: A Comparative Study of Supervised and Unsupervised Machine Learning Algorithms
505
output serve as a basis for identifying anomalous in-
stances. Instances with high reconstruction errors are
considered potential anomalies, as they deviate from
the learned patterns of normal data (Zhou and Paf-
fenroth, 2017). Since autoencoders are trained solely
to reproduce their input, they do not require labeled
data, making them inherently suitable for unsuper-
vised anomaly detection.
The model implemented in this study consists of
three primary layers: an input, encoding layer, and
decoding layer. The input layer accepts flattened vec-
tors of the thermal images. The encoding layer con-
tains 64 neurons, strategically selected through empir-
ical testing to ensure sufficient information retention
without overfitting. This layer employs the ReLU ac-
tivation function because of its efficacy in handling
continuous numeric data and mitigating issues such as
vanishing gradients. The decoding layer mirrors the
dimensionality of the input layer and uses a sigmoid
activation function to produce output values within
a normalized range of 0 to 1, ensuring compatibility
with the scaled thermal image data.
The autoencoder was trained using the entire
dataset of preprocessed thermal images, consisting
of 1,564 frames, each normalized to manage pixel
value disparities. The training regime consisted
of 50 epochs with a batch size of 16, determined
through preliminary experimentation to balance train-
ing performance and computational efficiency. Dur-
ing training, input data points were continuously re-
constructed, using the Adam optimizer to minimize
the mean square error (MSE) loss between the origi-
nal and reconstructed frames.
After training, anomaly detection was performed
by evaluating the reconstruction error for each ther-
mal frame. The underlying hypothesis is that anoma-
lous frames, characterized by porosity or structural
defects, inherently deviate significantly from normal
thermal patterns, resulting in a higher reconstruction
error. To systematically identify anomalies, two dis-
tinct thresholds based on the percentile distribution of
reconstruction errors were established:
• 95th Percentile Threshold: Frames with MSE
above the 95th percentile were labeled anoma-
lous.
• 99th Percentile Threshold: A more conservative
approach, identifying only the extreme deviations
by setting a threshold at the 99th percentile.
This dual-threshold strategy allowed a nuanced
analysis of detection sensitivity and specificity, pro-
viding insights into the optimal balance for practical
anomaly detection within industrial contexts. Overall,
the autoencoder-based anomaly detection methodol-
ogy outlined provides a robust, unsupervised frame-
work adaptable for monitoring DED processes, offer-
ing a valuable alternative when labeled data is scarce
or expensive to obtain.
2.3.2 DBSCAN
It is a density-based clustering algorithm widely used
in unsupervised anomaly detection tasks. Unlike tra-
ditional clustering algorithms, DBSCAN does not re-
quire a predefined number of clusters; instead, it iden-
tifies clusters based on the density of data points,
classifying points in low-density regions as anoma-
lies (Deng, 2020). Given the high-dimensional na-
ture of the thermal images, dimensionality reduction
was critical for the effective application of DBSCAN.
Principal Component Analysis (PCA) was employed
to reduce the dimensionality of the input thermal im-
ages to 50 principal components (Hemanth, 2020).
This transformation significantly decreased computa-
tional complexity, improved clustering efficiency, and
enhanced the clarity of density-based clusters.
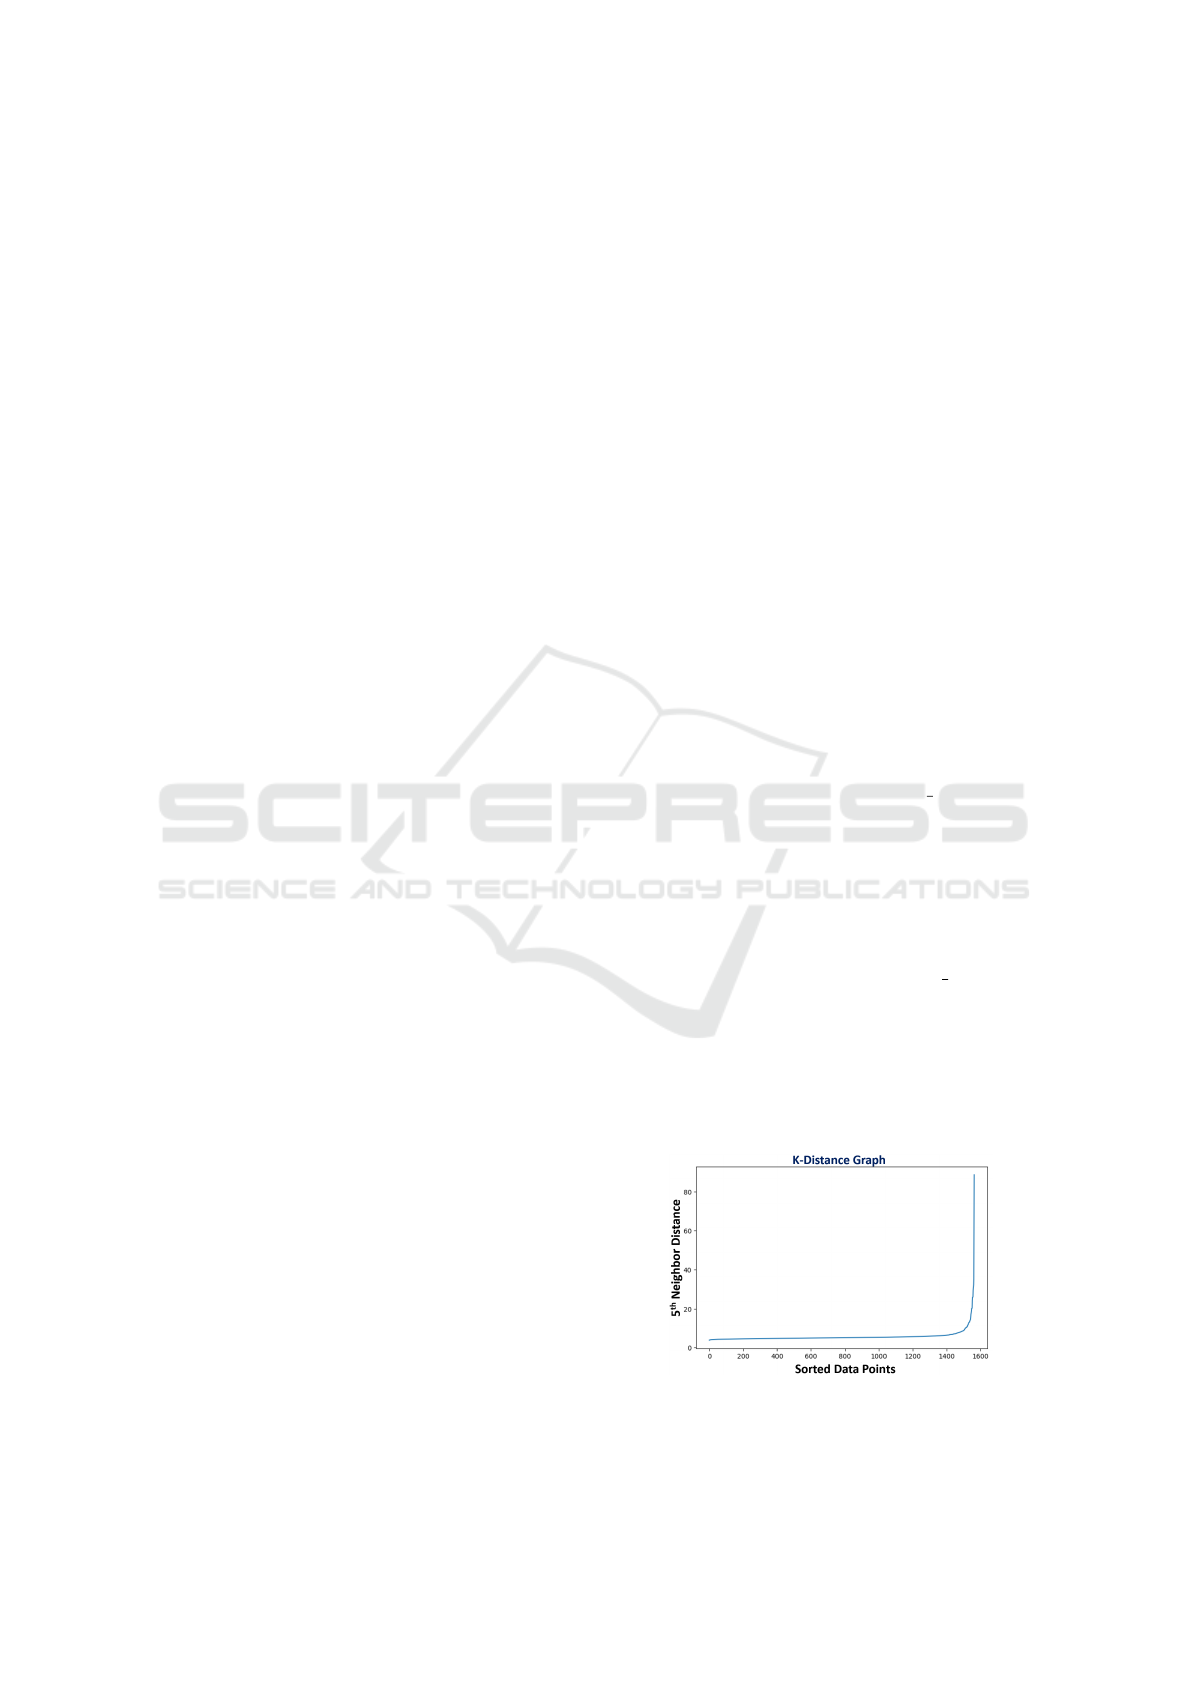
Nonetheless, the optimal parameter selection is
essential for DBSCAN performance. The algorithm
primarily depends on two parameters: the neighbor-
hood radius (ε) and the minimum number of points
required to form a dense region (min samples). To
determine the optimal ε value, a k-distance heuristic
method was utilized, as displayed in Figure 1. Specif-
ically, distances to the 5th nearest neighbor for each
data point were calculated, sorted, and plotted to iden-
tify an elbow point—representing an optimal balance
between overly fragmented clusters (too small ε) and
merged clusters (too large ε). Based on this heuristic,
the ε value was set to 7.7, while the min samples pa-
rameter was set to 5 (see Figure 1). This configuration
provided an effective balance, ensuring that density-
based clustering appropriately distinguished anoma-
lies from typical data patterns. With the optimized
parameters, DBSCAN clusters the PCA-transformed
image data into dense regions, labeling points outside
these clusters as anomalies.
Figure 1: K-Distance graph used for optimal epsilon value
selection. The sharp increase (elbow) around 7.7 suggests
this as the optimal ε value.
ICINCO 2025 - 22nd International Conference on Informatics in Control, Automation and Robotics
506
3 RESULTS AND DISCUSSION
3.1 Dataset Description
The dataset used in this work (Zamiela et al., 2023)
consists of 1,564 thermal images of the melt pool
recorded during the fabrication of Ti–6Al–4V thin-
walled structures using the OPTOMEC LENS™ 750
system. The thermal images were captured in-process
using a Stratonics dual-wavelength pyrometer, which
records a top-down view of the melt pool during laser
deposition. Each frame consists of a 200×200 pixel
thermal image capturing the relative temperature dis-
tribution of the melt pool. Binary porosity labels
were assigned based on post-process inspection us-
ing Nikon XT H225 X-ray Computed Tomography.
Only 71 images (about 4.5%) contain porosity-related
defects, whilst the remaining 1493 images are defect-
free, leading to a significant class imbalance. This re-
markable class imbalance poses challenges for model
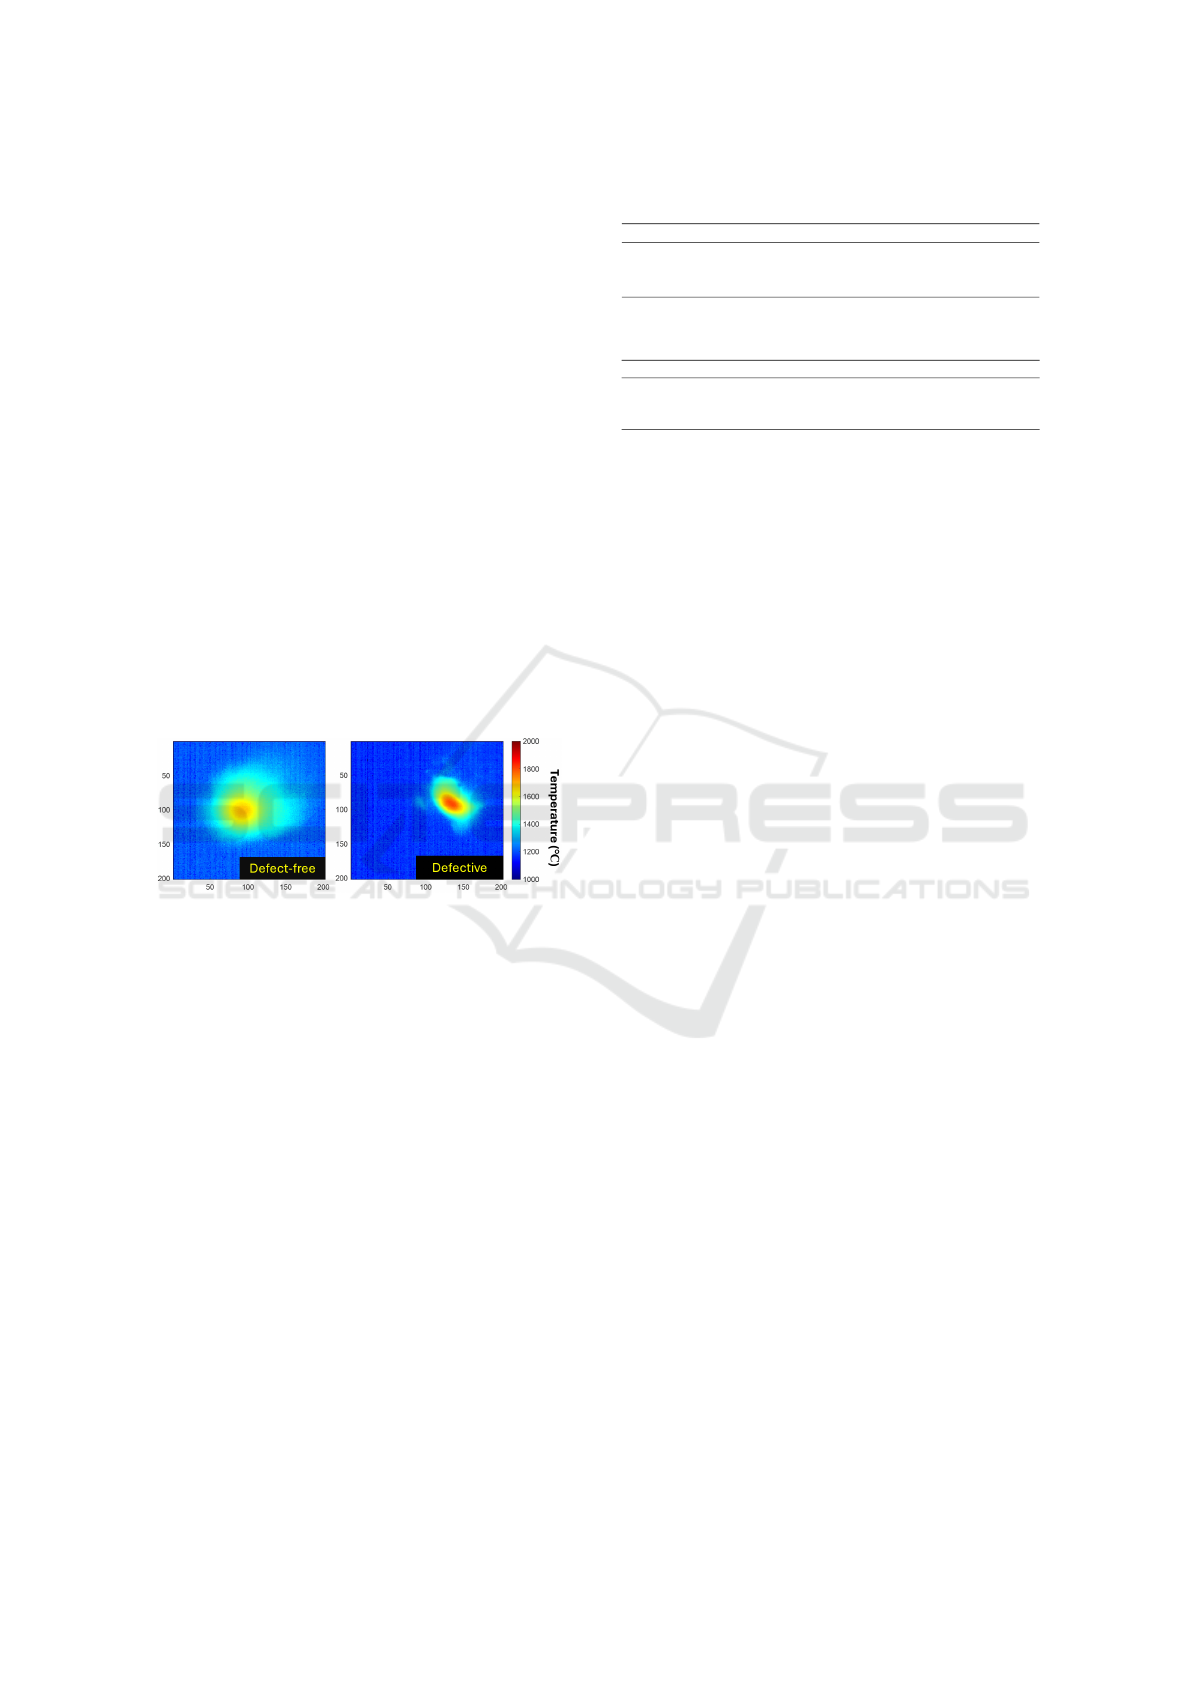
generalization and sensitivity to rare events. Repre-
sentative defect-free and defective images are shown
in Figure 2.
Figure 2: Normal vs defective thermal images.
3.2 Defect Detection Results
The comparative evaluation of the models is pre-
sented in Tables 2 and 3, with corresponding confu-
sion matrices shown in Figures 3 and 4. Each model
was assessed based on its ability to identify porosity-
related anomalies from thermal image data, under the
same preprocessing and evaluation.
Among the supervised models, the CNN model
exhibited the most favorable performance profile. It
achieved the most balanced trade-off between preci-
sion and recall, and demonstrated minimal misclas-
sification of both normal and defective instances, as
reflected in its confusion matrix. The direct use of
image-level data, without handcrafted features, likely
contributed to its ability to capture nuanced spatial
patterns indicative of structural defects.
The ensemble tree-based models yielded good re-
sults, although working with low-dimensional input
data compared to CNN. In particular, Random Forest
achieved results comparable to CNN with an F1 score
Table 2: Supervised models results.
Model Precision Recall F1-Score Accuracy
CNN 0.90 0.86 0.88 0.99
Random Forest 0.86 0.86 0.86 0.98
XGBoost 0.89 0.76 0.82 0.98
Table 3: Unsupervised models results.
Model Precision Recall F1-Score Accuracy
Autoencoder (99th) 0.75 0.17 0.28 0.96
Autoencoder (95th) 0.54 0.61 0.57 0.96
DBSCAN 0.54 0.52 0.53 0.96
of 0.86. It yielded consistently high results across all
metrics. The confusion matrix for Random Forest re-
veals only a small number of false positives and false
negatives, underscoring its reliability in practical clas-
sification tasks. XGBoost, while slightly behind the
other two, remained a competitive model with high
precision and moderate recall. Its performance sug-
gests that it is more conservative in detecting anoma-
lies, favoring precision over sensitivity. This behavior
can be useful in industrial settings where minimizing
false alarms is critical, though it may result in some
defective instances being overlooked.
In contrast, the unsupervised models demon-
strated a wider range of performance, with substan-
tial variation depending on threshold sensitivity and
underlying assumptions. The autoencoder’s detection
capability was heavily influenced by the selected per-
centile threshold. At the 95th percentile, it captured
a larger portion of true anomalies but also introduced
more false positives. The 99th percentile threshold,
being more conservative, reduced false positives at
the expense of significantly lower recall. This trade-
off is clearly reflected in the differences between the
two confusion matrices in Figure 4.
DBSCAN, as a clustering-based method, strug-
gled to consistently distinguish defective instances
from the background class (normal class). Its detec-
tion capability was less focused, and it tended to mis-
classify both normal and anomalous samples. Despite
dimensionality reduction via PCA and careful param-
eter tuning, DBSCAN’s density-based assumptions
proved less effective in this context, where anomalies
are subtle and highly variable.
When comparing the two learning paradigms, su-
pervised models consistently outperformed their un-
supervised counterparts across all evaluation metrics.
The availability of labeled data, combined with class
rebalancing techniques such as SMOTE, enabled su-
pervised classifiers to learn more discriminative deci-
sion boundaries. Crucially, these models are explic-
itly trained and optimized to classify thermal images
as either normal or anomalous. In contrast, unsu-
pervised models are typically designed for auxiliary
Anomaly Detection in Directed Energy Deposition: A Comparative Study of Supervised and Unsupervised Machine Learning Algorithms
507
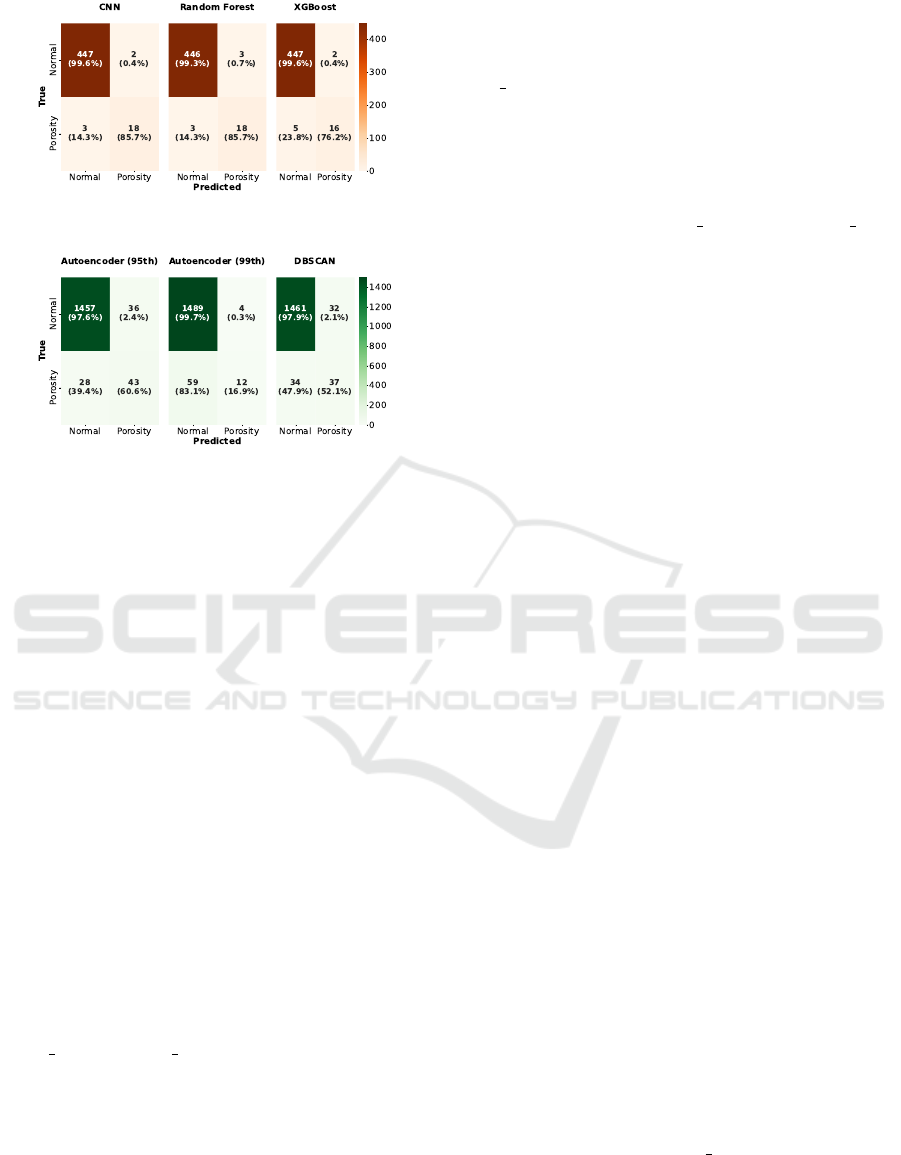
Figure 3: Confusion matrices of the supervised models.
Figure 4: Confusion matrices of the unsupervised models.
tasks, such as input reconstruction or density estima-
tion, that are not directly aligned with classification
objectives. This mismatch limits their sensitivity to
subtle, class-specific patterns, particularly in imbal-
anced datasets. Although autoencoders provided a
flexible and scalable detection framework, their per-
formance was highly dependent on threshold selec-
tion. Similarly, DBSCAN lacked the granularity nec-
essary for fine-grained anomaly identification. Col-
lectively, these findings underscore the advantages of
supervised learning when labeled data is available,
while also highlighting the potential of unsupervised
methods as complementary tools—provided they are
carefully tuned for the task.
3.3 Feature Analysis
Feature-level analysis revealed several insights into
model behavior and predictive performance. To bet-
ter understand the relationships among input features,
a Pearson correlation test was conducted. The cor-
relation matrix, shown in Figure 5, indicates strong
collinearity among central tendency features such as
Mean Temp, Median Temp, Q1, and Q3, suggesting
redundancy in the thermal distribution representation.
In contrast, features like Skewness, Kurtosis, and IQR
demonstrated lower correlation with others, implying
they provide orthogonal, potentially more informative
cues for anomaly detection.
The feature importance rankings derived from su-
pervised models further validate the relevance of spe-
cific features. The importance plots for Random For-
est and XGBoost are provided in Figure 6a and 6b,
respectively. Both Random Forest and XGBoost
consistently prioritized dispersion metrics—IQR and
Std Temp—as the most influential attributes in distin-
guishing between normal and defective samples. This
aligns with the observation that defective frames of-
ten display abrupt changes in temperature variance,
which are effectively captured by interquartile spread
and standard deviation.
Interestingly, while Min Temp and Median Temp
appeared highly correlated in the correlation matrix,
their respective importances varied between mod-
els—suggesting that although correlated, they do not
necessarily provide equivalent discriminative value.
This underscores the benefit of ensemble-based fea-
ture evaluation, where subtle nonlinear relationships
are accounted for during tree construction.
Altogether, the correlation and feature importance
analyses offer actionable insights for dimensionality
reduction, feature selection, and interpretability. They
confirm that a subset of carefully engineered fea-
tures—particularly those reflecting distribution shape
and spread—can effectively support robust classifica-
tion, even in imbalanced anomaly detection settings.
3.4 Final Remarks
Learning Paradigm: Supervised models clearly
benefited from labeled data and class rebalancing
techniques, enabling them to achieve higher and more
consistent detection accuracy. However, this advan-
tage comes at the cost of increased data annotation
effort and reduced flexibility. In industrial settings
where defect annotation is costly or infeasible at
scale, the reliance of supervised models on labeled
datasets may limit their broader applicability. In con-
trast, unsupervised models offered greater flexibil-
ity by operating without labeled defect data, making
them appealing for anomaly detection in exploratory
or early-stage quality monitoring systems.
Threshold Sensitivity and Stability: While au-
toencoders provided a scalable and adaptable frame-
work capable of learning general thermal patterns,
their effectiveness was tightly coupled to the choice
of reconstruction error threshold. This intro-
duces subjectivity and leads to performance trade-
offs—particularly between recall and false-positive
rates. Similarly, DBSCAN was highly sensitive to pa-
rameter selection (ε and min samples) and struggled
with the subtle and highly variable defect patterns typ-
ical of DED processes.
ICINCO 2025 - 22nd International Conference on Informatics in Control, Automation and Robotics
508
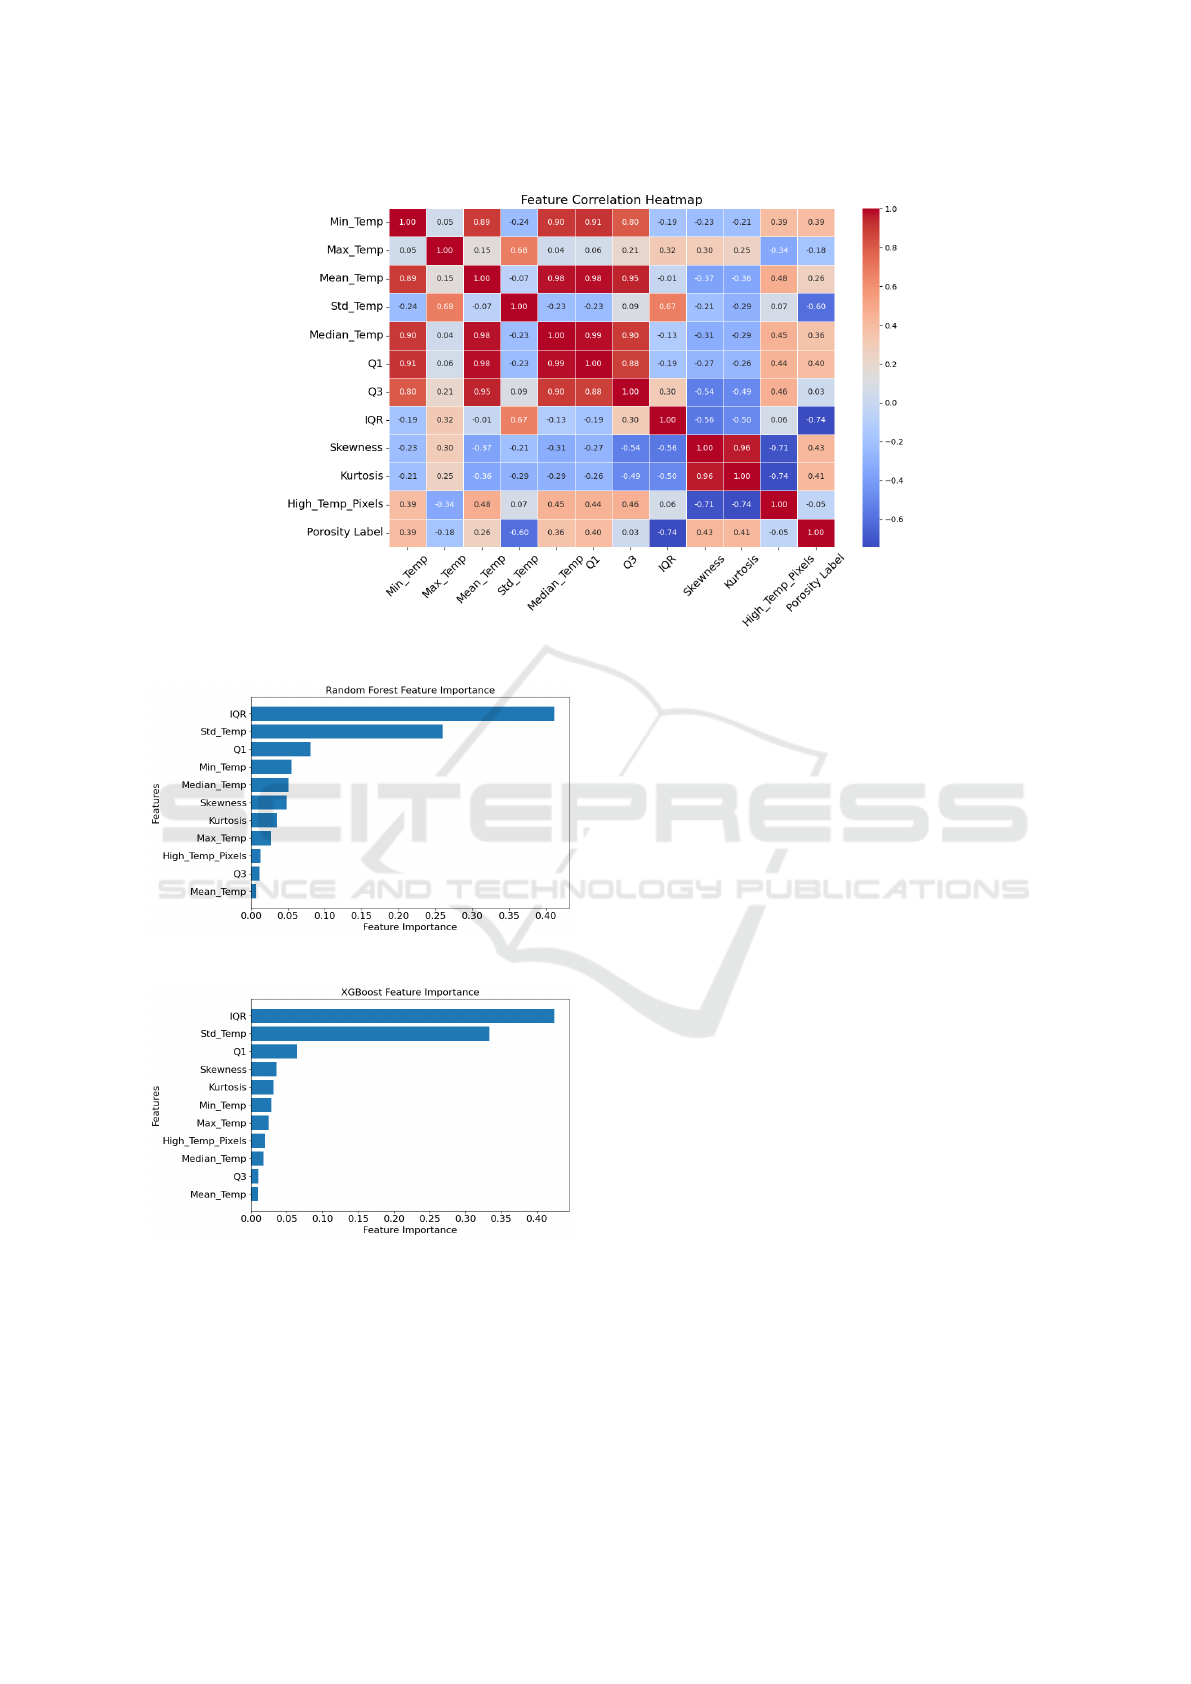
Figure 5: Feature correlation heatmap among extracted statistical features.
(a) Random Forest
(b) XGBoost
Figure 6: Feature importance plot from the ensemble tree-
based models.
Interpretability and Practical Transparency:
From an interpretability standpoint, the super-
vised tree-based models—Random Forest and
XGBoost—provided clear advantages. Through
feature importance rankings, these models enabled
traceable classification decisions and gave practition-
ers direct insights into which statistical temperature
features were most indicative of porosity-related
anomalies. This level of transparency is particularly
valuable in high-stakes manufacturing environments,
where model trustworthiness is critical. On the
other hand, although unsupervised models are more
adaptable, their decisions are often harder to ex-
plain—especially when based on latent encodings or
density-based assumptions.
Deployment Considerations: While supervised
models deliver stronger performance when sufficient
labeled data is available, their deployment requires
pre-existing defect annotations and careful data bal-
ancing. Unsupervised approaches, however, can be
rapidly deployed in dynamic environments with lim-
ited prior knowledge, making them better suited for
initial system integration or ongoing monitoring. The
optimal deployment strategy may involve a hybrid ap-
proach—utilizing unsupervised methods for continu-
ous monitoring or early anomaly flagging, followed
by supervised refinement when annotated data be-
comes available.
4 CONCLUSION
This study presents a comprehensive comparison
of supervised and unsupervised learning approaches
Anomaly Detection in Directed Energy Deposition: A Comparative Study of Supervised and Unsupervised Machine Learning Algorithms
509

for anomaly detection in DED processes based
on thermal image data, highlighting the respective
strengths and limitations of each paradigm. Super-
vised models—namely, CNN, Random Forest, and
XGBoost—consistently outperformed their unsuper-
vised counterparts, benefiting from labeled data, syn-
thetic oversampling via SMOTE, and, for the tree-
based models, statistically engineered features. While
autoencoders and DBSCAN offered greater flexibility
and did not require labeled data, their performance
was more sensitive to thresholding and parameter se-
lection.
The results highlight the practicality and reliabil-
ity of supervised learning in quality-critical applica-
tions where labeled datasets are available. However,
unsupervised methods remain valuable for early-
stage deployment and real-time monitoring scenar-
ios. Moving forward, hybrid frameworks that com-
bine the strengths of both paradigms—starting with
unsupervised detection and refining with supervised
feedback—offer a promising direction for scalable,
interpretable, and robust defect detection in metal ad-
ditive manufacturing.
REFERENCES
Chen, T. and Guestrin, C. (2016). XGBoost: A scalable
tree boosting system. In Proceedings of the 22nd
ACM SIGKDD International Conference on Knowl-
edge Discovery and Data Mining, pages 785–794, San
Francisco, CA, USA.
Dass, A. and Moridi, A. (2019). State of the art in directed
energy deposition: From additive manufacturing to
materials design. Coatings, 9(7):418.
Deng, D. (2020). DBSCAN clustering algorithm based
on density. In Proceedings of the 2020 7th Interna-
tional Forum on Electrical Engineering and Automa-
tion (IFEEA), pages 100–103, Zhuhai, China.
Farea, S. M., Unel, M., and Koc, B. (2024). Defect pre-
diction in directed energy deposition using an ensem-
ble of clustering models. In Proceedings of the 2024
IEEE 22nd International Conference on Industrial In-
formatics (INDIN), pages 1–6.
Gaja, H. and Liou, F. (2018). Defect classification of laser
metal deposition using logistic regression and artifi-
cial neural networks for pattern recognition. Interna-
tional Journal of Advanced Manufacturing Technol-
ogy, 94:315–326.
Garc
´
ıa-Moreno, A.-I. (2019). Automatic quantification
of porosity using an intelligent classifier. Interna-
tional Journal of Advanced Manufacturing Technol-
ogy, 105(5):1883–1899.
Hemanth, D. J. (2020). Dimensionality reduction of produc-
tion data using PCA and DBSCAN techniques. Inter-
national Journal of Scientific Research in Engineering
and Development, 3(6):325–329.
Herzog, T., Brandt, M., Trinchi, A., et al. (2024). Defect
detection by multi-axis infrared process monitoring of
laser beam directed energy deposition. Scientific Re-
ports, 14(1):3861.
Khanzadeh, M., Chowdhury, S., Marufuzzaman, M.,
Tschopp, M. A., and Bian, L. (2018). Porosity predic-
tion: Supervised-learning of thermal history for direct
laser deposition. Journal of Manufacturing Systems,
47:69–82.
Li, S. H., Kumar, P., and Chandra, S. (2023). Directed
energy deposition of metals: Processing, microstruc-
tures, and mechanical properties. International Mate-
rials Reviews, 68(1):1–44.
Patil, D. B., Nigam, A., Mohapatra, S., and Nikam, S.
(2023). A deep learning approach to classify and de-
tect defects in the components manufactured by laser
directed energy deposition process. Machines, 11(9).
Rigatti, S. J. (2017). Random forests. Journal of Insurance
Medicine, 47(1):31–39.
Taheri, H., Koester, L. W., Bigelow, T. A., Faierson, E. J.,
and Bond, L. J. (2019). In situ additive manufactur-
ing process monitoring with an acoustic technique:
clustering performance evaluation using k-means al-
gorithm. Journal of Manufacturing Science and Engi-
neering, 141(4).
Tang, D., He, X., Wu, B., Wang, X., Wang, T., and Li, Y.
(2022). The effect of porosity defects on the mid-
cycle fatigue behavior of directed energy deposited
Ti–6Al–4V. Theoretical and Applied Fracture Me-
chanics, 118:103296.
Zamiela, C., Tian, W., Guo, S., and Bian, L. (2023).
Thermal-porosity characterization data of additively
manufactured Ti–6Al–4V thin-walled structure via
laser engineered net shaping. Data in Brief,
51:109722.
Zhou, C. and Paffenroth, R. C. (2017). Anomaly detec-
tion with robust deep autoencoders. In Proceedings of
the 23rd ACM SIGKDD International Conference on
Knowledge Discovery and Data Mining (KDD), pages
665–674.
ICINCO 2025 - 22nd International Conference on Informatics in Control, Automation and Robotics
510
