
Semi-Supervised Anomaly Detection in Directed Energy Deposition
Using Thermal Images
Ufuk Ismail Ozdek, Yigit Kaan Tonkaz, Shawqi Mohammed Farea and Mustafa Unel
Faculty of Engineering and Natural Sciences, Sabancı University, Istanbul, Turkey
Keywords:
Additive Manufacturing, Directed Energy Deposition (DED), Anomaly Detection, Semi-Supervised Learning,
One-Class Support Vector Machine (OCSVM), Isolation Forest (iForest).
Abstract:
Directed Energy Deposition (DED) is a crucial additive manufacturing process used in aerospace and health-
care applications, among others. However, ensuring defect-free production remains a challenge due to the
difficulty in detecting defect-related anomalies in real-time. In this study, we address the problem of defect
detection in DED processes through thermal images of melt pools. As an anomaly detection problem, we
adopt a semi-supervised approach based on One-Class Support Vector Machine (OCSVM) and Isolation For-
est (iForest). We analyze the performance of these models across different feature sets. Additionally, this
semi-supervised approach is compared against an unsupervised approach utilizing the same learning algo-
rithms. The results indicate the superiority of the semi-supervised approach for both algorithms. Yet, iForest
outperforms OCSVM with an accuracy of 95% and an F1-score of 0.88, demonstrating its robustness in distin-
guishing defective from non-defective instances. This work provides valuable insights into the applicability of
semi-supervised machine learning techniques for real-time defect detection in DED processes. By leveraging
thermal imaging data and feature-based anomaly detection models, our findings contribute to the development
of efficient, non-destructive quality control mechanisms for additive manufacturing processes.
1 INTRODUCTION
Additive manufacturing (AM) has revolutionized the
production of complex metal components in indus-
tries such as aerospace, healthcare, and defense (Dass
and Moridi, 2019). Among various AM techniques,
Directed Energy Deposition (DED) offers unique
advantages in producing large-scale, high-strength
parts due to its ability to deposit material layer-by-
layer with controlled thermal input (Li et al., 2023).
However, ensuring the structural integrity of DED-
manufactured components remains a significant chal-
lenge due to the formation of in-situ defects such as
porosity, cracking, and lack of fusion. These defects,
if undetected, compromise the mechanical properties
of the final product and necessitate expensive post-
production inspections, increasing both costs and ma-
terial waste (Tang et al., 2022). Traditional de-
fect detection methods, such as X-ray Computed To-
mography (XCT) and destructive testing, are time-
consuming and impractical for real-time monitoring.
While process maps and optimized printing parame-
ters can reduce defects, they do not eliminate them
entirely due to variations in machine settings, mate-
rial properties, and environmental factors. Therefore,
real-time, non-destructive anomaly detection is cru-
cial for improving the quality and reliability of DED-
printed parts (Zamiela et al., 2023b; Herzog et al.,
2024).
Machine learning-based approaches provide a
promising alternative by enabling real-time, non-
destructive defect detection, thereby reducing reliance
on post-production inspections. While machine learn-
ing (ML) techniques have been extensively explored
for defect detection in additive manufacturing, their
application to DED remains comparatively underde-
veloped (Hespeler et al., 2022; Qin et al., 2022),
with most research focusing on Powder Bed Fusion
(PBF) and Selective Laser Melting (SLM). ML-based
anomaly detection in DED is still evolving, with
promising potential for enhancing product quality.
Among ML approaches, supervised methods,
such as support vector machines (SVM) and convo-
lutional neural networks (CNN), achieve high accu-
racy in classifying defects in DED processes using
thermal images. However, they require extensive la-
beled datasets, which are resource-intensive to obtain
(Gaja and Liou, 2018; Khanzadeh et al., 2018). In
Ozdek, U. I., Tonkaz, Y. K., Farea, S. M. and Unel, M.
Semi-Supervised Anomaly Detection in Directed Energy Deposition Using Thermal Images.
DOI: 10.5220/0013729700003982
Paper published under CC license (CC BY-NC-ND 4.0)
In Proceedings of the 22nd International Conference on Informatics in Control, Automation and Robotics (ICINCO 2025) - Volume 2, pages 437-445
ISBN: 978-989-758-770-2; ISSN: 2184-2809
Proceedings Copyright © 2025 by SCITEPRESS – Science and Technology Publications, Lda.
437

contrast, unsupervised techniques have gained signif-
icant attention for defect detection in DED processes
due to their ability to analyze large amounts of un-
labeled data and identify hidden patterns associated
with defects. Techniques such as K-means clustering,
self-organizing maps (SOM), density-based spatial
clustering of applications with noise (DBSCAN), and
principal component analysis (PCA) are commonly
used to detect anomalies in process data (Taheri et al.,
2019; Garc
´
ıa-Moreno, 2019; Farea et al., 2024). Ad-
ditionally, unsupervised deep learning methods, such
as Variational Autoencoders (VAE), have been ex-
plored for capturing complex, non-linear relation-
ships in DED thermal imaging data. VAE has been
used to encode high-dimensional thermal images into
a latent space, reconstructing input images and iden-
tifying defects by analyzing reconstruction errors
(Zhao et al., 2021). Gaussian mixture model (GMM)
and K-means clustering techniques have been ap-
plied to these latent representations to further refine
anomaly detection in melt pools, allowing models to
separate defective and normal regions effectively.
Recent studies have also focused on self-
supervised learning techniques, such as Masked Au-
toencoders (MAE) and Vision Transformers (ViT),
to enhance feature extraction from unlabeled melt
pool data (Era et al., 2024). MAE has been pre-
trained on thermal images, where a portion of the
image was masked and reconstructed, enabling the
model to capture robust spatial dependencies with-
out requiring labeled data. After pretraining, fine-
tuned MAE was successfully integrated with super-
vised classifiers, such as CNN and Multi-Layer Per-
ceptron (MLP) models, to detect melt pool anoma-
lies. These advancements underscore the potential of
self-supervised learning and deep generative models
in enhancing real-time, unsupervised defect detection
in DED, reducing reliance on large labeled datasets,
and improving the scalability of in-situ quality con-
trol frameworks (Era et al., 2024).
However, the formulation of DED defect detec-
tion as a semi-supervised learning problem remains
underexplored. This formulation offers a distinct ad-
vantage over supervised and unsupervised methods,
particularly in handling data imbalance. As with
most anomaly detection tasks, DED defect detection
datasets are imbalanced, with defective instances rep-
resenting only a small fraction of the data. In a semi-
supervised framework, models are trained exclusively
on normal data to learn the underlying distribution
of normal behavior, where significant deviations from
this distribution are classified as anomalies. This ap-
proach enhances robustness against data imbalance
compared to supervised and unsupervised methods.
In this work, we formulate defect detection
in DED processes as a semi-supervised learning
problem, employing two effective semi-supervised
algorithms: One-Class Support Vector Machine
(OCSVM) and Isolation Forest (iForest). To effec-
tively model the normal behavior of defect-free data,
we implement preprocessing steps such as segmenta-
tion and domain knowledge-driven feature engineer-
ing.
The remainder of the paper is organized as fol-
lows: Section 2 details the proposed methodology,
including preprocessing steps and semi-supervised
models. Section 3 presents the experimental results
and discussion, while Section 4 provides the conclud-
ing remarks.
2 METHODOLOGY
The methodological framework, shown in Figure 1,
is structured around two anomaly detection mod-
els—OCSVM and iForest. These models were se-
lected based on their capability to detect anoma-
lies in environments where labeled defect data is
scarce, a common constraint in DED quality con-
trol. OCSVM models the normal class boundary,
while iForest isolates outliers through random splits.
Compared to deep learning-based semi-supervised
models (e.g., semi-supervised VAE), shallow mod-
els such as OCSVM and iForest offer several advan-
tages—especially in structured data settings. These
include greater computational efficiency, easier inte-
gration of domain knowledge via preprocessing and
feature engineering, enhanced interpretability, and
simpler hyperparameter tuning.
2.1 Threshold Segmentation
Threshold segmentation was applied to extract the
melt pool region from the thermal images. A thresh-
old of 1640 °C was used, corresponding to the liq-
uidus temperature of the feedstock material (Ti-6Al-
4V). This segmentation enables the localization of the
melt pool boundary and facilitates the feature extrac-
tion relevant to thermal distribution and shape analy-
sis (Alexopoulou, 2021).
2.2 Feature Extraction
Three comprehensive categories of features were ex-
tracted from the thermal melt pool images:
1) Statistical Features: A set of descriptive statis-
tics was computed from the temperature distribution
ICINCO 2025 - 22nd International Conference on Informatics in Control, Automation and Robotics
438

Figure 1: Overview of the proposed methodology.
within each melt pool image, including mean (µ), me-
dian, maximum, minimum, standard deviation (σ),
skewness (1), kurtosis (2), and interquartile range.
These measurements quantify the central tendency,
dispersion, and shape characteristics of the temper-
ature profile.
Skewness =
1
nmσ
3
n
∑
i=1
m
∑
j=1
(T
i j
− µ)
3
(1)
Kurtosis =
1
nmσ
4
n
∑
i=1
m
∑
j=1
(T
i j
− µ)
4
(2)
where T
i j
represents the temperature value at pixel
(i, j) in an n × m thermal image.
2) Gradient Features: The spatial gradients of
temperature were calculated in both x and y direc-
tions to capture thermal transition rates across the
melt pool. From the gradient magnitude distribution,
we derived the gradient mean, standard deviation, and
maximum values, which characterize thermal stabil-
ity during deposition.
3) Geometric Features: From the segmented
melt pool region, we extracted morphological features
including area, perimeter, circularity, aspect ratio, ec-
centricity, and axis measurements. These geomet-
ric attributes capture the melt pool shape character-
istics that have been shown to correlate with porosity
formation. Additionally, peak temperature locations
were identified to enable spatial analysis of thermal
hotspots relative to potential defect formation zones.
2.3 Feature Selection
A total of 26 features were initially extracted across
the statistical, gradient-based, and geometric cate-
gories. To reduce dimensionality, minimize redun-
dancy, and enhance model interpretability, a reduced
feature set was selected. Feature selection is based
on the Pearson correlation test where highly corre-
lated features (with correlation coefficients greater
than 0.8 in magnitude) were eliminated to minimize
redundancy. This yielded a reduced feature subset of
16 features that preserved diversity in representation
while minimizing information overlap.
2.4 Normalization
To mitigate the influence of varying feature magni-
tudes and ensure numerical stability in model train-
ing, feature values were standardized using a statisti-
cal transformation based on their mean and standard
deviation, as in (3). This transformation was par-
ticularly important for stabilizing model training, as
differences in feature ranges could have dispropor-
tionately impacted distance-based methods such as
OCSVM. By normalizing the input data, the mod-
els were able to learn more generalizable decision
boundaries, improving their robustness against fluc-
tuations in thermal imaging conditions (Sch
¨
olkopf
et al., 2001).
x
′
=
x − µ
σ
(3)
where µ and σ denote the mean and standard deviation
of the feature, respectively.
2.5 One-Class Support Vector Machine
(OCSVM)
OCSVM operates by learning a decision boundary
that encapsulates the normal data points, treating ob-
servations outside this boundary as anomalies. The al-
gorithm maps input data into a high-dimensional fea-
ture space through a kernel function and constructs a
hyperplane that maximizes the distance between the
origin and the data points.
The OCSVM implementation utilized the Radial
Basis Function (RBF) kernel due to its capability to
model nonlinear thermal distributions, allowing for
accurate detection of porosity-related deviations and
Semi-Supervised Anomaly Detection in Directed Energy Deposition Using Thermal Images
439

defined as in (4).
K(x
i
, x
j
) = exp(−γ||x
i
− x
j
||
2
) (4)
where K(x
i
, x
j
) represents the kernel function applied
to the data instances x
i
and x
j
while γ denotes the ker-
nel coefficient.
In this work, the critical hyperparameters were
optimized through grid search with 5-fold cross-
validation, focusing primarily on:
• Kernel Coefficient γ: It controls the influence ra-
dius of support vectors.
• Outlier Fraction ν: It establishes an upper bound
on the training error rate and a lower bound on the
fraction of support vectors.
The decision function for classifying a new obser-
vation x is formulated as in (5).
f (x) = sign(
n
∑
i=1
α
i
K(x
i
, x)−ρ) (5)
where α
i
represents the Lagrange multipliers, x
i
de-
notes the support vectors, and ρ is the bias term.
The sign function serves as a thresholding mecha-
nism that maps the continuous output of the deci-
sion function into a binary classification. Observa-
tions with f (x) = 1 are considered to conform to the
distribution of normal (non-defective) melt pool im-
ages, whereas those with f (x) = −1 are classified as
anomalies—indicating thermal patterns suggestive of
potential porosity. This function thus constitutes the
final layer of the OCSVM architecture, enabling inter-
pretable defect classification critical to real-time qual-
ity assurance in DED processes.
2.6 Isolation Forest (iForest)
iForest is an ensemble-based anomaly detection algo-
rithm that leverages decision trees to identify anoma-
lies. In contrast to traditional approaches—such as
one-class classification—that aim to model normal
behavior, iForest adopts a different strategy by di-
rectly targeting the isolation of anomalous instances.
This method is built on the premise that anomalies are
infrequent with distinct characteristics, making them
easier to separate from the rest of the data.
iForest offers several notable advantages. It is
computationally efficient and scales effectively to
large and high-dimensional datasets. Additionally, it
requires only minimal and straightforward hyperpa-
rameter tuning. Combined with its fully unsupervised
nature—which removes the need for labeled data—
these characteristics make iForest a highly practical
and versatile choice for anomaly detection tasks.
The iForest algorithm involves repeatedly divid-
ing the data space through random selections of fea-
tures and respective split values. It builds an ensemble
of binary trees, referred to as isolation trees (iTrees),
where each tree is constructed by choosing a feature
at random and then selecting a split value uniformly
between its observed minimum and maximum. This
recursive partitioning proceeds until either each data
point is isolated in its own leaf node or a prespecified
maximum tree depth is attained.
For any data instance, its path length refers to the
number of splits—or edges—encountered as it trav-
els from the root of an isolation tree to the leaf node
where it is ultimately isolated. Because anomalies are
typically rare and possess feature values that set them
apart from the majority of the data, they are more
likely to be separated early in the tree-building pro-
cess. As a result, anomalous instances tend to exhibit
shorter average path lengths across the ensemble of
isolation trees. This average path length serves as
the basis for computing an anomaly score for each
instance, with shorter paths correspnding to higher
anomaly scores and indicating a higher likelihood of
being anomalous.
As with OCSVM, the critical hyperparameters
were optimized via grid search with 5-fold cross-
validation, and they include:
• Number of Estimators (Trees): It controls the
ensemble size and stability of anomaly score esti-
mates.
• Contamination Parameter: It estimates the pro-
portion of anomalies expected in the data, influ-
encing the decision threshold.
The decision function for classifying a new obser-
vation x is as in (6).
f (x) =
(
anomaly, if s(x) ≥ threshold
normal, otherwise
(6)
where s(x) represents the average anomaly score
across all isolation trees. Higher scores indicate
greater deviation from normal melt pool patterns.
3 RESULTS AND DISCUSSION
3.1 Dataset Description
The dataset used in this study is sourced from Za-
miela et al. (Zamiela et al., 2023a). The dataset com-
prises in-process thermal melt pool images and post-
fabrication porosity labels for Ti-6Al-4V thin-walled
structures, fabricated using the OPTOMEC Laser En-
gineered Net Shaping (LENS™) 750 system. The
ICINCO 2025 - 22nd International Conference on Informatics in Control, Automation and Robotics
440
data was collected for nondestructive thermal charac-
terization of laser DED, enabling the development of
predictive models for quality control.
Thermal imaging was captured using a Stra-
tonics dual-wavelength pyrometer, which records a
top-down view of the melt pool and heat-affected
zone, measuring temperatures above 1660 °C. Inter-
nal porosity defects were labeled using Nikon X-Ray
Computed Tomography (XCT) XT H225, providing
reference measurements for lack of fusion defects oc-
curring within the fabricated structure.
The dataset consists of 1,564 cropped pyrometer
melt pool images in CSV format, each with a reso-
lution of 200 × 200 pixels. The dataset includes bi-
nary porosity labels (0 = No Porosity, 1 = Porosity)
with 1,493 non-defective samples and 71 defective
samples, creating a highly imbalanced dataset with
approximately 4.5% defect occurrence rate. Repre-
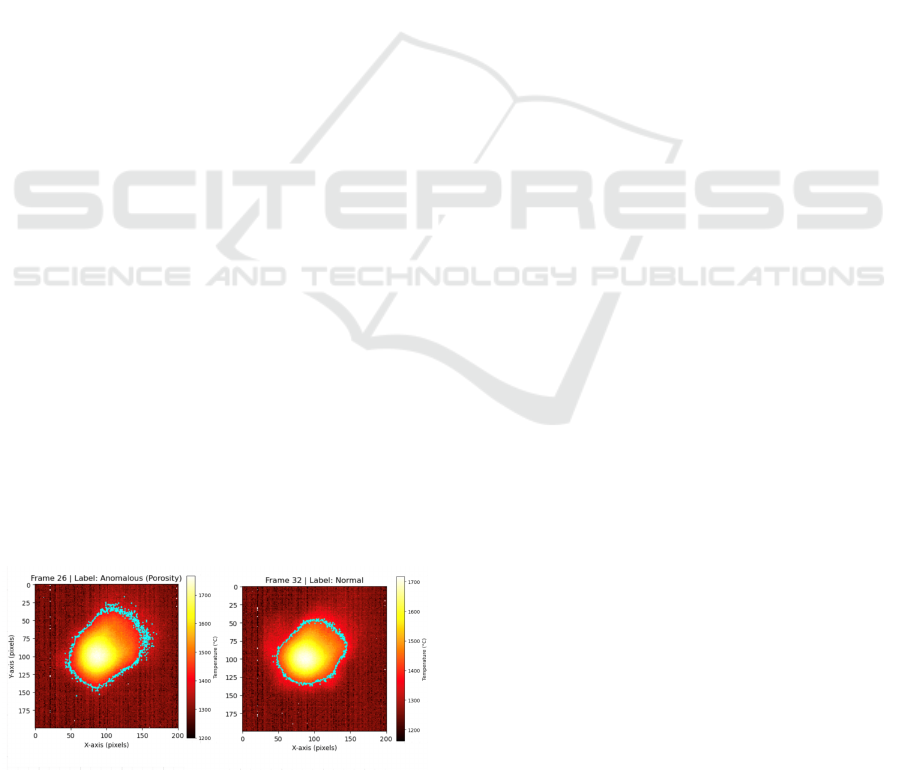
sentative normal and anomalous thermal images are
shown in Figure 2. Each thermal image in the dataset
is accompanied by metadata including frame number,
timestamp, spatial coordinates, melt pool characteris-
tics, and when applicable, porosity size ranging from
0.05 mm to 0.98 mm. The dataset was split into 80%
training and 20% testing. Additionally, the models
were trained using two different settings:
1. Semi-Supervised Setting: The training set con-
tains only normal (i.e., non-anomalous) samples,
consisting of 1,194 normal images, which account
for approximately 80% of the total available nor-
mal data. In this one-class training paradigm, both
models are trained to learn the underlying distri-
bution and characteristic patterns of normal be-
havior. During inference, any test sample that ex-
hibits a substantial deviation from the learned nor-
mal distribution is flagged as anomalous by the
models.
2. Unsupervised Setting: The training set com-
prises both normal and anomalous samples, ac-
counting for approximately 80% of the entire
dataset. Specifically, it includes 1,194 normal im-
ages and 57 anomalous images.
Figure 2: Comparison of the thermal images of the melt
pool images in a normal frame and an anomalous (porosity)
frame.
This dual training strategy allowed us to evaluate
the effect of training data composition on model per-
formance. The impact of these training strategies on
model performance is analyzed in the following sec-
tion, considering their effects on classification met-
rics, false positive rates, and overall anomaly detec-
tion accuracy.
3.2 Findings
3.2.1 Correlation Matrix Analysis
The correlation matrix in Figure 3 helps us understand
relationships between different features and provides
insights about the dataset, making it easier to choose
the most useful ones for anomaly detection in DED.
A few key takeaways are as follows:
• Feature Redundancy: Some features, like mean,
median, and Q1, are almost identical (correlation
coefficients ≥ 0.98 ). Keeping just one of them
simplifies the model without losing information.
The same applies to features like variance and
standard deviation.
• Effect on Model Performance: Filtering out
redundant features improves model accuracy.
Models trained on the selected features outper-
formed those using all features (see Tables 1 and
2), with iForest handling variability better than
OCSVM, which was more sensitive to training
data changes.
3.2.2 Classification Metrics
Table 1 and Table 2 summarize the performance met-
rics for the OCSVM and iForest models, respectively.
The evaluation was conducted using different feature
sets and training settings.
For OCSVM, the selected feature set yielded
the best results under the semi-supervised scheme,
achieving a precision of 0.76, a recall of 0.97, and
an F1-score of 0.85. However, performance dropped
significantly in the unsupervised scheme, where pre-
cision and F1-score fell to 0.44, and 0.56, respec-
tively. This suggests that OCSVM is highly sensitive
to training data consistency and may not generalize
well under unsupervised settings.
Similarly, iForest performed best with the selected
features under the semi-supervised scheme, proving
that the semi-supervised approach works better at
capturing anomalies for these models. With a preci-
sion of 0.82, a recall of 0.96, and an F1-score of 0.88.
Unlike OCSVM, iForest maintained relatively better
performance under the unsupervised scenario, with an
Semi-Supervised Anomaly Detection in Directed Energy Deposition Using Thermal Images
441
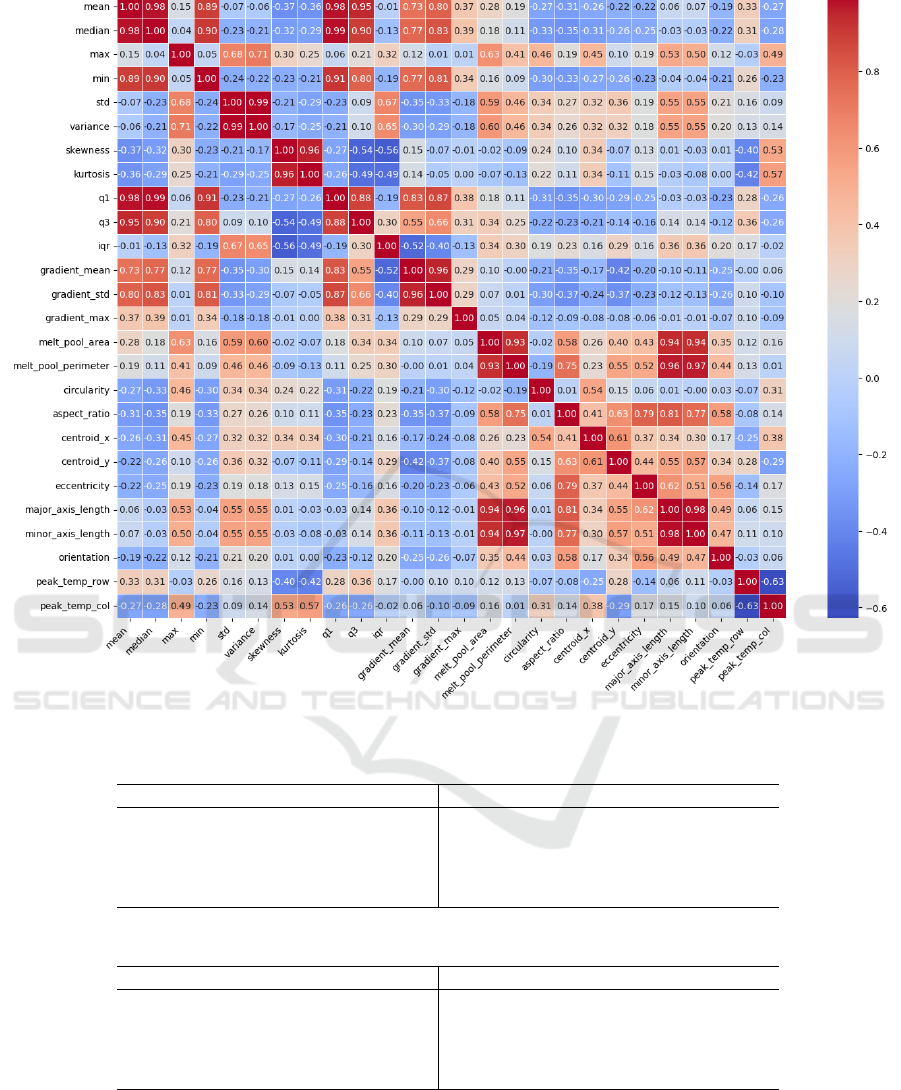
Figure 3: Feature correlation matrix.
Table 1: Results of One-Class SVM (OCSVM).
Feature Set Training Precision Recall F1 Accuracy
All Features
Semi-Supervised 0.75 0.96 0.84 0.93
Unsupervised 0.39 0.67 0.49 0.93
Selected Features
Semi-Supervised 0.76 0.97 0.85 0.93
Unsupervised 0.44 0.77 0.56 0.94
Table 2: Results of Isolation Forest.
Feature Set Training Precision Recall F1 Accuracy
All Features
Semi-Supervised 0.81 0.91 0.86 0.94
Unsupervised 0.62 0.68 0.64 0.96
Selected Features
Semi-Supervised 0.82 0.96 0.88 0.95
Unsupervised 0.74 0.84 0.78 0.98
F1-score of 0.78, indicating its robustness to varying
data distributions.
Overall, using the selected features proved supe-
rior for both models, highlighting their effectiveness
in capturing relevant information. Additionally, iFor-
est demonstrated greater resilience to the unsuper-
vised scheme compared to OCSVM, making it a more
reliable choice in scenarios with data variability.
ICINCO 2025 - 22nd International Conference on Informatics in Control, Automation and Robotics
442
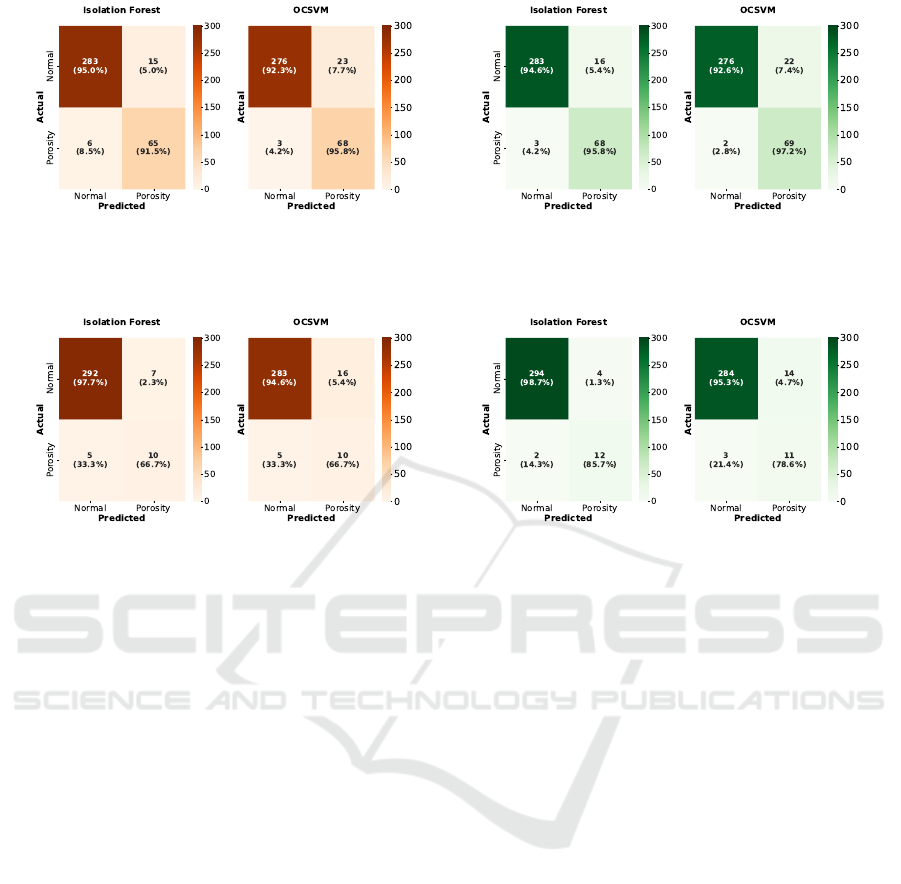
(a) All features (b) Selected features
Figure 4: Confusion matrices for the ML models (semi-supervised setting).
(a) All features (b) Selected features
Figure 5: Confusion matrices for the ML models (unsupervised setting).
3.2.3 Confusion Matrix Analysis
The confusion matrices (see Figures 4 and 5) illustrate
the classification performance of iForest and OCSVM
under different feature sets and training paradigms.
Each confusion matrix represents the average results
obtained over 5-fold cross-validation, ensuring ro-
bustness and mitigating performance fluctuations due
to dataset variability. These matrices allow for a di-
rect comparison of the models in terms of their ability
to correctly identify normal and anomalous samples.
The following key observations are drawn from the
confusion matrices:
Comparison of the Best Results for iForest
and OCSVM: iForest demonstrated a high recall of
95.8%, successfully identifying 68 out of 71 poros-
ity cases (refer to Figure 4b), emphasizing its strong
sensitivity to defects. Additionally, it achieved a pre-
cision of 82%, with 16 normal samples misclassified
as defective. These results lead to an F1-score of
0.88, which reflects a strong balance between detect-
ing defects and limiting false positives. In contrast,
OCSVM exhibited a slightly higher recall of 97.2%,
detecting 69 out of 71 porosity cases, but with a lower
precision of 75.82%, as it misclassified 22 normal
samples as porosity. These results indicate that iFor-
est prioritizes capturing more true defect cases while
maintaining a better balance between false positives
and false negatives, making it more reliable in scenar-
ios where reducing unnecessary false alarms is crit-
ical. On the other hand, OCSVM slightly increases
recall at the expense of more false positives, which
may introduce additional costs in practical DED ap-
plications.
Effect of Feature Selection: Feature selection
played a crucial role in the trade-off between preci-
sion and recall. For iForest, using the selected fea-
tures resulted in a recall of 95.8%. This indicates
that the model correctly detected 68 out of 71 poros-
ity cases, with a false positive rate of approximately
5.4% (refer to Figure 4b). On the other hand, when all
features were used, recall significantly decreased to
91.5%, with a false positive rate of roughly 5%, yield-
ing a lower detection rate for defective instances (re-
fer to Figure 4a). This performance improvement in-
dicates that reducing feature redundancy allowed the
model to better distinguish between normal and de-
fective cases.
Effect of Training Settings: The training scheme
significantly influenced the overall model perfor-
mance, affecting both recall and precision. For
OCSVM, the semi-supervised approach achieved a
precision of 75.8% and a recall of 97.2%, leading to
an F1-score of 85.1%, demonstrating its strong abil-
Semi-Supervised Anomaly Detection in Directed Energy Deposition Using Thermal Images
443

ity to identify defective cases while maintaining a rel-
atively low false positive rate (see Table 1 and Fig-
ure 4b). However, under the unsupervised setting,
performance deteriorated significantly, with precision
dropping to 44% and recall decreasing to 78.6%, re-
sulting in an F1-score of 56.4% (see Table 1 and Fig-
ure 5b). This decline indicates that exposure to mixed
data introduced classification uncertainty, causing the
model to struggle with distinguishing between nor-
mal and defective instances. Similarly, for iForest
(see Table 2 and Figure 4b), training on normal data
(semi-supervised) resulted in a precision of 82%, a
recall of 95.8%, and an F1-score of 87.7%, high-
lighting a strong balance between false positive re-
duction and defect detection sensitivity. In contrast,
when trained under the unsupervised setting, preci-
sion declined to 74%, recall dropped to 85.7%, and
the F1-score decreased to 78% (see Table 2 and Fig-
ure 5b). While iForest demonstrated more robustness
than OCSVM, it still exhibited reduced classification
confidence under the unsupervised scheme, leading to
increased false positives. These findings indicate that
semi-supervised training with exclusively normal data
enhances both recall and precision, ensuring more re-
liable defect detection in DED processes. In contrast,
the unsupervised setting, while more flexible, intro-
duces noise and weakens model performance, partic-
ularly in recall and precision trade-offs.
4 CONCLUSION
This work adopted a semi-supervised anomaly de-
tection approach for defect detection in DED pro-
cesses. It is based on two effective semi-supervised
algorithms: iForest and OCSVM. The results for both
algorithms were compared with an unsupervised set-
ting to highlight the effectiveness of the adopted semi-
supervised approach. The results demonstrate that the
semi-supervised setting, where the training data ex-
clusively includes normal data, significantly enhances
detection performance, as evidenced by higher pre-
cision, recall, and an associated F1-score compared
to the unsupervised setting. Comparing the indi-
vidual algorithms, iForest consistently outperforms
OCSVM in this defect detection task for both set-
tings. In the semi-supervised setting, iForest achieved
an F1-score of 0.88 and a respective accuracy of 95%.
Notably, correlation-based feature selection improved
the models’ effectiveness by removing redundancy
and noise. Specifically, it provided the most robust
and stable performance across both normal-only and
mixed-data training conditions. These findings under-
score the robustness of the semi-supervised approach
for anomaly detection with the notorious data imbal-
ance issue. It also emphasizes the critical importance
of feature selection strategies, training data quality,
and algorithm choice in achieving optimal anomaly
detection outcomes. The proposed approach is highly
adaptable and can be seamlessly extended to defect
detection in other additive manufacturing processes,
such as powder bed fusion.
REFERENCES
Alexopoulou, V. E. (2021). Study and modeling of the tran-
sition from conduction to keyhole mode during SLM
process. Master’s thesis, School of Mechanical Engi-
neering, National Technical University of Athens.
Dass, A. and Moridi, A. (2019). State of the art in directed
energy deposition: From additive manufacturing to
materials design. Coatings, 9(7).
Era, I. Z., Zhou, F., Raihan, A. S., Ahmed, I., Abul-Haj,
A., Craig, J., Das, S., and Liu, Z. (2024). In-situ melt
pool characterization via thermal imaging for defect
detection in directed energy deposition using vision
transformers. arXiv preprint arXiv:2411.12028.
Farea, S. M., Unel, M., and Koc, B. (2024). Defect pre-
diction in directed energy deposition using an ensem-
ble of clustering models. In Proceedings of the 2024
IEEE 22nd International Conference on Industrial In-
formatics (INDIN), pages 1–6.
Gaja, H. and Liou, F. (2018). Defect classification of laser
metal deposition using logistic regression and artifi-
cial neural networks for pattern recognition. Interna-
tional Journal of Advanced Manufacturing Technol-
ogy, 94(1-4):315–326.
Garc
´
ıa-Moreno, A.-I. (2019). Automatic quantification
of porosity using an intelligent classifier. Interna-
tional Journal of Advanced Manufacturing Technol-
ogy, 105(5):1883–1899.
Herzog, T., Brandt, M., Trinchi, A., et al. (2024). Defect
detection by multi-axis infrared process monitoring of
laser beam directed energy deposition. Scientific Re-
ports, 14:3861.
Hespeler, S., Dehghan-Niri, E., Juhasz, M., and Luo, K.
(2022). Deep learning for in-situ layer quality mon-
itoring during laser-based directed energy deposition
(LB-DED) additive manufacturing process. Applied
Sciences, 12(18):8974.
Khanzadeh, M., Chowdhury, S., Marufuzzaman, M.,
Tschopp, M. A., and Bian, L. (2018). Porosity predic-
tion: Supervised-learning of thermal history for direct
laser deposition. Journal of Manufacturing Systems,
47:69–82.
Li, S. H., Kumar, P., and Chandra, S. (2023). Directed
energy deposition of metals: Processing, microstruc-
tures, and mechanical properties. International Mate-
rials Reviews, 2023.
Qin, J., Hu, F., Liu, Y., Witherell, P., and Wang, C. C. L.
(2022). Research and application of machine learning
ICINCO 2025 - 22nd International Conference on Informatics in Control, Automation and Robotics
444

for additive manufacturing. Additive Manufacturing,
52:102014.
Sch
¨
olkopf, B., Platt, J. C., Shawe-Taylor, J., Smola, A. J.,
and Williamson, R. C. (2001). Estimating the support
of a high-dimensional distribution. Neural Computa-
tion, 13(7):1443–1471.
Taheri, H., Koester, L. W., Bigelow, T. A., Faierson, E. J.,
and Bond, L. J. (2019). In situ additive manufactur-
ing process monitoring with an acoustic technique:
clustering performance evaluation using k-means al-
gorithm. Journal of Manufacturing Science and Engi-
neering, 141(4).
Tang, D., He, X., Wu, B., Wang, X., Wang, T., and Li,
Y. (2022). The effect of porosity defects on the mid-
cycle fatigue behavior of directed energy deposited Ti-
6Al-4V. Theoretical and Applied Fracture Mechan-
ics, 2022.
Zamiela, C., Tian, W., Guo, S., and Bian, L. (2023a).
Thermal-porosity characterization data of additively
manufactured ti–6al–4v thin-walled structure via laser
engineered net shaping. Harvard Dataverse. Available
at: https://doi.org/10.7910/DVN/BWHYEH.
Zamiela, C., Tian, W., Guo, S., and Bian, L. (2023b).
Thermal-porosity characterization data of additively
manufactured Ti–6Al–4V thin-walled structure via
laser engineered net shaping. Data in Brief,
51:109722.
Zhao, X., Imandoust, A., Khanzadeh, M., Imani, F., and
Bian, L. (2021). Automated anomaly detection of
laser-based additive manufacturing using melt pool
sparse representation and unsupervised learning. In
Solid Freeform Fabrication Symposium.
Semi-Supervised Anomaly Detection in Directed Energy Deposition Using Thermal Images
445
