
Unsupervised Analysis of Cyclist Performance for Route Segmentation
and Ranking
Rensso Mora-Colque
1 a
and William Robson Schwartz
2 b
1
Data Science Department, Universidad de Ingenieria y Tecnologia UTEC, Barranco, Lima, Peru
2
Department of Computer Science, Universidade Federal de Minas Gerais, Belo Horizonte - MG, Brazil
Keywords:
Cyclist Behavior Analysis, Unsupervised Learning, Temporal Series Autoencoder, Smart Mobility Data.
Abstract:
This paper presents a study on the analysis of cycling tours along a designated route, addressing the limited
attention given to non-professional cyclists in existing research. Unlike previous work focused on elite ath-
letes, this study considers a broader population, including commuters, recreational riders, and fitness-oriented
cyclists. Data was collected using advanced sensors to capture diverse ride characteristics. An unsupervised
learning approach was applied to segment cyclists based on behavioral and performance patterns. Further-
more, a novel ranking method based on genetic algorithms was developed to classify and prioritize cyclist
groups meaningfully. Experiments were conducted on a newly proposed dataset tailored to this objective, en-
abling deeper insights into cycling dynamics across user types. The results validate the effectiveness of both
the segmentation and ranking methods, offering practical implications for route planning and cyclist-focused
infrastructure management.
1 INTRODUCTION
In recent years, the analysis of amateur cycling data
has gained significant attention due to the growing
popularity of cycling as both a sport and a means of
transportation (Holmgren et al., 2017). With advance-
ments in wearable technology and sensors devices, a
substantial amount of data is generated by amateur
cyclists (De Brouwer et al., 2018b), providing a rich
source of information for clustering and prediction
tasks (Hilmkil et al., 2018a). For instance, the ap-
plication of clustering algorithms can help in iden-
tifying different cycling behavior patterns and opti-
mizing group training sessions (Dalton-Barron et al.,
2022). Predictive models can further enhance in-
dividual training plans by forecasting performance
outcomes based on historical data (Mirizio et al.,
2021a). Moreover, the findings can inform city plan-
ners and policymakers to improve cycling infrastruc-
ture, promoting sustainable transportation (Kaiser,
2023). However, most research focuses on profes-
sional cyclists, often neglecting those who cycle for
purposes other than professional competition. This
study aims to address that gap by providing a com-
a
https://orcid.org/0000-0003-4734-8752
b
https://orcid.org/0000-0003-1449-8834
prehensive analysis of the general cyclist, considering
the various motivations and contexts in which cycling
occurs beyond the realm of professional sports.
Nowadays, technology has become a part of the
vast majority of people who engage in any sport (Aro-
ganam et al., 2019). The world of cycling is no excep-
tion, and there is a lot of enthusiasm among cyclists
because information about their routes can be visual-
ized on mobile devices, providing technological sup-
port (Kapousizis et al., 2022). The data displayed can
be diverse; however, in many cases, it is merely infor-
mative and does not imply any intelligence that would
allow an analysis of the route taken. Although the
goals for which people cycle can vary greatly (Zhang
et al., 2024), many cyclists use various computational
models to monitor or track their activity.It is impor-
tant to consider that our work fits into an initial con-
text where, while cyclists may not be professionals,
they at least use basic sensors to monitor their devel-
opment as cyclists. In other words, cyclists want to
understand how they perform in their cycling activity.
Although it is relatively straightforward to differ-
entiate an elite athlete who participates in competi-
tions (Martinez-Noguera et al., 2021), it is more chal-
lenging to do the same for other cyclists, as their goals
can vary widely (van Bon and Vroemen, 2019). This
complicates the definition of what constitutes an ama-
Mora-Colque, R. and Schwartz, W. R.
Unsupervised Analysis of Cyclist Performance for Route Segmentation and Ranking.
DOI: 10.5220/0013722700003982
Paper published under CC license (CC BY-NC-ND 4.0)
In Proceedings of the 22nd International Conference on Informatics in Control, Automation and Robotics (ICINCO 2025) - Volume 1, pages 461-468
ISBN: 978-989-758-770-2; ISSN: 2184-2809
Proceedings Copyright © 2025 by SCITEPRESS – Science and Technology Publications, Lda.
461

teur cyclist. For example, people might ride bikes for
various reasons, such as transportation, health, recre-
ation, improvement of fitness, or training (Fraboni
et al., 2021). In addition, professionals can share
these goals. This ambiguity is reflected in the lit-
erature, where a large majority of studies focus on
elite athletes (Phillips and Hopkins, 2020), specifi-
cally on prediction models for races or route devel-
opment (Kataoka and Gray, 2019). However, with the
increasing number of cyclists and the use of new tech-
nologies, new models are necessary that include all
types of cyclist (Murillo Burford, 2020).
To delineate between a cyclist with general objec-
tives and a dedicated athlete, we can employ the no-
tion of metrics used to measure their level of train-
ing. Generally, a cyclist oriented towards competi-
tion conducts various tests to calculate values such as
PSP (Power Sustained Peak), FTP (Power Threshold
Function), and VO2 max, among others (Jeukendrup
and Diemen, 1998). These values help predict their
performance based on factors such as power output,
heart rate, caloric expenditure, and lactic acid usage.
Nonetheless, most cyclists do not perform these types
of tests. Therefore, we can establish a division be-
tween cyclists who train based on classical metrics
(whom we will call non-amateur cyclists) and those
who, for various reasons, do not perform these classi-
cal tests. Then, our study focuses on information that
can be obtained from the latter cyclists.
Our proposal aims to provide cyclists with infor-
mation about their performance on a specific route
through the analysis of cyclists who have completed
that route. Unlike an individual study, our model con-
ducts a collective study by collecting data from all
cyclists who complete the same route. With this in-
formation, the idea is to create clusters and provide
cyclists with insights into cyclist behavior. Also our
model provides a cluster categorization, in such a way
that they generate a growing categorical organization
based on optimization criteria. Therefore, our model
aims to generate meaningful groupings based on opti-
mization criteria, facilitating the categorization of cy-
clists. This enables cyclists seeking to improve their
performance to target climbs within their assigned
category. It is important to note that our model pro-
duces groupings specific to each route, which is rea-
sonable given that different routes serve distinct ob-
jectives. Consequently, the model can be effectively
applied across various contexts.
One of the main motivations is that there are many
enthusiastic cyclists interested in learning more about
their development with the bicycle (De Brouwer et al.,
2018a). This is important because it introduces the
need for models that provide more specialized infor-
mation to the cyclist. While cycling as a sport has
been studied for a long time by sports professionals, it
is important to highlight that our proposal and the fo-
cus of our study lie in a computational model. There-
fore, the idea is to provide a technological tool for all
types of cyclists. This poses a challenge as the met-
rics used require specific preparation and protocols,
along with information that a new or amateur cyclist
may not have. In this sense, the analysis conducted is
much broader, based on common information from a
particular route. The main contributions of our pro-
posed approach are: i) A simple model that allows
generating sets of cyclists and performing a classifi-
cation based on that segmentation. ii) A new database
that contains a diversity of types of cyclists, including
non professional individuals. iii) The proposed model
performs an unsupervised analysis of a specific route,
providing a ranking of the established clusters.
2 RELATED WORK
Collective Analysis and Hierarchy. An important as-
pect in most studies is the number of athletes or cy-
clists observed for the analyses. Usually, they em-
ploy between five to fifteen cyclists (Hilmkil et al.,
2018b; Thiel and Sarkar, 2014). Despite the fact that
this range of values can be somewhat arbitrary, we
can divide the studies into two groups: those that em-
ploy a few cyclists for their research and those where
the number of cyclists exceeds hundreds (Mart
´
ınez-
Cevallos et al., 2020; Baron et al., 2023). With the
latter group being the focus of our analysis.
The idea of being able to perform clustering is
precisely to create a kind of hierarchy where the cy-
clist can somehow determine the characteristics of the
group to which they belong (Cejuela et al., 2024).
Some works present hierarchies based on the gen-
eral objective of the paper. We can highlight pro-
posals (Mart
´
ınez-Cevallos et al., 2020; Gallo et al.,
2021) that are based on data analysis from survey in-
formation, where the process is more statistical and
does not require an advanced learning model (Mirizio
et al., 2021b). Other models (Cesanelli et al., 2024)
use information from cyclists to generate hierarchies
using computational algorithms; however, these anal-
yses are usually not collective in nature, as the focus
of these works is more individual. Our model aims to
propose a hierarchy based on a collective analysis of
the data. This analysis can be conducted with limited
sensor information and in various cycling contexts.
A similar work to ours is proposed in (van der
Zwaard et al., 2019), which aims to categorize cy-
clists using unsupervised analysis through clustering
ICINCO 2025 - 22nd International Conference on Informatics in Control, Automation and Robotics
462

algorithms like K-means. However, this study uses
static information regarding the cyclists, whereas our
model introduces temporal data from bicycle sensors,
providing a different perspective on the information.
Clustering Methods. In the realm of clustering
and classification, recent research has employed var-
ious algorithms to segment athletes based on phys-
iological and performance data. One study clas-
sified cyclists according to their fatigue outcomes
from ultra-endurance events, using cluster analysis
to identify distinct groups with different fatigue re-
sponses (Lewis et al., 2016). Another study utilized
k-means clustering to group amateur cyclists based
on observational data, which helped in understanding
different training and performance profiles (Priego
et al., 2018). However, clustering and classification
models also have their drawbacks. One of the main
challenges is the high variability in cyclists’ perfor-
mance data, which can lead to overfitting in classifi-
cation models. Moreover, many studies focus on elite
athletes, often neglecting recreational or less compet-
itive cyclists. This gap indicates a need for more in-
clusive research that encompasses a broader spectrum
of the cycling population. Despite these challenges,
the use of clustering and classification in cycling re-
search shows promise. For example, cluster analy-
sis has been used effectively to understand the im-
pact of different training regimens on cyclists’ per-
formance and to tailor training programs accordingly
(Ørtenblad et al., 2013). Additionally, classification
models have been instrumental in identifying key fac-
tors that influence performance and recovery in ultra-
endurance events (Mrakic et al., 2015).
3 APPROACH
Route Representation. Given a specific route, we de-
fine a set R, where each element r ∈ R represents a cy-
clist’s completion of the route. Each observation r is a
sequence of variables p, such as speed, heart rate, and
power output, collected over time. The data construc-
tion process is detailed in Section 4. Importantly, the
number of observations within each r may vary due
to differences in completion times among cyclists. To
generate a compact, unsupervised representation of
the performance of a cyclist on a route, we use a time
series autoencoder, a well-established technique for
encoding temporal data.The proposed architecture is
shown in Figure 1. The input to the model consists
of sequential segments r[i, i + 1, . . . , i + l] ∈ r at time
step i, where l defines the temporal window. Each
variable is processed through an LSTM cell, with the
resulting hidden states (h) stacked and flattened. This
Relu
Relu
Relu
Relu
LSTM
LSTM
Stack
Flat
MLP
MLP
MLP
Features
LSTM
LSTM
Relu
LSTM
...
...
Figure 1: Time series autoencoder architecture. The en-
coder processes sequential segments using LSTM cells,
while the decoder reconstructs the signal through MLP lay-
ers. The latent representation is extracted from the second
MLP layer.
representation is passed through three multilayer per-
ceptron (MLP) layers, introducing a bottleneck at the
second layer. The output of this bottleneck layer de-
fines the feature vector f
r
. Subsequently, the model
reconstructs the original sequence, and training is
guided by a Mean Squared Error (MSE) loss function.
The core idea behind this architecture is to leverage
LSTM cells to capture temporal dependencies, while
the MLP layers combine and abstract these dependen-
cies into a concise feature representation, effectively
integrating both sequential patterns and multivariate
relationships.
Dual-Stage Clustering. Although simple, the bag-
of-words model remains widely used in various do-
mains (Bakheet et al., 2023). We adopt this ap-
proach in a two-stage clustering process. First, the K-
means algorithm is applied to the set of segment fea-
ture vectors F
r
extracted from the autoencoder, pro-
ducing K centroids. Using the same temporal seg-
mentation as in the autoencoder input, each segment
is assigned to its nearest centroid. This assignment
builds a histogram g
r
representing the distribution
of feature types throughout the route. Next, a sec-
ond clustering step is performed on the set of his-
tograms g
r
. At this stage, Spectral Clustering (Ng
et al., 2001) is employed to partition the data into
a set of clusters C. The reason for using two dif-
ferent clustering algorithms lies in the nature and
goals of each stage. Initially, K-means efficiently
captures diverse patterns across a large set of time-
series segments. Subsequently, Spectral Clustering,
which excels in identifying non-convex and intricate
data structures, organizes the histograms into more
meaningful groups. This dual-stage clustering strat-
egy ensures both fine-grained feature discovery and
high-level pattern grouping, ultimately enhancing the
Unsupervised Analysis of Cyclist Performance for Route Segmentation and Ranking
463

interpretability of the results.
Group Categorization. Based on the centroids C ob-
tained in the previous stage, our model builds a hier-
archical categorization of cyclist behavior. To achieve
this, we apply NSGA-II, a widely used genetic algo-
rithm for multi-objective optimization (Yang, 2014).
In our setting, NSGA-II ranks the clusters by opti-
mizing a set of domain-specific objectives, reflecting
characteristics that we seek to maximize or minimize.
The output is an ordered list of clusters, providing
a categorization criterion grounded in multiple rele-
vant variables. It is crucial to note that the goal of
this categorization is not to summarize cyclists based
on a single variable but to organize them based on
multivariate behavior patterns observed during route
completion. By grouping cyclists with similar multi-
dimensional performance profiles, our model offers a
reference framework for cyclists to assess their pro-
gression and identify performance benchmarks rela-
tive to others who completed the same route. This
structured categorization facilitates meaningful com-
parisons and provides deeper insights into training
and competition strategies.
4 EXPERIMENT RESULTS AND
DISCUSSION
To conduct the experiments, we introduced a new
dataset called Lagoa. It contains information from
several cyclists performing a route around the Pam-
pulha Lagoon located in Belo Horizonte, Minas
Gerais, Brazil. The data are: time, heart rate,
smoothed velocity, grade smooth, watts, distance and
other variables that were not considered in our analy-
sis because they appeared only in the records of a few
cyclists. The database contains information on 126
cyclists, for whom |R| = 1014 rides were recorded.
The vast majority of cyclists rode around the lake
multiple times.
Data Preparation. The Lagoa dataset consists of a
list of observations. Each observation represents the
start and end of an entire route taken by the cyclist.
Specifically, it records the complete lap around the la-
goon, which has a perimeter of 18 km. Each element
is composed of four main data points: observations
per unit of time, cyclist ID, general statistics, and the
date when the route was completed. In our experi-
ments, we only used the observations r for clustering
and data analysis, and the cyclist ID r
id
for classifica-
tion.
Essentially, r is the time series in the form of a
matrix with n rows and m columns, where each row
n
i
represents data collected at a specific time t. This
information is obtained from sensors installed on the
bicycle or carried by the cyclist. A key feature of
our study is the use of data from popular sensors that
most cyclists can install on their bicycles. In our anal-
ysis, we use information on speed, heart rate, and
watts. Additionally, we employ grade smooth also for
a better analysis. We include the time information in
each row to enable preprocessing since, in the obser-
vations, data recording does not always occur every
second. To minimize the processing time of the au-
toencoder and avoid redundant data, we use intervals
of q = 5 seconds, nonetheless for final cyclist repre-
sentation, the interval is q = 1, we can see this in-
terval as the overlapping in a time series. Thus, if a
cyclist records data every second, we take the aver-
age of all information in the q interval. Generally, in
the database, the recording interval does not exceed
this time. Another important aspect of the database is
that while most cyclists complete the full lap, a small
group does not reach 18 km. Therefore, to obtain a
consistent dataset, we filter using the distance trav-
eled, ensuring that all cyclists covered at least 16 km,
which becomes our endpoint. This allows us to in-
clude the information of all cyclists in the database.
Note that although we use the time and distance data
present in the database observations, these variables
will not be part of the data representation process.
Experiments Methodology. For our experiments, we
used two configurations that differ primarily by the in-
troduction of an additional variable in the time series.
The first configuration A, uses the variables: speed,
heart rate, and watts. In the second configuration B,
we added the variable grade smooth to the existing
configuration A. Our proposal was developed using
a computer with 25 GB of RAM, 40 core processors,
and a 11 GB of memory GeForce GTX 1080 Ti graph-
ics card. The complete framework was deployed in
Python language.
Autoencoder Training and Feature Extraction. For
training the autoencoder, the Adam optimizer was
utilized. The model underwent 20 epochs to opti-
mize the MSE loss function. For this training, each
dataset was divided into 80% for training and 20%
for validation, with elements selected randomly. Be-
fore starting the training of the models, the data was
normalized using Z-normalization. For configuration
A, the loss value was 0.0005 for validation and test-
ing. In the case of configuration B, the loss value were
0.0011 and 0.0019 for validation and testing, respec-
tively. The autoencoder takes time series as input and
output, and the time range l used in our experiments is
10 observations. Note that the model varies according
to the number of variables used. In the case of con-
figuration A, the initial part of the encoder consists of
ICINCO 2025 - 22nd International Conference on Informatics in Control, Automation and Robotics
464
three layers containing LSTM cells, whereas in con-
figuration B, there are four LSTM cells. Once the
network was trained, for both configurations A and
B, features were extracted from all elements associ-
ated with each configuration. To clarify, in configu-
ration A, the data contains only three variables, while
in configuration B, information from another sensor
is added. Certainly, the data is the same, but with an
additional variable. However, the autoencoder model
changes in the number of LSTM cells.
Clustering. The clustering stage is divided into two
processes: time window clustering and clustering for
the generation of a bag of words. The objective is to
describe small route segments r[i, i + l] and use this
granular information to describe the entire route r.
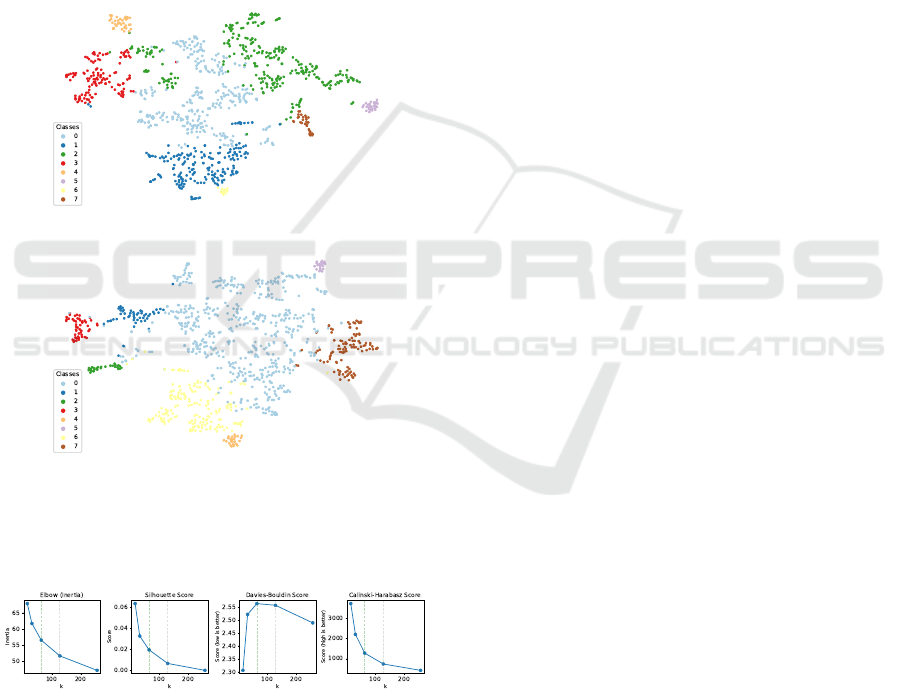
(a) Configuration A
(b) Configuration B
Figure 2: T-SNE visualization of both configurations of all
routes R in dataset. These figures present the c = 8 centroids
generated by Spectral clustering.
Figure 3: Clustering evaluation metrics across different
numbers of clusters The vertical dashed lines at k=64 and
k=128 highlight a candidate value.
The first clustering uses features extracted from
the autoencoder. Given a time window of l = 10 with
a stride of s = 5 observations of the time series, this
means that the features extracted from the autoen-
coder correspond to a minimum span of 50 seconds
(in our dataset). These feature vectors are grouped
into k = 64 clusters. The choice of k = 64 emerges as
a suitable balance between cluster compactness, sep-
aration, and model complexity. At this value, the in-
ertia shows diminishing returns (elbow point), the sil-
houette score remains positive, unlike at higher val-
ues where it becomes negative, and both the Davies-
Bouldin and Calinski-Harabasz indices indicate stable
and well-defined clustering. This suggests that k = 64
provides meaningful structure without overfragment-
ing the data. Figure 3 graphically presents this analy-
sis.
Once the k centroids are obtained, the route de-
scriptor is constructed using a bag-of-words strat-
egy (Jurafsky and Martin, 2009). In this case, the
stride within the time series is s = 1, ensuring that
each route segment contributes information to the cre-
ation of the feature vector g
r
(64 dimensions). Fig-
ure 2 shows the segments generated using the Spectral
Clustering algorithm. For visualization purposes, we
use T-SNE for dimensionality reduction. In our exper-
iments, the number of selected segments or clusters is
8, and the number of components is the same. The
affinity matrix is constructed by calculating the graph
with nearest neighbors, and the number of different
K-means seeds is set to 10. To facilitate interpretation
of Figure 2, Table 1 presents the mean and standard
deviation of the elements belonging to each segment
for both configurations. The numbers and colors in
Figure 2 correspond to the values in the Class column
of Table 1.
Ranking the Segments. To generate the cluster rank-
ing, NSGA-II (Yang, 2014) genetic algorithm is em-
ployed. The input to this model is a matrix for each
configuration, containing the means of the centroids
(the µ columns of each variable in Table 1). The
data is normalized using Z-scaling before being used
as input. The hyperparameter n specifies the num-
ber of times the generator function is called to cre-
ate an individual, with n=3 indicating that each indi-
vidual is initialized with three genes. An important
hyperparameter in the final stage of our framework
is the weight vector of the fitness function. For the
experiments conducted, the vector is [0.3, −0.3, 0.4]
(speed, heart rate, watts), aiming to maximize speed
and watts while minimizing heart rate. This distribu-
tion is inspired by the studies presented by (Garvican
et al., 2015) and is crucial for optimizing cyclist per-
formance metrics.
In Tables 2 and 3, the ranking generated by the
optimization algorithm is shown. The ‘Class’ column
represents the cluster number, colored according to
its assigned color. Cells with the highest (dark gray)
and lowest (light gray) values in each column are also
Unsupervised Analysis of Cyclist Performance for Route Segmentation and Ranking
465

Table 1: Variable centroids for configurations A and B.
Configuration A Configuration B
Velocity Heartrate Watts Velocity Heartrate Watts
Class µ σ µ σ µ σ µ σ µ σ µ σ
0 9.70 0.35 148.44 4.08 192.26 18.03 9.09 0.37 144.58 3.78 173.61 20.38
1 10.90 0.54 152.84 4.67 232.71 32.94 8.99 0.34 125.67 2.85 163.67 15.86
2 8.52 0.36 133.01 3.41 147.41 20.68 10.19 0.31 112.50 3.18 180.83 20.09
3 8.75 0.33 161.09 4.11 169.20 18.15 7.89 0.25 110.63 3.46 124.17 16.59
4 7.16 0.36 143.40 3.51 142.85 15.67 11.58 0.55 170.44 4.33 252.31 17.35
5 7.86 0.16 105.58 2.34 125.65 13.06 7.01 0.22 143.44 2.93 145.35 9.27
6 12.02 0.30 158.44 1.59 200.62 72.80 10.95 0.52 148.42 4.63 220.39 37.46
7 9.78 0.32 113.31 2.90 174.11 14.48 8.84 0.32 162.86 4.24 175.63 17.63
highlighted. The algorithm creates a hierarchy that
ranks the groups based on a specific criterion. In our
experiment, the goal is to minimize heart rate while
maximizing both watts and velocity. In the weighting
used, slightly more importance is given to watts, as
velocity is highly correlated with power output.
Table 2: Configuration A (Data ordered by Rnk in descend-
ing order).
Measurements
Class Velocity Heartrate Watts Rnk
1 10.90 152.84 232.71 7
6 12.02 158.44 200.62 6
7 9.78 113.31 174.11 5
0 9.70 148.44 192.26 4
5 7.86 105.58 125.65 3
2 8.52 133.01 147.41 2
3 8.75 161.09 169.20 1
4 7.16 143.40 142.85 0
Table 3: Configuration B (Data ordered by Rnk in descend-
ing order).
Measurements
Class Velocity Heartrate Watts Rnk
4 11.58 170.44 252.31 7
6 10.95 148.42 220.39 6
2 10.19 112.50 180.83 5
1 8.99 125.67 163.67 4
0 9.09 144.58 173.61 3
3 7.89 110.63 124.17 2
7 8.84 162.86 175.63 1
5 7.01 143.44 145.35 0
Discussion. In this section, we will discuss several
key aspects of our research, starting with the proposed
model, examining variables, and analyzing specific
points from the results.
Although the proposed model, as a feature extrac-
tor, presents a relatively simple architecture, it is ef-
fective for our purposes. It is important to highlight
that the algorithm’s primary objective is to achieve a
representation of the route or tour. From a modular
perspective, our approach requires a model that char-
acterizes the tour. Given the unsupervised nature of
our method, we can assert, based on the visualiza-
tion in Figure 2 and the data from Table 1, that the
autoencoder successfully describes the segments con-
sidering the employed variables. This is significant as
our model differs from conventional models that pro-
cess multivariate time series data. In our case, the first
MLP layer handles this information processing.
The selection of the number of clusters is another
important aspect to discuss. Given that these values
are somewhat arbitrary, we chose 64 clusters for the
K-means algorithm and 8 clusters for the spectral al-
gorithm. These choices are justified as follows: In
the case of K-means clustering, determining the num-
ber of segments is difficult without prior knowledge
of the route or a criterion to establish an appropri-
ate number of clusters for a given route. To ensure
robustness across different types of routes, we based
the selection on the number of segments that could
be generated from the route information. Specifically,
the 64 clusters generate sufficient information for the
histograms that describe the routes to be representa-
tive. Although this choice is somewhat arbitrary and
dependent on the number of observations per tour, we
found it suitable for our experiments, especially after
conducting tests with 128 clusters. For spectral clus-
tering, which uses only 8 clusters, we selected this
number primarily because, in an unsupervised setting,
we can assume the number of groups we want to rep-
resent. Determining the exact number is challenging,
as cyclists undertaking the routes are not necessarily
professionals or trained athletes (Lewis et al., 2016),
thus excluding models that rely on precise metrics like
VO2max or FTP (Pardo Albiach et al., 2021) or an-
thropometric measures (van der Zwaard et al., 2019).
Our experiments aim to demonstrate that it is possible
to generate sets and provide a ranking, with the num-
ber of sets being a hyperparameter for further study.
ICINCO 2025 - 22nd International Conference on Informatics in Control, Automation and Robotics
466

We believe that the choice of values is not a limita-
tion but rather parameters that can be fine-tuned de-
pending on the specific characteristics of the routes
our model is applied to. However, we consider it
a good starting point for future research (de Leeuw
et al., 2023) on our proposal and new models that ex-
plore the optimal selection of hyperparameters.
Given the information on speed, power (watts),
and heart rate, a cyclist typically aims to achieve
higher speeds or generate more power while mini-
mizing their heart rate (Mazzoleni et al., 2016). This
goal reflects the desire to enhance performance by in-
creasing speed and power output—indicators of im-
proved athletic capability—without corresponding in-
creases in physiological strain (Burke, 2001). By
maintaining a lower heart rate, the cyclist can reduce
fatigue and sustain high performance over longer peri-
ods (Schnohr et al., 2006). Therefore, the objective is
to optimize these metrics to become faster and more
powerful while experiencing less fatigue, ultimately
improving overall efficiency and endurance.
5 CONCLUSIONS
This study presents an innovative approach to analyz-
ing and clustering cyclists along a given route, regard-
less of their experience or physical condition. Using
autoencoders, we model the routes and apply unsu-
pervised learning to segment cyclists and rank them
meaningfully, despite challenges such as data vari-
ability, sensor limitations, and the absence of stan-
dardized physical metrics. Our method is designed
to work with basic, low-cost sensors and considers
the diverse motivations behind cycling. The proposed
model enables the positioning of new cyclists within
identified clusters and offers general yet practical in-
sights applicable to various types of users and routes.
We also highlight opportunities for future work, in-
cluding expanding the dataset and exploring hyperpa-
rameter tuning to refine behavioral analysis and pro-
vide personalized recommendations based on cluster
profiles.
ACKNOWLEDGEMENTS
The authors would like to thank the National Coun-
cil for Scientific and Technological Development –
CNPq (Grant 312565/2023-2).
REFERENCES
Aroganam, G., Manivannan, N., and Harrison, D. (2019).
Review on wearable technology sensors used in con-
sumer sport applications. Sensors, 19(9).
Bakheet, S., Al-Hamadi, A., Soliman, E., and Heshmat,
M. (2023). Hybrid bag-of-visual-words and fea-
turewiz selection for content-based visual information
retrieval. Sensors, 23(3).
Baron, E., Janssens, B., and Bogaert, M. (2023). Bike2vec:
Vector embedding representations of road cycling rid-
ers and races. In Proceedings of the 10th MathSport
International Conference.
Burke, L. (2001). Improving cycling performance: How
should we spend our time and money? Sports
Medicine, 31(7):521–532.
Cejuela, R., Ar
´
evalo-Chico, H., and Sell
´
es-P
´
erez, S. (2024).
Power profile during cycling in world triathlon series
and olympic games. Journal of Sports Science and
Medicine, 23(1):25–33.
Cesanelli, L., Lagoute, T., Ylaite, B., Calleja-Gonz
´
alez, J.,
Fern
´
andez-Pe
˜
na, E., Satkunskiene, D., Leite, N., and
Venckunas, T. (2024). Uncovering success patterns
in track cycling: Integrating performance data with
coaches and athletes’ perspectives. Applied Sciences,
14(7).
Dalton-Barron, N., Palczewska, A., Weaving, D., Rennie,
G., Beggs, C., Roe, G., and Jones, B. (2022). Clus-
tering of match running and performance indicators
to assess between- and within-playing position simi-
larity in professional rugby league. Journal of Sports
Sciences, 40(15):1712–1721.
De Brouwer, M., Ongenae, F., Daneels, G., Municio, E.,
Famaey, J., Latr
´
e, S., and De Turck, F. (2018a). Per-
sonalized real-time monitoring of amateur cyclists on
low-end devices: Proof-of-concept & performance
evaluation. In WWW ’18: The Web Conference 2018,
pages 1833–1840.
De Brouwer, M., Ongenae, F., Daneels, G., Municio, E.,
Famaey, J., Latr
´
e, S., and De Turck, F. (2018b). Per-
sonalized real-time monitoring of amateur cyclists on
low-end devices: Proof-of-concept and performance
evaluation. In WWW ’18: Companion Proceedings of
the The Web Conference 2018, pages 1833–1840.
de Leeuw, A.-W., Oberkofler, T., Heijboer, M., and Knobbe,
A. (2023). Athlete monitoring in professional road cy-
cling using similarity search on time series data. In
Brefeld, U., Davis, J., Van Haaren, J., and Zimmer-
mann, A., editors, Machine Learning and Data Min-
ing for Sports Analytics, pages 115–126. Springer Na-
ture Switzerland.
Fraboni, F., Prati, G., Casu, G., De Angelis, M., and Pietran-
toni, L. (2021). A cluster analysis of cyclists in eu-
rope: common patterns, behaviours, and attitudes.
Transportation, 49.
Gallo, G., Filipas, L., Tornaghi, M., Garbin, M., Codella,
R., Lovecchio, N., and Zaccaria, D. (2021). Thresh-
olds power profiles and performance in youth road cy-
cling. International Journal of Sports Physiology and
Performance.
Unsupervised Analysis of Cyclist Performance for Route Segmentation and Ranking
467

Garvican, L., Clark, B., Martin, D., Schumacher, Y., Mc-
Donald, W., and Stephens, B. (2015). Impact of al-
titude on power output during cycling stage racing.
PLOS ONE, 10(12):e0143028.
Hilmkil, A., Ivarsson, O., Johansson, M., Kuylenstierna,
D., and van Erp, T. (2018a). Towards machine learn-
ing on data from professional cyclists. In Proceedings
of the 12th World Congress on Performance Analysis
of Sports, pages 168–176, Opatija-Croatia. Faculty of
Kinesiology, University of Zagreb.
Hilmkil, A., Ivarsson, O., Johansson, M., Kuylenstierna, D.,
and van Erp, T. (2018b). Towards machine learning
on data from professional cyclists. In Proceedings of
the 12th World Congress on Performance Analysis of
Sports, pages 168–176, Opatija, Croatia. Faculty of
Kinesiology, University of Zagreb.
Holmgren, J., Aspegren, S., and Dahlstr
¨
oma, J. (2017). Pre-
diction of bicycle counter data using regression. Pro-
cedia Computer Science, 113:502–507.
Jeukendrup, A. E. and Diemen, A. V. (1998). Heart rate
monitoring during training and competition in cy-
clists. Journal of sports sciences, 16 Suppl:S91–9.
Jurafsky, D. and Martin, J. H. (2009). Speech and language
processing. Prentice Hall series in artificial intelli-
gence. Prentice Hall, Pearson Education International,
2. ed., [pearson international edition] edition.
Kaiser, S. K. (2023). Predicting cycling traffic in cities:
Is bike-sharing data representative of the cycling vol-
ume? In ICLR 2023 Workshop on Tackling Climate
Change with Machine Learning.
Kapousizis, G., Ulak, M., Geurs, K., and Havinga, P.
(2022). A review of state-of-the-art bicycle technolo-
gies affecting cycling safety: level of smartness and
technology readiness. Transport Reviews, 43:1–23.
Kataoka, Y. and Gray, P. (2019). Real-time power perfor-
mance prediction in tour de france. In Brefeld, U.,
Davis, J., Van Haaren, J., and Zimmermann, A., edi-
tors, Machine Learning and Data Mining for Sports
Analytics, pages 121–130, Cham. Springer Interna-
tional Publishing.
Lewis, N. A., Towey, C., Bruinvels, G., Howatson, G., and
Pedlar, C. R. (2016). Clustering classification of cy-
clists according to the acute fatigue outcomes pro-
duced by an ultra-endurance event. European Journal
of Human Movement.
Martinez-Noguera, F., Alcaraz, P., Ortolano-R
´
ıos, R., Du-
four, S., and Mar
´
ın-Pag
´
an, C. (2021). Differences
between professional and amateur cyclists in endoge-
nous antioxidant system profile. Antioxidants, 10:282.
Mart
´
ınez-Cevallos, D., Proa
˜
no-Grijalva, A., Alguacil, M.,
Duclos-Bast
´
ıas, D., and Parra-Camacho, D. (2020).
Segmentation of participants in a sports event using
cluster analysis. Sustainability, 12(14).
Mazzoleni, M., Battaglini, C., Martin, K., et al. (2016).
Modeling and predicting heart rate dynamics across
a broad range of transient exercise intensities during
cycling. Sports Engineering, 19(2):117–127.
Mirizio, G. G., Mu
˜
noz, R., Mu
˜
noz, L., Ahumada, F., and
Del Coso, J. (2021a). Race performance prediction
from the physiological profile in national level youth
cross-country cyclists. International Journal of Envi-
ronmental Research and Public Health, 18:5535.
Mirizio, G. G., Mu
˜
noz, R., Mu
˜
noz, L., Ahumada, F., and
Del Coso, J. (2021b). Race performance prediction
from the physiological profile in national level youth
cross-country cyclists. International Journal of Envi-
ronmental Research and Public Health, 18:5535.
Mrakic, S., Gussoni, M., Moretti, S., Pratali, L., Giardini,
G., Tacchini, P., Dellanoce, C., Tonacci, A., Mastorci,
F., Borghini, A., Montorsi, M., and Vezzoli, A. (2015).
Effects of mountain ultra-marathon running on ros
production and oxidative damage by micro-invasive
analytic techniques. PLoS ONE, 10(11):e0141780.
Murillo Burford, E. (2020). Predicting cycling performance
using machine learning. Master’s thesis, Wake For-
est University Graduate School of Arts and Sciences,
Winston-Salem, North Carolina. A Thesis Submitted
in Partial Fulfillment of the Requirements for the De-
gree of Master of Science in Computer Science.
Ng, A., Jordan, M., and Weiss, Y. (2001). On spectral clus-
tering: Analysis and an algorithm. In Dietterich, T.,
Becker, S., and Ghahramani, Z., editors, Advances in
Neural Information Processing Systems, volume 14.
MIT Press.
Ørtenblad, N., Westerblad, H., and Nielsen, J. (2013). Mus-
cle glycogen stores and fatigue. The Journal of Phys-
iology, 591(18):4405–4413.
Pardo Albiach, J., Mir-Jimenez, M., Hueso Moreno, V.,
N
´
acher Molt
´
o, I., and Mart
´
ınez-Gramage, J. (2021).
The relationship between vo2max, power manage-
ment, and increased running speed: Towards gait pat-
tern recognition through clustering analysis. Sensors,
21(7).
Phillips, K. and Hopkins, W. (2020). Determinants of cy-
cling performance: a review of the dimensions and
features regulating performance in elite cycling com-
petitions. Sports Medicine - Open, 6.
Priego, J. I., Kerr, Z. Y., Bertucci, W. M., and Carpes, F. P.
(2018). The categorization of amateur cyclists as re-
search participants: Findings from an observational
study. Journal of Sports Sciences, 36(17):2018–2024.
Schnohr, P., O’Keefe, J. H., Marott, J. L., Lange, P., Jensen,
G. B., Riegger, G. A., Allard, N. A., and Green, C. A.
(2006). Intensity versus duration of cycling, impact
on all-cause and coronary heart disease mortality: the
copenhagen city heart study. European Journal of
Preventive Cardiology, 9(5):924–930.
Thiel, D. and Sarkar, A. (2014). Swing profiles in sport:
An accelerometer analysis. Procedia Engineering,
72:624–629.
van Bon, M. and Vroemen, G. (2019). Power speed profile:
Performance model for road cycling.
van der Zwaard, S., de Ruiter, C. J., Jaspers, R. T., and
de Koning, J. J. (2019). Anthropometric clusters of
competitive cyclists and their sprint and endurance
performance. Frontiers in Physiology, 10.
Yang, X.-S. (2014). Chapter 14 - multi-objective optimiza-
tion. In Yang, X.-S., editor, Nature-Inspired Optimiza-
tion Algorithms, pages 197–211. Elsevier, Oxford.
Zhang, R., Te Br
¨
ommelstroet, M., Nikolaeva, A., and Liu,
G. (2024). Cycling subjective experience: A concep-
tual framework and methods review. Transportation
Research Part F: Traffic Psychology and Behaviour,
101:142–159.
ICINCO 2025 - 22nd International Conference on Informatics in Control, Automation and Robotics
468
