
A Smartwatch-Based Approach to Support and Analysis
of Driver Stress and Anxiety
Tiago Mota de Oliveira
1 a
, Andr
´
e Roberto Ortoncelli
2 b
, Claudemir Casa
1 c
,
Claudinei Casa
3 d
and Luciano Silva
1 e
1
Federal University of Paran
´
a, Polytechnic Center, Curitiba, Brazil
2
Federal University of Technology, Paran
´
a, Dois Vizinhos, Brazil
3
Pontifical Catholic University of Paran
´
a, Curitiba, Brazil
Keywords:
Smartwatch, Stress Detection, Driving Education, Human-Computer Interaction, Emotional Regulation.
Abstract:
This study presents a smartwatch-based solution for monitoring drivers’ stress and anxiety levels using heart
rate data, standing out for not requiring synchronization with other devices. The system captures heart rate
variations and GPS coordinates, offering real-time feedback to assist drivers while storing all data in a cloud
database for subsequent expert analysis. Additionally, a reporting tool is provided to help specialists (e.g.,
psychologists) evaluate drivers’ emotional states and offer appropriate support. A pilot study was conducted
with eleven students from a driver training center during practical lessons to assess the proposed system. The
results show that the application was positively received by all participants, with two expressing interest in
using it beyond the study. These findings suggest that the proposed solution could enhance driver well-being
and preparedness, particularly among new drivers.
1 INTRODUCTION
Traffic accidents are one of the world’s leading causes
of death (and the primary cause for individuals aged
5 to 29) resulting in approximately 1.19 million fatal-
ities and between 20 and 50 million non-fatal injuries
worldwide each year (WHO, 2023). In addition to the
consequences for victims and their families, these in-
cidents entail high economic costs, such as hospital
expenses (Alhaek et al., 2024). In Brazil, in 2024,
there were more than 13 thousand deaths and more
than 1 million injuries in traffic accidents (Minist
´
erio
dos Transportes, 2023).
Factors such as stress, anxiety and fear of driv-
ing contribute to the number of traffic accidents and
cause other problems for drivers. For example, ex-
cessive stress generally leads to degraded driving per-
formance, which increases the risk of road accidents
(Zhao et al., 2024). Furthermore, driving anxiety cor-
relates with poorer quality of life (Stephens et al.,
a
https://orcid.org/0000-0001-7943-268X
b
https://orcid.org/0000-0001-9622-8525
c
https://orcid.org/0000-0002-1812-4701
d
https://orcid.org/0009-0002-9723-3865
e
https://orcid.org/0000-0001-6341-1323
2024), and finally, amazophobia (fear of driving), af-
fects about 10% of the world’s population (Craske
et al., 2009). In fact, individuals with amaxopho-
bia often avoid driving, which limits their mobility
and quality of life, in addition to generating socioeco-
nomic impacts (Vansteenwegen et al., 2014).
Different physiological parameters are explored in
the literature to detect drivers’ stress and anxiety, such
as pupil dilation (Marquart et al., 2015), blood pres-
sure (Li et al., 2021), galvanic skin response (Lee
et al., 2023), among other physiological signals (Lin
and Li, 2023), with emphasis on heart rate (Xu et al.,
2024), which are widely studied (Haque et al., 2024).
Based on drivers’ physiological signals, some
studies focus on improving driver safety in real-time
(Braun et al., 2019), exploring automotive user inter-
faces to assist drivers and help them during practi-
cal driving activities (Li et al., 2021). These meth-
ods commonly require different hardware resources
that may demand experts or have a high cost, making
some of these solutions inaccessible to most of the
population due to their cost or technical complexity.
Many studies propose intelligent solutions to sup-
port drivers by detecting physiological signals related
to stress and anxiety. However, few have focused
544
de Oliveira, T. M., Ortoncelli, A. R., Casa, C., Casa, C. and Silva, L.
A Smartwatch-Based Approach to Support and Analysis of Driver Stress and Anxiety.
DOI: 10.5220/0013717000003985
Paper published under CC license (CC BY-NC-ND 4.0)
In Proceedings of the 21st International Conference on Web Information Systems and Technologies (WEBIST 2025), pages 544-552
ISBN: 978-989-758-772-6; ISSN: 2184-3252
Proceedings Copyright © 2025 by SCITEPRESS – Science and Technology Publications, Lda.

on developing actual tools that summarize drivers’
behavior and emotional states into reports for later
expert analysis. Solutions that provide insights into
drivers’ behavior and stress/anxiety levels are essen-
tial for experts (such as psychologists) to offer appro-
priate support (Ortoncelli et al., 2020).
This work contributes to the literature by present-
ing a solution that monitors drivers’ stress and anxiety
levels using heart rate data, measured exclusively us-
ing a smartwatch without requiring synchronization
with any other device, such as a smartphone. The
proposed solution collects data from the driver’s heart
rate and the vehicle’s GPS coordinates. Based on vari-
ations in heart rate, the application provides feedback
to assist drivers in their driving activities. It stores all
collected data in a cloud database, allowing experts to
access the reports generated later and provide special-
ized support to drivers.
We decided to develop a solution that uses a
smartwatch as the only device since there are mod-
els of watches that collect heart rate and run An-
droid applications, making it possible to develop a
simple solution that does not require synchronization
with other devices and can be used quickly and eas-
ily. In addition, smartwatches have become popular
with applications for leisure, health and research pur-
poses (Barka and Politis, 2024; Pinge et al., 2024).
In the transport sector, smartwatches facilitate cost-
effective, unintrusive and dynamic monitoring of the
driver’s state and behavior while on the road.
In this context, the main contributions of this work
are highlighted below:
• An application for smartwatches with the Android
operating system monitors and supports drivers
by collecting heart rate data and GPS coordi-
nates during driving. It stores the data in a cloud
database in real time and provides instant feed-
back to help drivers manage stress and anxiety;
• A script to produce reports that summarize the
driver’s heart rate and vehicle movement, so that
specialists (such as psychologists) can analyze the
driver’s data and provide appropriate individual-
ized care;
• The source code
1
of all implemented solutions is
publicly available, allowing researchers and de-
velopers to access, review and enhance the sys-
tem;
• The pilot case study was conducted with eleven
students from a driving school in practical classes
to obtain their National Driver’s License, follow-
ing procedures previously approved by the Ethics
1
https://github.com/motaoliveiraufpr/CFCStress
Committee for Research with Human Beings. We
selected this public because we believe that pro-
viding adequate support to the stress and anxiety
levels of driving students is essential so that they
are better prepared to deal adequately with real
traffic situations and can pass the practical driving
test in less time.
Regarding the experiments carried out, in the par-
ticipants’ opinion, the use of the application was pos-
itive. Two of the eleven participants (the two with the
highest stress level, according to the driving school
instructor) showed interest in purchasing the applica-
tion and the smartwatch to use in other driving activi-
ties, which is an indication that the proposed tool can
positively contribute to helping drivers with stress and
anxiety.
The remainder of this text is organized as follows.
Section 2 presents details of the proposed tools. Sec-
tion 3 details and analyzes the conducted case study.
Finally, Section 4 presents the final considerations
and future works.
2 PROPOSED TOOLS
The proposed approach uses an App on an An-
droid smartwatch, which collects heart rate and GPS
data from the driver during a driving activity, syn-
chronously storing this data in a cloud database. The
app also displays feedback to drivers according to
their heart rate levels 2.1. We also developed a script
that can present summarized reports of the collected
data so that experts can analyze and assist the driver
if necessary. Details about the application developed
are in Subsection 2.2. The feedback provided to the
driver according to heart rate levels is in Subsection
2.3. Subsection 2.4 describes the scripts developed
to produce reports on the collected data. Subsection
2.5 outlines the data visualisation layer and the oper-
ational features of the dashboard.
2.1 Heart Rate Levels
Five stress and anxiety levels were considered based
on the driver’s heart rate. These levels were de-
fined empirically and are used to provide feedback
to drivers. Additionally we established these levels
based on the number of beats per minute (BPM) of
the driver.
The levels of stress and anxiety used are presented
below:
• Z1: BPM lower than 116;
• Z2: BPM between 117 and 140;
A Smartwatch-Based Approach to Support and Analysis of Driver Stress and Anxiety
545
• Z3: BPM between 141 and 158 ;
• Z4: BPM between 159 and 167; and
• Z5: BPM greater than Z4.
Regarding the heart rate levels considered in this
study, it should be noted that there is no universally
accepted standard for comparing heart rate. However,
studies indicate that comparing the heart rate of ex-
perimental participants is a practical approach (Catai
et al., 2020). The heart rate ranges used can be ad-
justed in future research by comparing the BPM col-
lected in experiments.
2.2 Developed App
The application was developed for the Android Oper-
ating System, with the Samsung Health Sensor API
2
,
to ensure compatibility with Wear OS. Furthermore,
we used Kotlin
3
and Java
4
programming languages.
In addition, for real-time data storage and synchro-
nization, we chose the Firebase database.
Moreover, the MediaPlayer API of the Android
multimedia framework was used to play the audio
files which are in OGG format. To generate the au-
dio files, we used the Vidnoz online tool
5
, that pro-
vides different voice patterns – we chose the pattern
entitled Elza, a friendly and articulate young female
voice in Portuguese.
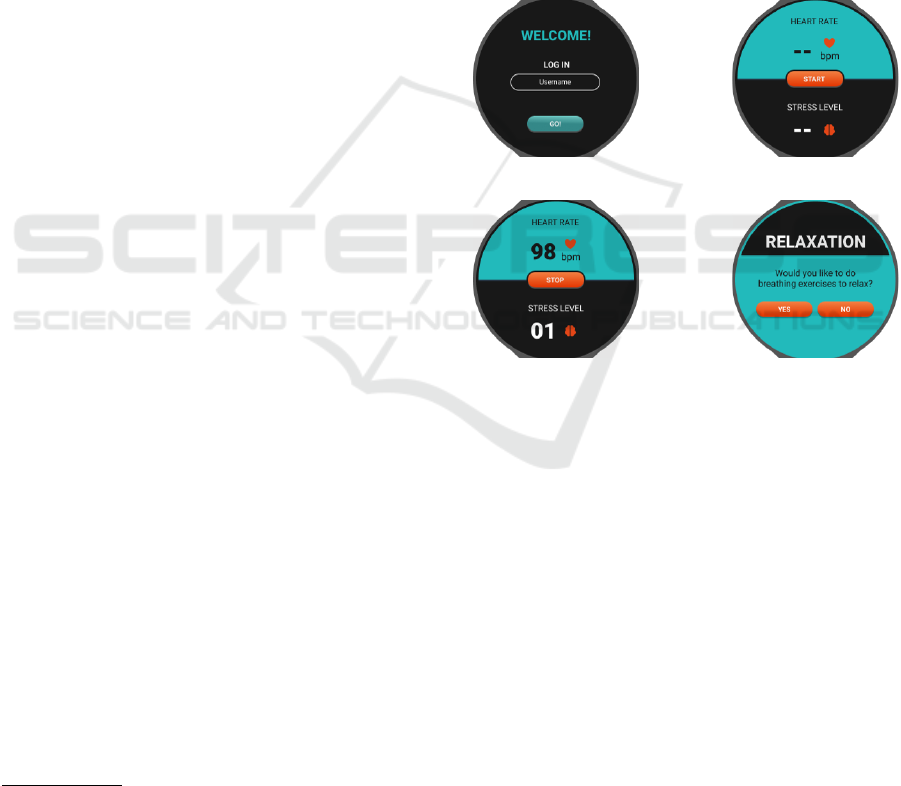
The following steps are followed for the app use:
1. The user needs to create an account in the app pro-
viding their name and login (Figure 1a).
2. The user must log in to the app (with their user-
name and password) by clicking the Start button
(Figure 1b).
3. If the user is logged into the app, it performs the
following activities:
• The app plays the audio: “Welcome, my name
is Juliana, I’m your virtual assistant” (this
audio is played in Portuguese). The presence of
a name aims to humanize the interaction, mak-
ing the experience more friendly and intimate;
• In intervals of three seconds, the app monitors
the heart rate and GPS coordinates, saving this
data asynchronously in the cloud database;
• The app displays the heart rate, as well as stress
and anxiety levels (Z1 to Z5) on the smartwatch
display (Figure 1c);
2
https://developer.samsung.com/health
3
https://kotlinlang.org/
4
https://www.oracle.com/br/java/
5
https://pt.vidnoz.com/text-to-speech.html
• Every 6 minutes, the app plays an audio record-
ing of the driver’s heart rate zone (Z1 to Z5).
The feedback texts/audios are in Subsection
2.3;
• If the user is at levels Z4 or Z5, a pop-up is also
displayed on the screen (Figure 1d); if the user
stops the car and presses yes, the unlatching au-
dio is played (described in Subsection 2.3);
• New feedback is presented to the driver every
six minutes, according to their stress level from
Z1 to Z5.
4. When the driving activity ends, the user must
press the stop button so that the app registers the
end of the activity, stopping data collection and
saving it in the database.
a - Login screen b - BPM measuring
c - Real-time heart rate d - Relaxation prompt
Figure 1: App Screens.
2.3 Feedback
The feedback explored is presented in this Subsection.
In this paper, the texts are in English, but as the exper-
iments were carried out with Brazilians, the app was
implemented with the texts in Portuguese (the audios
in Portuguese are in the project’s GitHub repository).
For the lower stress and anxiety zones (Z1 and
Z2), positive and motivational messages were used,
encouraging the user to maintain their state, empha-
sizing pleasure and the experience at the moment.
For the intermediate zone (Z3), the message alerts the
user about the state change and offers a practical so-
lution (deep breathing) to help control anxiety. For
the higher zones (Z4 and Z5), the message provides
instructions on breathing deeply to help the user re-
lax physically and mentally. The use of counting dur-
ing deep breathing helps to reinforce the practice and
maintain focus on the process. It is worth noting that
WEBIST 2025 - 21st International Conference on Web Information Systems and Technologies
546
breathing techniques in times of stress and anxiety are
commonly mentioned in the literature (Leyro et al.,
2021)
The texts used in the feedback audios are pre-
sented below:
• Feedback for Z1 level: “You are relaxed. Very
good! Great job.”
• Feedback for Z2 level: “You’re cool, that’s great!
Enjoy the ride and enjoy the moment.”
• Feedback for Z3 level: “You are entering a state
of anxiety. How about relaxing with deep breath-
ing? You can continue driving, but at this mo-
ment, take some deeper breaths; it will help you.”
• Feedback for Z4 level: “You’re in a state of
heightened anxiety. How about taking a break?
Stop the vehicle and let me know when you’re in
a safe place.”
• Feedback for Z5 level: “You are in a state of very
high anxiety. I advise you to stop the car as soon
as possible to begin the relaxation. You must stop
the vehicle and let me know when you are in a
safe place to start the relaxation.”
If the user is in the highest levels of stress/anxiety
(Z4 or Z5), when he/she presses yes on the app (with
the car stopped), he/she will receive the following
feedback: “Now we are going to start the relaxation
process, get into a comfortable position. You will in-
hale, fill your lungs and exhale, releasing all the air
very deeply and slowly for five seconds. Let’s go.
One, two, three, four, five. Exhale one, two, three,
four and five. Excellent job; you can repeat this relax-
ation for 2 minutes or 5 times. With this, we ventilate,
strengthen the brain and have a more productive train-
ing session.”
2.4 Report
To generate a mapped report of the heart rate data
collected during each practical driving activity, we
created a Python code using GeoPandas
6
and the
Folium
7
libraries to visualize geospatial data interac-
tively using Google Maps features.
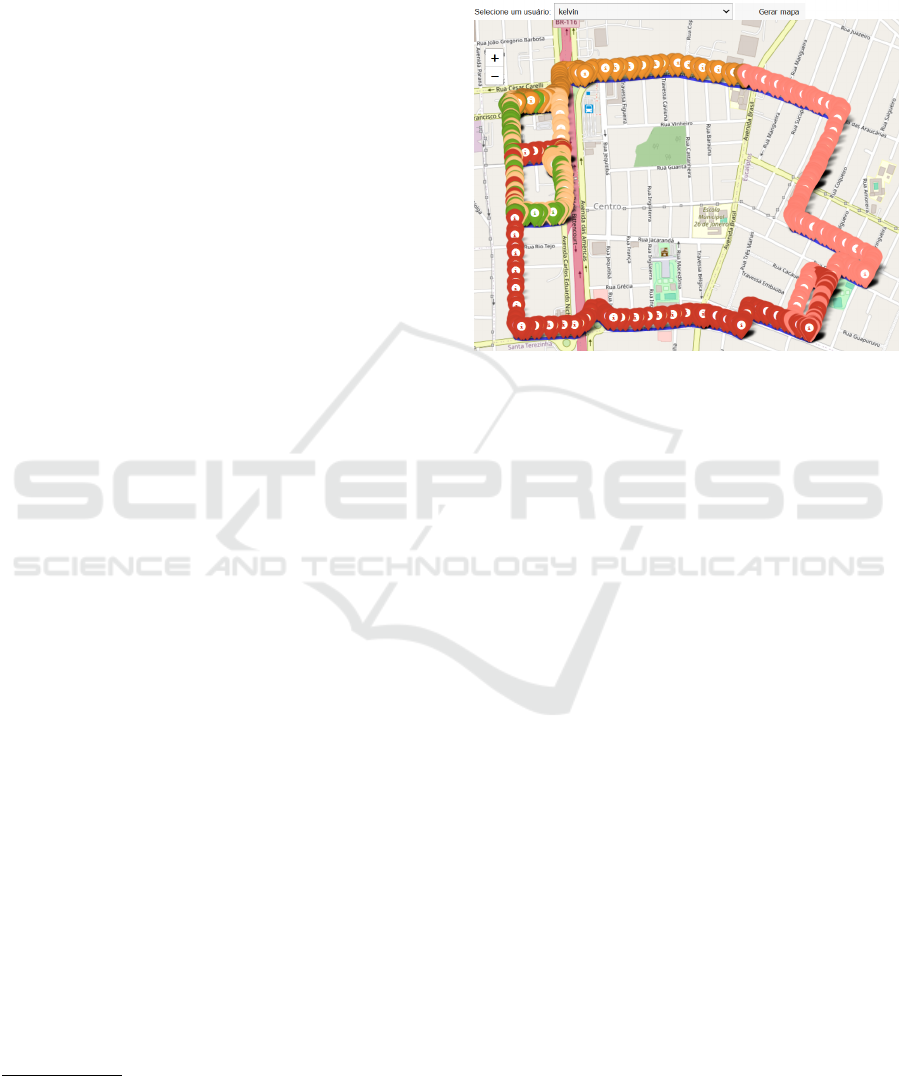
Our tool connects to the cloud database, allowing
us to obtain the data recorded by each driver during a
driving activity. The entire route is drawn on the map
based on the stored GPS coordinates, using markers
with different colors for the moment the user is in
each stress zone. The following markers colors were
used: level Z
1
in green, level Z
2
in beige, level Z
3
in
orange, level Z
4
in pink and level Z
5
in red.
6
https://geopandas.org/
7
https://python-visualization.github.io/folium/
Figure 2 shows an example of a report produced
for a driver who passed through all the defined stress
zones during a driving activity. In this report, the user
can interact with the map by moving it and zooming
in and out.
Figure 2: Reports produced.
It is important to note that these reports are im-
portant for specialists to analyze the driver’s stress
and anxiety levels in driving conditions, providing
them with adequate support. The reports can be is-
sued while the user is driving, and accessed by a pro-
fessional in any other location with internet access.
If necessary, this professional can interact with the
driver immediately after the driver has finished driv-
ing or even during the driving activity (in extreme
cases).
2.5 Data Processing and Visualization
In addition to processing heart rate and geolocation
data, the system incorporates a more robust visualiza-
tion module that generates interactive reports to illus-
trate the emotional intensity experienced during each
driving session. These reports function as both ped-
agogical and psychological tools, supporting instruc-
tors and learners in identifying and reflecting on emo-
tionally significant moments throughout the learning
process.
The visualization tool uses geospatial plotting
with color-coded stress indicators based on heart rate
variability. Developed with responsive web technolo-
gies, it enables real-time and post-session access via
desktop and mobile devices, promoting intuitive and
user-centered interaction.
By combining wearable data with accessible inter-
faces, the system supports emotional self-regulation
and learning in dynamic driving scenarios.
A Smartwatch-Based Approach to Support and Analysis of Driver Stress and Anxiety
547
This two-layer (desktop + mobile) architecture
enables the full cycle of monitoring → interpreta-
tion → intervention (Marceglia et al., 2015). Desk-
top dashboards address the longitudinal and multi-
user supervision needs of the professionals, whereas
the mobile app priorities real-time feedback and self-
regulation—an allocation pattern recommended in
multi-device human-computer interaction literature
(Grubert et al., 2016). The approach leverages find-
ings that wearable biofeedback lowers acute driving
stress (Iqbal et al., 2022; Liu et al., 2023) and aligns
with recent systematic reviews on stress-aware inter-
action design (Perez and Ruiz, 2024).
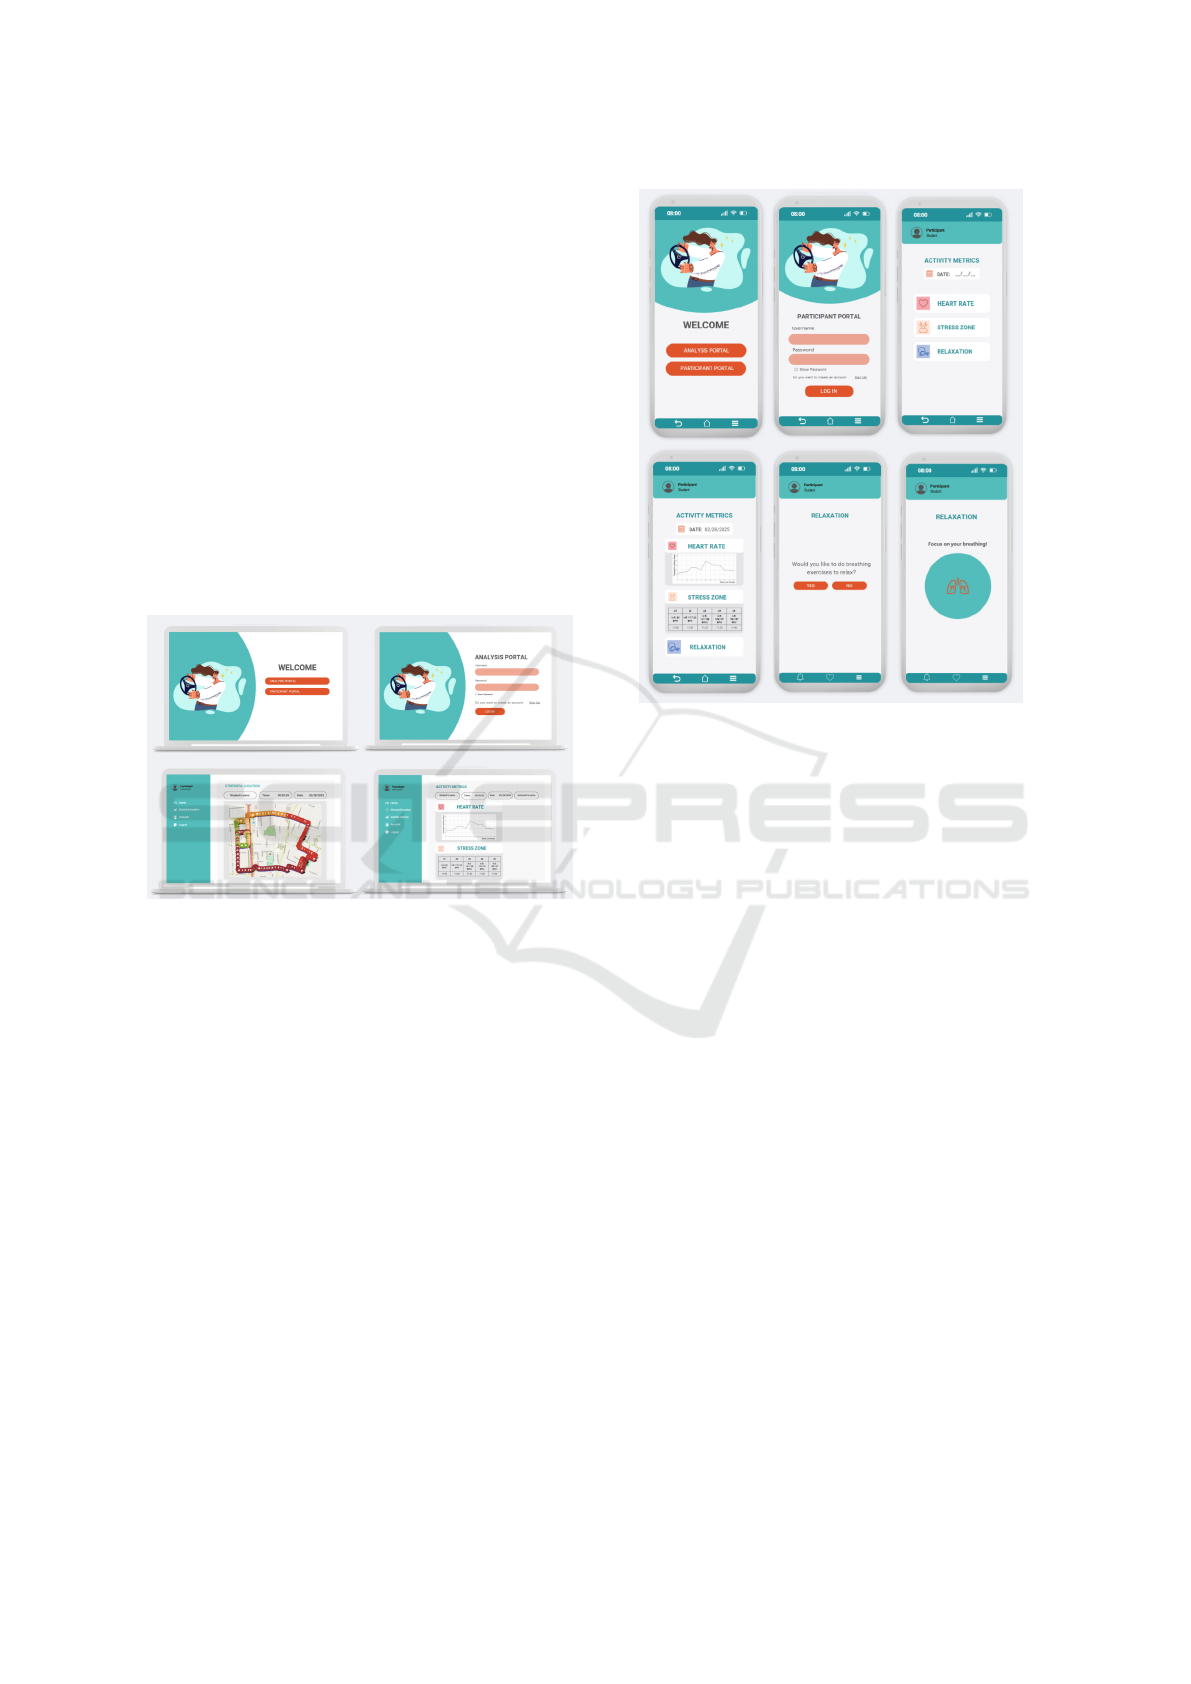
The desktop interface (Figure 3), shown below,
was designed to allow specialists to monitor student
performance through real-time reporting and post-
session review of physiological and location-based
metrics.
Figure 3: Desktop visualization.
The mobile version (Figure 4) further extends ac-
cessibility and interactivity with the feedback in a
simplified and responsive environment, even during
the driving session itself.
3 CASE STUDY
To validate the proposed tools, we conducted a case
study using the hardware described in Subsection 3.1,
which was applied in a pilot case study with eleven
student drivers from a Driver Training Center (DTC),
as described in Subsection 3.2. Supplementary mate-
rial in Subsection 3.3 was provided in advance to fa-
miliarise participants with the underlying techniques
and their intended applications. To evaluate the expe-
rience using the proposed solution, we applied ques-
tionnaires to the students (drivers), DTC employees
and a psychologist specializing in drivers who fear
driving. The experiment’s results are in Subsection
3.4.
Figure 4: Mobile visualization.
We chose to run the experiments in partnership
with a DTC, because the audience of participants
in the experiment includes novice drivers (student
drivers), who may have high levels of stress and anxi-
ety due to their inexperience. Contributing to improv-
ing the training of these drivers can result in better
drivers who pass the final exam to obtain their licenses
more quickly. Apart from that, the Ethics Commit-
tee for Research with Humans previously approved
all procedures performed.
3.1 Hardware Configuration
We used a Samsung Galaxy Watch 6 smartwatch,
which was released in 2023, featuring the Wear OS
4 operating system with the One UI Watch 5 interface
while offering an integrated experience with Android
devices. This smartwatch has 2 GB of RAM, 16 GB
of storage and a 5-nanometer Exynos W930 proces-
sor. Figure 5 shows a photo of this smartwatch used
to run our application.
It is worth highlighting two possibilities for con-
necting to the internet with the smartwatch used: i)
via Bluetooth/Wi-Fi, being able to obtain the internet
routed from a nearby smartphone, and ii) its LTE ver-
sion, which allows direct connection to the internet
using an eSIM (Embedded SIM) without the need of
a smartphone, which was the option used in the ex-
periments.
WEBIST 2025 - 21st International Conference on Web Information Systems and Technologies
548

Figure 5: Smartwatch running the proposed app.
3.2 Case Study Steps
To perform the experiments, we executed the follow-
ing steps:
1. All students enrolled in the DTC who were taking
practical driving lessons were invited to partici-
pate in the experiment.
2. We presented all methodological procedures to
students interested in participating in the experi-
ment, explaining that they could withdraw from
participating at any time.
3. We consulted the DTC instructors to identify
which students, among those who expressed inter-
est in participating in the experiment, were most
likely to exhibit signs of stress and anxiety. Based
on their experiences in previous classes, the in-
structors identified eleven students.
4. Each selected student had to complete a free
and informed consent form, as established by the
ethics committee.
5. Participants were registered in the App.
6. Participants put the watch on their wrists, logged
into the app and started the driving lessons.
7. Participants completed their class with the watch
on their wrists, accompanied by a DTC instructor
in the DTC vehicle. Each class lasted an average
of 40 minutes of driving time.
8. At the end of the class, the students and the in-
structor answered a questionnaire with quantita-
tive questions about their experience with the app.
9. A psychologist specializing in helping drivers
with fear of driving accompanied the entire pro-
cess, answering a questionnaire about the exper-
iments and evaluating the reports produced with
the data collected (Subsection 2.4).
3.3 Supplementary Material
In addition to the audio guidance provided during mo-
ments of high stress (zones Z4 and Z5), the software
incorporates pre-training content based on mindful-
ness principles. Before the practical driving session
begins, the student is given access to visual mate-
rial with simple instructions on how to manage anx-
iety through techniques such as focused breathing,
observing the environment, and accepting thoughts
without judgment. This preparation aims to raise the
student’s awareness of the importance of emotional
balance even before a stressful situation occurs.
This prior resource is intended to make the real-
time feedback more effective. When the system
prompts the student to stop the vehicle and begin the
relaxation process, they are already familiar with the
strategies to be used, which increases engagement and
receptiveness to the exercise.
The preparatory content shown to the student be-
fore the driving session is based on simple and ef-
fective mindfulness strategies. Figure 6 presents the
content used as an introductory mindfulness guide to
the student before the start of the driving session. The
guidance provided includes:
• Present Moment: Be aware of the current situa-
tion.
• Observe Your Environment: Notice sounds,
smells, and physical sensations.
• Focus on Breathing: Focus on your breathing to
calm yourself.
• Acceptance Without Judgment: Accept
thoughts and emotions without criticism.
Repeat a few times to reduce symptoms of anxiety
and stress!
Figure 7 presents the diaphragmatic breathing
content, which is presented to drivers and instructors,
with the following step:
• Place one hand on your chest and the other on
your abdomen.
• Inhale deeply for 3 seconds.
• Hold your breath for 3 seconds.
• Exhale through your mouth for 6 seconds.
The user is encouraged to repeat the exercise a few
times to reduce symptoms of anxiety and stress.
3.4 Results
The eleven student drivers who participated in the pi-
lot study completed all the experiment activities and
A Smartwatch-Based Approach to Support and Analysis of Driver Stress and Anxiety
549
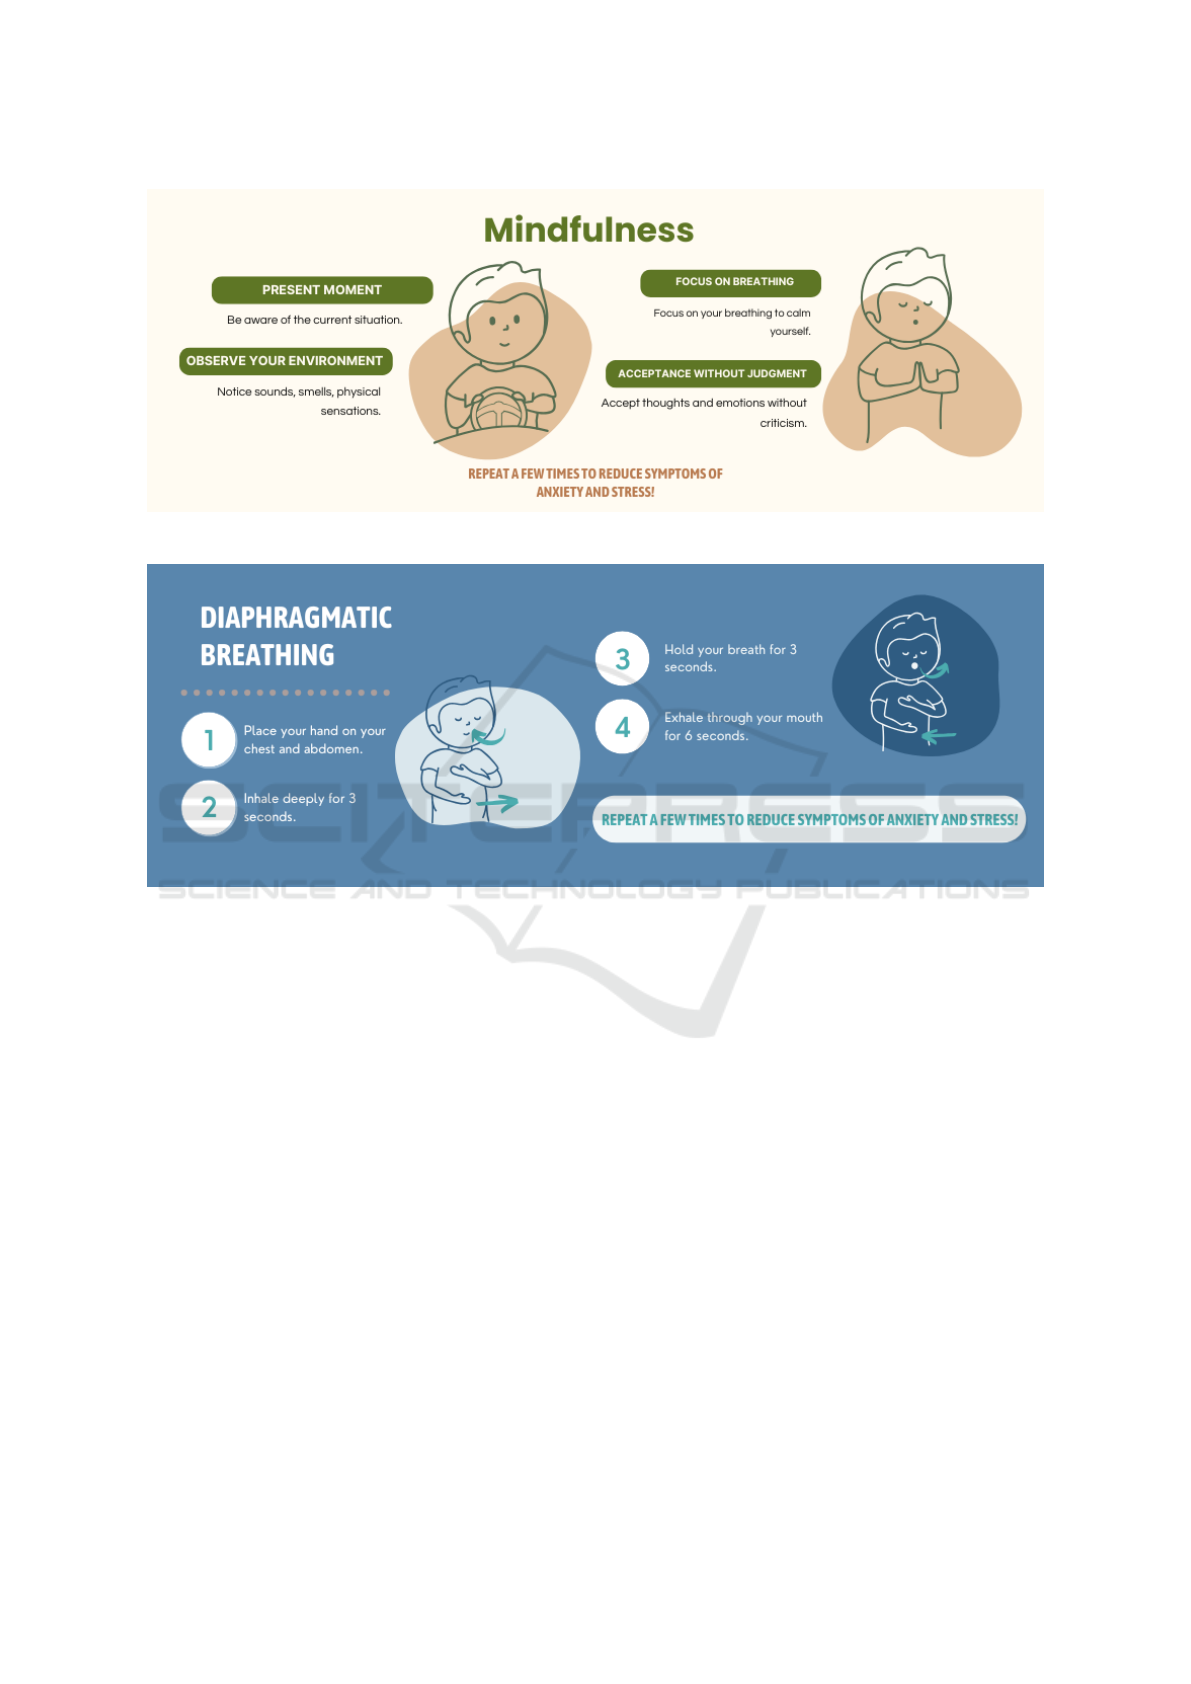
Figure 6: Introductory mindfulness guide.
Figure 7: Diaphragmatic breathing guide.
reported no problems wearing the watch. A question-
naire was administered to all participants at the end
of the driving activity. The questionnaire, alternatives
and participant responses are presented below:
1. Is the interface intuitive and easy to use?
• Yes: 11 answers (100%).
• No: 0 answers (0%).
2. Did the software help reduce your stress while
driving?
• Yes, a lot: 7 answers (63.6%).
• Yes, a little: 2 answers (18.2%).
• It made no difference: 2 answers (18.2%).
• No, it increased stress: 0 answer (0%).
3. Was the sound alert helpful in reminding you
to manage your stress?
• Yes, it was very helpful: 8 answers (72.7%).
• Yes, but it could be adjusted: 1 answer (9.1%).
• It made no difference: 2 answers (18.2%).
• I found it irritating: 0 answer (0%).
4. Was alerts frequency appropriate for you?
• Yes: 9 answers (81.8%).
• It is necessary to reduce the frequency of alerts;
they were very frequent: 1 answer (9.1%).
• It is necessary to increase the frequency of
alerts, there should be more: 1 answer (9.1%).
• I didn’t notice the warnings: 0 answer (0%).
5. Did the software help you better understand
your stress levels while driving?
• Yes, completely: 8 answers (72.7%).
• Yes, partially: 0 answer (0%).
• It made no difference: 3 answers (27.3%).
6. Did you experience any discomfort with the
software? If so, what was it?
• No, I didn’t feel any discomfort: 9 answers
(81.7%).
• The sound of the alerts was unpleasant: 1 an-
swer (9.1%).
• The alerts were very frequent: 1 answer (9.1%).
WEBIST 2025 - 21st International Conference on Web Information Systems and Technologies
550

7. Would you use this software regularly in your
driving lessons?
• Yes: 9 answers (81.7%).
• No: 1 answer (9.1%).
• Maybe: 1 answer (9.1%).
Survey results indicate that the app has an intuitive
and easy-to-use interface, with 100% approval rat-
ings. Most participants noted a significant reduction
in stress while driving and found the audible alerts
useful, although a small percentage suggested adjust-
ments. Overall acceptance was high, with 81.7% say-
ing they would use the software regularly, despite
minor complaints about the sound and frequency of
alerts.
In addition to the questionnaire, qualitative feed-
back was collected after each practical driving ses-
sion monitored by the app developer, involving stu-
dent drivers, DTC instructors, and the psychologist
overseeing the experiment. According to the opin-
ion of the six instructors who monitored the practical
driving activities, with the use of the app, a slight in-
crease in the students’ confidence could be observed,
presenting a positive impact on the learning experi-
ence of the students who did not experience any dis-
comfort with the use of the app. The instructors also
provided suggestions regarding the feedback feature,
noting that its text could be improved and that it was
triggered too frequently within a short period.
The specialist psychologist highlighted the im-
pacts of the software on students’ confidence, indi-
cating that this is an extremely important factor since
emotional security is an essential factor for effective
learning to drive a vehicle. However, both the instruc-
tors and the psychologist point out the need to reeval-
uate the stress zones based on the data collected in the
experiments. Besides that, they also suggested testing
other patterns of sound alerts.
Regarding the students/drivers, it should be noted
that none of the students entered zones Z4 and Z5 dur-
ing the pilot case study. However, they still reported
feeling less anxiety/stress when using the application,
reporting that upon receiving feedback about their
emotional state through the software, they felt more
comfortable and demonstrated greater confidence in
driving. It is also important to mention that 2 of the 11
drivers showed interest in purchasing the watch and
the application to continue using it in other classes.
New case studies are necessary with a broader audi-
ence, but the pilot study results highlight the impor-
tance of the proposed solution.
4 CONCLUSION
This study introduced a smartwatch-based solution
for monitoring and analyzing driver stress and anxi-
ety levels using heart rate data without requiring ad-
ditional synchronized devices. The proposed system
enables real-time data collection and feedback, assist-
ing drivers in managing their emotional states while
driving. The collected data is also stored in a cloud
database, allowing experts, such as psychologists, to
analyze reports and provide personalized support.
The pilot study was conducted with driving school
students, demonstrating the system’s feasibility and
potential to improve driver well-being. The positive
reception of the application among participants, in-
cluding two individuals who expressed interest in us-
ing it beyond the study, suggests that the tool can
contribute to safer and more confident driving expe-
riences, particularly for novice drivers.
Enabling data analysis about the driver with re-
ports is also one of the contributions of this work. In
particular, the maps produced can be a valuable tool
for specialized psychologists. Still, it is worth noting
that new functionalities should be implemented in fu-
ture work to improve the software that produces these
reports, allowing the analysis of drivers’ performance
on different days/moments.
Despite these promising outcomes, some limita-
tions must be addressed in future work. The current
study involved a small sample size, and further re-
search with a more extensive and diverse group of
participants is necessary. The tool can be interactively
adjusted based on the feedback received by experi-
menting with a larger group of drivers. It is worth not-
ing that it is crucial to conduct experiments not only
with student drivers but also with experienced drivers
who report high levels of stress and anxiety.
In future work, in addition to adjusting the func-
tionalities of the proposed tools, it is possible to ex-
plore other low-cost wearable devices that collect
other physiological signals, such as galvanic skin re-
sponse and respiration rate, to improve accuracy. Fu-
ture developments could also explore machine learn-
ing techniques to enhance the detection and classifi-
cation of emotional states in real-time, aiming to pre-
dict the moments in which drivers will enter high-
stress and anxiety zones, and providing feedback in
advance.
ACKNOWLEDGMENTS
We would like to thank the Coordination for the Im-
provement of Higher Education Personnel (CAPES) -
A Smartwatch-Based Approach to Support and Analysis of Driver Stress and Anxiety
551

Program of Academic Excellence (PROEX) for the
financial support provided through the scholarship
grant. We are also grateful to the Driver Training Cen-
ter Auto Escola Mil
ˆ
enio, where the experiments were
conducted, and to psychologist Juliana Daga for her
continuous support and involvement throughout the
development and implementation of the project.
REFERENCES
Alhaek, F., Liang, W., Rajeh, T. M., Javed, M. H., and Li,
T. (2024). Learning spatial patterns and temporal de-
pendencies for traffic accident severity prediction: A
deep learning approach. Knowledge-Based Systems,
286:111406.
Barka, R. E. and Politis, I. (2024). Driving into the future: A
scoping review of smartwatch use for real-time driver
monitoring. Transportation research interdisciplinary
perspectives, 25:101098.
Braun, M., Schubert, J., Pfleging, B., and Alt, F. (2019).
Improving driver emotions with affective strategies.
Multimodal Technologies and Interaction, 3(1):21.
Catai, A. M., Pastre, C. M., de Godoy, M. F., da Silva, E.,
de Medeiros Takahashi, A. C., and Vanderlei, L. C. M.
(2020). Heart rate variability: are you using it prop-
erly? standardisation checklist of procedures. Brazil-
ian journal of physical therapy, 24(2):91–102.
Craske, M. G., Kircanski, K., and Vervliet, B. (2009). Fear
of driving: Epidemiology, diagnosis, and treatment.
Oxford University Press.
Grubert, J., Kranz, M., and Quigley, A. (2016). Challenges
in mobile multi-device ecosystems. mUX—The Jour-
nal of Mobile User Experience, 5(1):1–17.
Haque, Y., Zawad, R. S., Rony, C. S. A., Al Banna, H.,
Ghosh, T., Kaiser, M. S., and Mahmud, M. (2024).
State-of-the-art of stress prediction from heart rate
variability using artificial intelligence. Cognitive
Computation, 16(2):455–481.
Iqbal, T., Simpkin, A. J., Roshan, D., Glynn, N., et al.
(2022). Stress monitoring using wearable sensors:
A pilot study and Stress-Predict dataset. Sensors,
22(21):8135.
Lee, M., Lee, S., Hwang, S., Lim, S., and Yang, J. H.
(2023). Effect of emotion on galvanic skin response
and vehicle control data during simulated driving.
Transportation research part F: traffic psychology and
behaviour, 93:90–105.
Leyro, T. M., Versella, M. V., Yang, M.-J., Brinkman,
H. R., Hoyt, D. L., and Lehrer, P. (2021). Respiratory
therapy for the treatment of anxiety: Meta-analytic
review and regression. Clinical psychology review,
84:101980.
Li, W., Zhang, B., Wang, P., Sun, C., Zeng, G., Tang,
Q., Guo, G., and Cao, D. (2021). Visual-attribute-
based emotion regulation of angry driving behaviors.
IEEE Intelligent Transportation Systems Magazine,
14(3):10–28.
Lin, W. and Li, C. (2023). Review of studies on emotion
recognition and judgment based on physiological sig-
nals. Applied Sciences, 13(4):2573.
Liu, K., Jiao, Y., Du, C., et al. (2023). Driver stress detec-
tion using ultra-short-term HRV analysis under real-
world driving conditions. Entropy, 25(2):194.
Marceglia, S., Fontelo, P., Rossi, E., and Ackerman,
M. J. (2015). A standards-based architecture pro-
posal for integrating patient mhealth apps to electronic
health record systems. Applied Clinical Informatics,
6(3):488–505.
Marquart, G., Cabrall, C., and De Winter, J. (2015). Review
of eye-related measures of drivers’ mental workload.
Procedia Manufacturing, 3:2854–2861.
Minist
´
erio dos Transportes (2023). Painel es-
tat
´
ıstico de acidentes de tr
ˆ
ansito. https:
//www.gov.br/transportes/pt-br/assuntos/transito/
arquivos-senatran/docs/renaest. Acessado em
11/11/2023.
Ortoncelli, A. R., Silva, L., Bellon, O. R. P., de Oliveira,
T. M., and Daga, J. (2020). Summarizing driving be-
havior to support driver stress analysis. In 2020 15th
IEEE International Conference on Automatic Face
and Gesture Recognition (FG 2020), pages 587–591.
IEEE.
Perez, M. d. l. C. and Ruiz, J. A. (2024). Detection and
monitoring of stress using wearables: A systematic
review. Frontiers in Computer Science, 6:1478851.
Pinge, A., Gad, V., Jaisighani, D., Ghosh, S., and Sen,
S. (2024). Detection and monitoring of stress using
wearables: a systematic review. Frontiers in Com-
puter Science, 6:1478851.
Stephens, A., Collette, B., Hidalgo-Munoz, A., Fort, A.,
Evennou, M., and Jallais, C. (2024). Help-seeking for
driving anxiety: who seeks help and how beneficial is
this perceived to be? Transportation research part F:
traffic psychology and behaviour, 105:182–195.
Vansteenwegen, A., Verhaeghe, S., Clercq, C., and Kir-
canski, K. (2014). The impact of driving anxiety on
mobility, quality of life and socio-economic participa-
tion: A systematic review. Clinical Psychology Re-
view, 34(8):673–688.
WHO (2023). Global status report on road safety
2023. http://www.abeetrans.com.br/abeetrans/?p=
4213. Acessado em 20/11/2023.
Xu, G., Qin, R., Zheng, Z., and Shi, Y. (2024).
An adaptive system for wearable devices to detect
stress using physiological signals. arXiv preprint
arXiv:2407.15252.
Zhao, Q., Yang, L., and Lyu, N. (2024). A driver stress
detection model via data augmentation based on deep
convolutional recurrent neural network. Expert Sys-
tems with Applications, 238:122056.
WEBIST 2025 - 21st International Conference on Web Information Systems and Technologies
552
