
Assessing and Visualizing Principles of Play in Soccer
R
´
uben Filipe Rocha
1 a
and Rui J. Lopes
1,2 b
1
ISCTE-Instituto Universit
´
ario de Lisboa, Lisbon, Portugal
2
Instituto de Telecomunicac¸
˜
oes, Lisbon, Portugal
Keywords:
Performance Analysis, Visualisation Tool, Soccer, Principles of Play, StatsBomb Data.
Abstract:
Recent advances in soccer analytics have significantly expanded the use of spatial and temporal data to un-
derstand tactical behaviour. However, many visualisation tools remain limited in their ability to contextualize
these behaviours according to established principles of play. This paper presents a context-aware visualisation
framework that leverages StatsBomb Open Data to identify, illustrate, and interpret tactical patterns in pro-
fessional soccer. The tool enables analysts to explore match phases through key tactical dimensions such as
compactness, pressing, width, support, and penetration, using event-level data enriched with positional data
(360 freeze frames). Unlike generic dashboards or statistical summaries, the proposed system integrates spa-
tial relationships and collective movements, offering a more accurate representation of team behaviour across
different match contexts. By combining visual methods with tactical theory, the tool supports coaches and an-
alysts in identifying the match principles of play, thereby facilitating a deeper understanding of performance
dynamics.
1 INTRODUCTION
In today’s soccer, vast amounts of data are collected
during matches, including player tracking data and
event records, like passes, dribbles and shots. How-
ever, raw data must be transformed into actionable
insights that accurately reflect the match context and
can be interpreted by the coaching staff to inform their
tactical decisions (Liu, 2022).
Data visualisation techniques convert complex nu-
merical and spatial data into visual representations
that highlight features or patterns relevant to tactical
analysis. These methods assist analysts and coaches
in identifying recurring behaviours, comparing player
performance in specific contexts, and improving com-
munication within the technical team (Perin et al.,
2018; Liu, 2022). For example, visual tools can il-
lustrate how a team constructs attacking sequences,
the zones where players exert spatial dominance, or
the structural variations in formation across differ-
ent match phases (Krishnamurthy and Nanda, 2021;
Bauer et al., 2023).
Over time, visualisation approaches have pro-
gressed from static or aggregated outputs like
heatmaps and radar charts to more advanced, inter-
a
https://orcid.org/0009-0001-0129-5977
b
https://orcid.org/0000-0002-8943-0415
active systems. These include animated movement
trajectories, dynamic passing networks, and forma-
tion models that evolve throughout the match (Sacha
et al., 2017; Krishnamurthy and Nanda, 2021; Janet-
zko et al., 2014).
The core function of these tools is to extract and
interpret features and tactical structures from the flow
of the match. This includes recognizing repeated
movement patterns, coordinated passing sequences,
and adaptive behaviours (for example, responses to
changes in possession status). Some systems can
even detect which structural breakdowns contributed
to match outcomes by contrasting successful and un-
successful performance profiles (Krishnamurthy and
Nanda, 2021).
Nonetheless, several challenges remain. Notably,
there is no standardization in how visualisations rep-
resent time and space, which are fundamental to un-
derstanding the dynamics of soccer (Sotudeh, 2025;
Bauer et al., 2023). Consequently, many tools fail to
incorporate core tactical concepts such as the princi-
ples of play, offering visual summaries that lack the
contextual depth required for high-level analysis.
In this context, this paper examines existing visu-
alisation systems and evaluates how effectively they
support the identification and interpretation of tacti-
cal patterns within professional soccer matches. Fur-
90
Rocha, R. F. and Lopes, R. J.
Assessing and Visualizing Principles of Play in Soccer.
DOI: 10.5220/0013716200003988
Paper published under CC license (CC BY-NC-ND 4.0)
In Proceedings of the 13th International Conference on Sport Sciences Research and Technology Support (icSPORTS 2025), pages 90-99
ISBN: 978-989-758-771-9; ISSN: 2184-3201
Proceedings Copyright © 2025 by SCITEPRESS – Science and Technology Publications, Lda.
thermore, this paper presents a solution to detect tac-
tical principles of play in soccer through the combi-
nation of event-level data and 360 freeze frames from
the StatsBomb Open Data model. The term ”princi-
ples of play” refers to a set of fundamental tactical
guidelines that govern how teams organize and be-
have collectively during a soccer match such as press-
ing, compactness, width, support, and penetration,
which emerge throughout different phases of play.
2 RELATED WORK
Over the past decade, several researchers have pro-
posed advanced methods to enhance tactical insights.
Among them are approaches relying on static or
aggregated representations such as heatmaps, radar
charts, and passing network diagrams. While effec-
tive for summarizing performance data, these visual-
isations fall short in capturing the full tactical com-
plexity of the match, particularly the spatial and tem-
poral dynamics that underpin team behaviour (Janet-
zko et al., 2014; Krishnamurthy and Nanda, 2021).
Perin et al. (2018) presented a comprehensive re-
view of sports data visualisation, classifying existing
work by its goals, target users, and data complex-
ity. They also emphasize that working closely with
coaches and analysts during the design process is es-
sential to create tools that are not only functional, but
also practical and relevant in real-world settings. In
terms of goals, the authors give examples such as
design studies with sports commentators, user need
analysis, algorithm and model development, integra-
tion into real-world environments, and new visual or
interaction techniques recommendations. With re-
gards to target users, the work distinguishes between
analysts and coaches and athletes (in practical eval-
uation tasks, usually), fans and the general public
(in turn accessed via infographics), and journalists
or data specialists. Finally, the authors define three
categories of sports data: box score data (event data
per individual match), tracking data (spatio-temporal
movement data), and meta-data (contextual data like
player profiles or stadium features).
The later classification criteria taps into the core of
our proposal, namely in the fact that the vast majority
of visualization tools fall into only one of these cat-
egories, hindering their capability to unveil features
or patterns actionable into principles of play related
tasks.
In addition to this classification, Table 1 groups
seminal studies on soccer analytics research based on
the following criteria: visualisation type and tactical
analysis level. This overview enables us to distinguish
between static and dynamic approaches, the level of
user engagement, and the tactically investigated gran-
ularity each approach focuses on (individual or team
level).
Most visualization tools use positional data. Liu
(2022) explored geo-visualisation techniques for the
analysis of player positioning data. This study uses
tools such as Python, R, and GIS platforms to visual-
ize spatial and spatio-temporal patterns, with empha-
sis on position-level tactical dynamics. Liu (2022) in-
vestigated how player tracking data can be animated
and visualised using GIS tools and web technologies
such as Python, HTML5, and Tableau. These tools
add spatial and spatio-temporal context to soccer an-
alytics, which is essential for understanding tactical
positioning. As illustrated in Figure 1, simple player
positional data can be combined with other more
complex positional features such as convex hulls and
Voronoi diagrams.
Figure 1: Interactive visualisation of player positions and
convex hull selection interface. Adapted from Liu (2022).
In other research, Sacha et al. (2017) introduced
a dynamic visual abstraction method that enables
the analysis of collective player movement patterns.
Their approach emphasizes the importance of move-
ment over time, capturing dynamic tactical structures
such as defensive lines and team pressing. Sacha et al.
(2017) also propose visual abstraction techniques that
simplify player movement patterns (see Figure 2),
making it easier for analysts to observe and interpret
tactical behaviour over time. In this application, in-
stead of a single snapshot of the positional status of
the match, the aggregated positions along a certain
time interval are presented.
Other tools present values associated usually with
player or team performance. These values can be su-
perimposed or embedded in pitch diagrams (notable
examples are pass networks and positional heat maps)
or use other visual references (notable examples are
radar charts). One example of the later is illustrated
in Figure 3 from Liu (2022) where these charts are
Assessing and Visualizing Principles of Play in Soccer
91
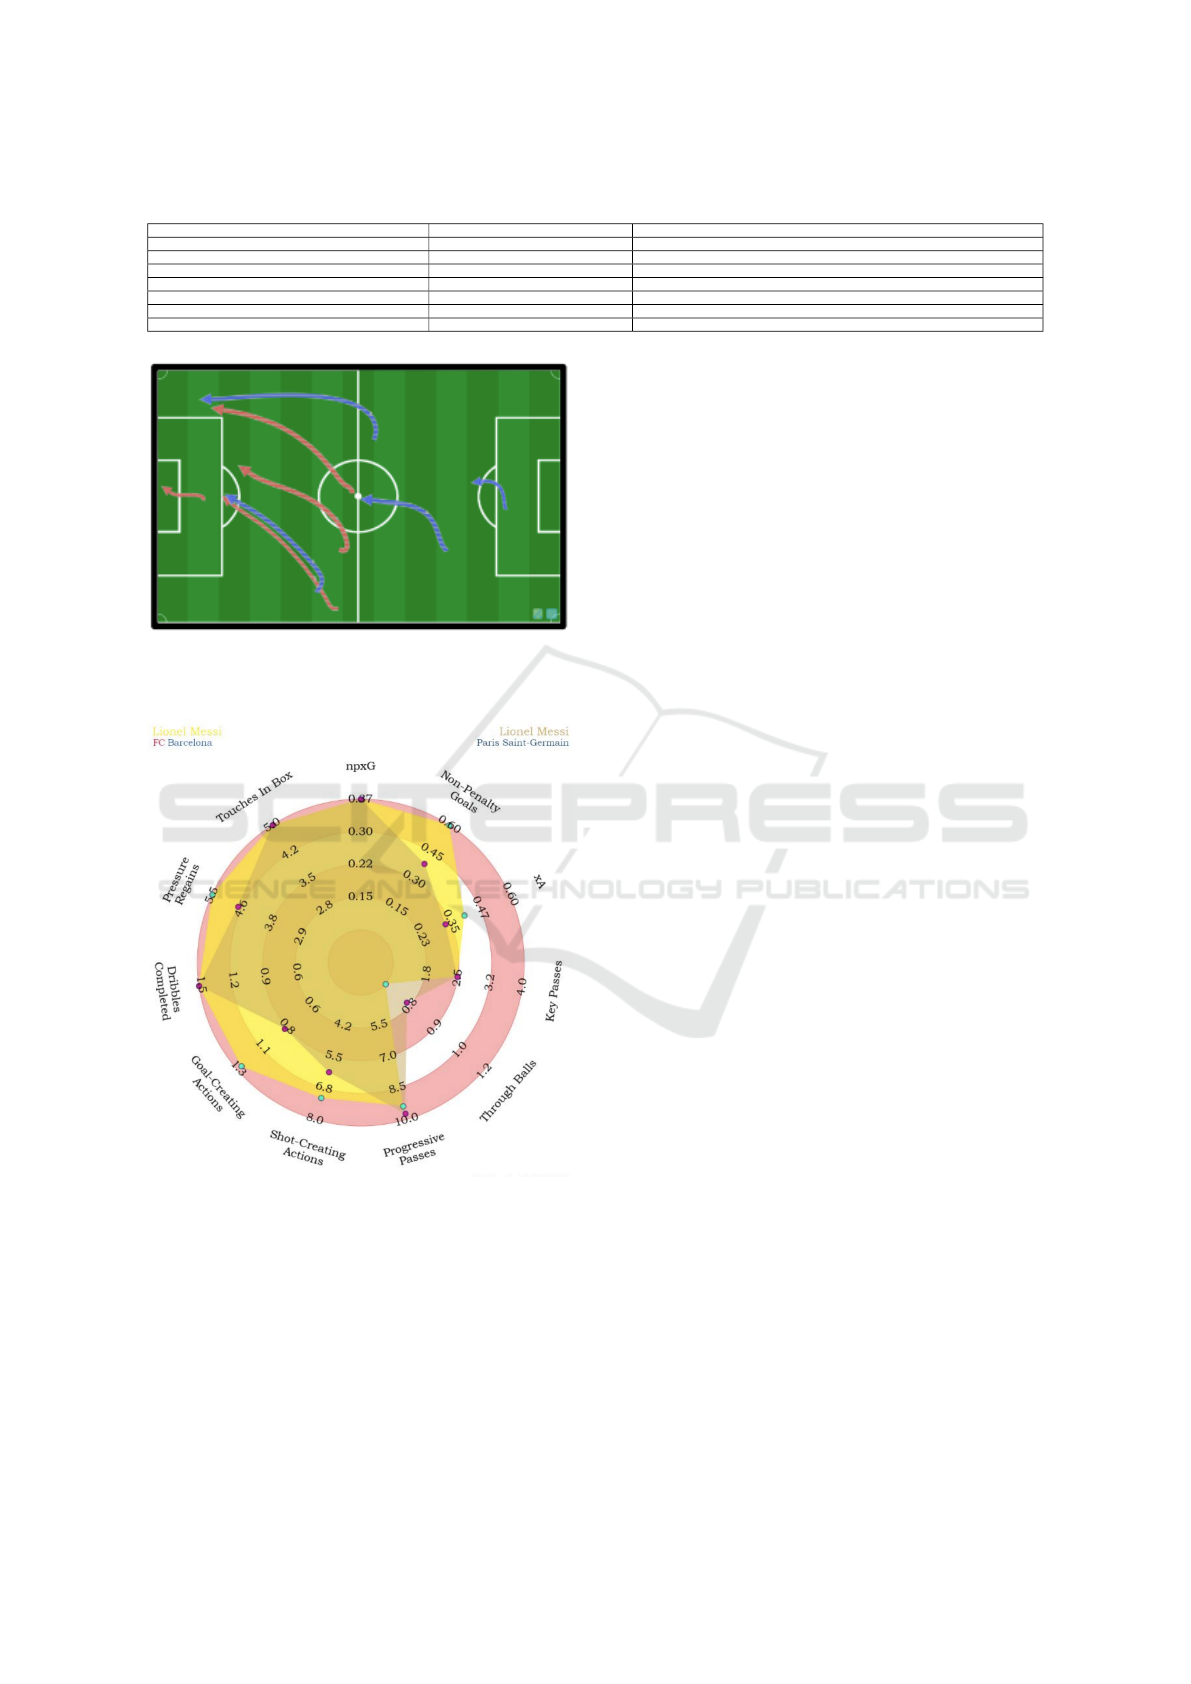
Table 1: Comparison of visualisation approaches in soccer analytics literature.
Author (Year) Visualisation Type Level of Tactical Analysis
Liu (2022) Geo-visualisation Position Level
Sacha et al. (2017) Dynamic Team Level
Janetzko et al. (2014) Static + Exploratory Team Level
Krishnamurthy and Nanda (2021) Interactive Dashboard Team Level
Bauer et al. (2023) Static Analysis Team Level
Delibas et al. (2019) Visual Analytics Tool Team Level
Sotudeh (2025) Conceptual/Survey Both
Figure 2: Visual representation of player movements
through dynamic abstraction techniques. Adapted from
Sacha et al. (2017).
Figure 3: Radar chart illustrating statistical metrics for
player performance. Adapted from Liu (2022).
used to represent different performance metrics of a
specific player.
Several other studies have adopted varied visual-
ization approaches, such as an interactive dashboards
developed to visualize performance metrics at both
player and team levels, using radar charts, heatmaps,
and passing networks to analyse individual contri-
bution and collective strategy (Krishnamurthy and
Nanda, 2021). In addition, Janetzko et al. (2014)
proposed a feature-oriented visual analytics frame-
work bringing together static and exploratory visual-
isations, combining team measures enabling the dis-
covery of patterns by using interactive filtering and
brushing capabilities. Furthermore, an interactive
exploratory analysis tool was introduced by Delibas
et al. (2019) to investigate soccer event data through
customizable parameters, supporting team-level tacti-
cal assessments by linking event-based data with vi-
sual analytics features. Taken together, these con-
tributions demonstrate that different forms of visu-
alisation, from dashboards to exploratory analysis
frameworks, play an important role in helping ana-
lysts identify relevant patterns, understanding collec-
tive behaviour, and supporting decision-making pro-
cesses in football analytics.
In recent years, more dynamic and interactive vi-
sualisation systems have emerged. One notable ex-
ample is SoccerMetrics, an open-source framework
that identifies key players, analyses strategies against
different opponents, and highlights tactical changes
associated with unsuccessful match outcomes (Krish-
namurthy and Nanda, 2021).
One important area in development is recognis-
ing how formations evolve across different phases of
the match. Sotudeh (2025) presented a comprehen-
sive review on tactical formation identification. Their
analysis goes from position-level and team-level per-
spectives, discussing data preprocessing, clustering,
and template-based methods, while also highlighting
methodological limitations and future directions.
Studies focused on tactical formations have also
gained attention in recent years. Bauer et al. (2023)
utilized static visual analysis to contextualize team
formations, providing a conceptual framework to un-
derstand the variability of tactical structures under
different match conditions. In addition, they em-
ployed a combination of convolutional neural net-
works and tracking data to segment matches into
phases and detect formation changes beyond static la-
bels like “4-4-2”. Similarly, Sotudeh (2025) reviewed
principles for identifying formations and argued that
many current methods oversimplify them by relying
on spatial averages and clustering, often ignoring the
temporal context of the match and the emergence of
dynamic behaviours. Together, these studies empha-
icSPORTS 2025 - 13th International Conference on Sport Sciences Research and Technology Support
92

sise the importance of moving beyond static represen-
tations to approaches that capture the fluid and dy-
namic nature of formations throughout a match.
Even with recent progress, many tools still rely
heavily on aggregated data or static views, falling
short in representing the fluid and complex dynamics
of team play (Sotudeh, 2025; Bauer et al., 2023). Tra-
ditional heatmaps and static pass maps are often in-
sufficient to represent interaction between players or
the effect of context like match state or opponent strat-
egy (Janetzko et al., 2014). Moreover, several tools
rely heavily on event data, which lacks full spatial
context, and under-use the rich potential of tracking
data when not combined with tactical insights (Perin
et al., 2018).
Other options are commercial platforms, such as
Stats Edge Analysis, that provide analysts with the ca-
pability to examine tactical behaviour through inter-
active visual interfaces. These systems also provide
synchronized positional and event information access,
allowing one to filter periods of play (e.g., attack, de-
fence, transition), select specific match situations, and
project team arrangements onto a tactical board. One
key component of this technology is the ability to au-
tomatically measure spatial statistics—such as team
length, width, and compactness—that are directly ap-
plied to pitch maps for simpler interpretation.
In Stats Edge Analysis, for instance, people can
distinguish average positioning of a player across se-
lected sequences of matches and assess coordinated
collective behaviours like coordination of pressing,
line compactness, and block height. The system also
supports custom queries by ball position and player
role and offers dynamic frame-by-frame playback to
put tactical trends in context. This spatial-temporal
data-driven technology enables pre-match and post-
match analysis, opponent team scouting, and detec-
tion of structural weaknesses or strengths.
Although existing visualisation tools offer useful
summaries of performance data, they often fail to cap-
ture the underlying tactical complexity of soccer. Tac-
tical principles are defined as spatial and temporal
patterns that recur across matches. They help de-
termine how teams act throughout different phases
of the match. However, current tools rarely account
for these principles, limiting their ability to support
training design, match analysis, and tactical decision-
making (Table 2). Consequently, there is a need for
visualisation systems explicitly guided by principles
of play, which can more effectively inform coaches
and analysts.
3 StatsBomb DATA
StatsBomb Open Data is one of the most widely
used open datasets in soccer analytics research. It
provides detailed match-level data in JSON format,
freely accessible for academic and non-commercial
use. The data covers various professional competi-
tions and includes structured information about com-
petitions, matches, player line-ups, match events, and
spatial context via 360 freeze frames. Each data type
is organized in separate files, allowing modular and
layered analysis of soccer performance.
3.1 Competitions and Matches
The competitions.json file lists all available com-
petitions and seasons, including metadata such as
country, sex, and competition IDs (StatsBomb,
2019a). Each competition is associated with one or
more seasons, and matches are grouped under these
seasons using the matches.json files (StatsBomb,
2019d). Each match entry contains information such
as team names, match date, score, stadium, referee,
and a unique match id used to access further data
files.
3.2 Line-Ups
The lineups.json files describe the starting eleven
and substitutes for each team in a given match. For
each player, the dataset includes their ID, full name,
nickname, jersey number, and nationality (Stats-
Bomb, 2019c). This data is crucial for linking actions
and roles to specific individuals during the analysis.
3.3 Events
The event data is the analytical core of the dataset.
Stored in events.json files, it includes all the on-
the-ball actions performed during a match. Each
event is timestamped and linked to a player, team,
and spatial location on the pitch (StatsBomb, 2019b).
The event types cover actions such as passes, drib-
bles, shots, fouls, interceptions, pressures, and
more. Additional context is provided through tags
like under_pressure, carry, counterpress, and
play_pattern, which support more detailed tactical
analysis.
StatsBomb describe in their open-data documen-
tation that every on-the-ball event is tagged manually
by analysts watching match videos. They follow a
protocol that defines the type of event, who was in-
volved and its time and pitch location.
Assessing and Visualizing Principles of Play in Soccer
93

Table 2: Core tactical principles, their definitions and application context.
Type Principle Description
Team
Without Ball
Pressing Immediate pressure on the ball carrier to force a mistake or regain possession.
Compactness Players stay close together, reducing space and blocking passing options.
Coverage and Balance Maintain defensive structure by covering space left by the pressing player.
Containment Delay the opponent’s advance without trying to win the ball immediately.
Control Control tempo and dangerous zones with structured positioning.
Team
With Ball
Penetration Break defensive lines using passes, dribbles, or forward runs.
Space Creation Stretch the opponent’s defence through width, movement, or decoys.
Player Movement Off-ball actions that unbalance opponents and open new options.
Support Stay close to the ball carrier to provide safe passing options.
Creativity Unpredictable actions like dribbles or disguised passes to destabilise defences.
3.4 Positional Data: 360 Freeze Frames
Positional data is provided with more detail, i.e., in-
volving more players, in the 360 freeze frame data
layer of the dataset (StatsBomb, 2021). Each freeze
frame captures a snapshot of the pitch at the moment
of a key event (e.g., a pass or shot). It includes the
locations of nearby players in the visible area of the
pitch based on a broadcast camera. Each player in the
frame is tagged with their position on the field and
whether they are a teammate or opponent.
3.5 Limitations
Although StatsBomb Open Data is highly detailed it
presents some limitations. Notably, the 360 freeze
frame positional data is not available for all competi-
tions and, when available, it does not provide contin-
uous tracking data for all 22 players, but rather static
snapshots around events (i.e., there is no data between
events) and event focus players.
Due to the limited capture scope of the broadcast
cameras, positional data is not provided for all players
in the pitch but only for those in the visible are of
the camera (as illustrated in Figures 4 to 8). When
players are out of the broadcast camera scope, they
are temporarily not included in the freeze frame data
until they reappear in subsequent frames. Moreover,
each 360 freeze frame data only identifies the player
performing the event (i.e., the actor) other players are
tagged simply as from the same or opposing team to
the actor, therefore limiting player-specific tracking
analysis.
However, the data always captures the ball, the
ball carrier, and the surrounding context of the ac-
tion, which ensures that event-based metrics such as
passes, shots, dribbles, pressures and duels are not af-
fected. Although hampering metrics that depend on
the full pitch coverage and identification of all players
(e.g., team width, compactness, and spatial control),
Statsbomb positional data still allows for the study of
general spatial behaviour and team structure.
4 VISUALISATION TOOL
The developed visualisation tool is supported by neu-
ral networks and enables the exploration of tactical
patterns in soccer with a focus on supporting coaches
and analysts in understanding key principles of play.
Built on top of StatsBomb Open Data, the tool allows
the user to filter, extract, and visualise sequences of
play where tactical behaviours emerge—such as com-
pactness, width, support, and pressing.
As discussed earlier, tactical principles (see Table
2) are recurring patterns of collective behaviour that
guide how teams act during different phases of the
match. They help structure training, inform match
analysis, and support decision-making by coaches
and analysts. Tactical principles are typically divided
into two categories: with-ball principles, which gov-
ern attacking behaviour, and without-ball principles,
which relate to defensive organisation.
4.1 Tactical Principles Without Ball
Pressing
Pressing involves applying immediate pressure on the
opponent with the ball, especially during transitions,
to force mistakes or rushed decisions. It aims to dis-
rupt the opponent’s rhythm and recover possession
quickly, preferably near the goal (Rein and Memmert,
2016; Forcher et al., 2024).
Pressure effectiveness can be measured by the op-
ponent’s response time:
t
r
= t
pressure
−t
decision
(1)
Where t
pressure
and t
decision
correspond to the time
when pressure is applied and the time the opponent
reacts. These two timestamps are relevant not only
for computing the interval, t
r
, but also as time bound-
aries for visualization representation of this principle.
Additionally, the number of passes forced or inter-
icSPORTS 2025 - 13th International Conference on Sport Sciences Research and Technology Support
94
cepted under pressure can be evaluated as:
P
f
=
n
∑
i=1
P
i
, P
i
=
(
1 if forced or intercepted
0 otherwise
(2)
Here, P
f
and P
i
correspond to the total pressured
passes and the number of individual pass outcome.
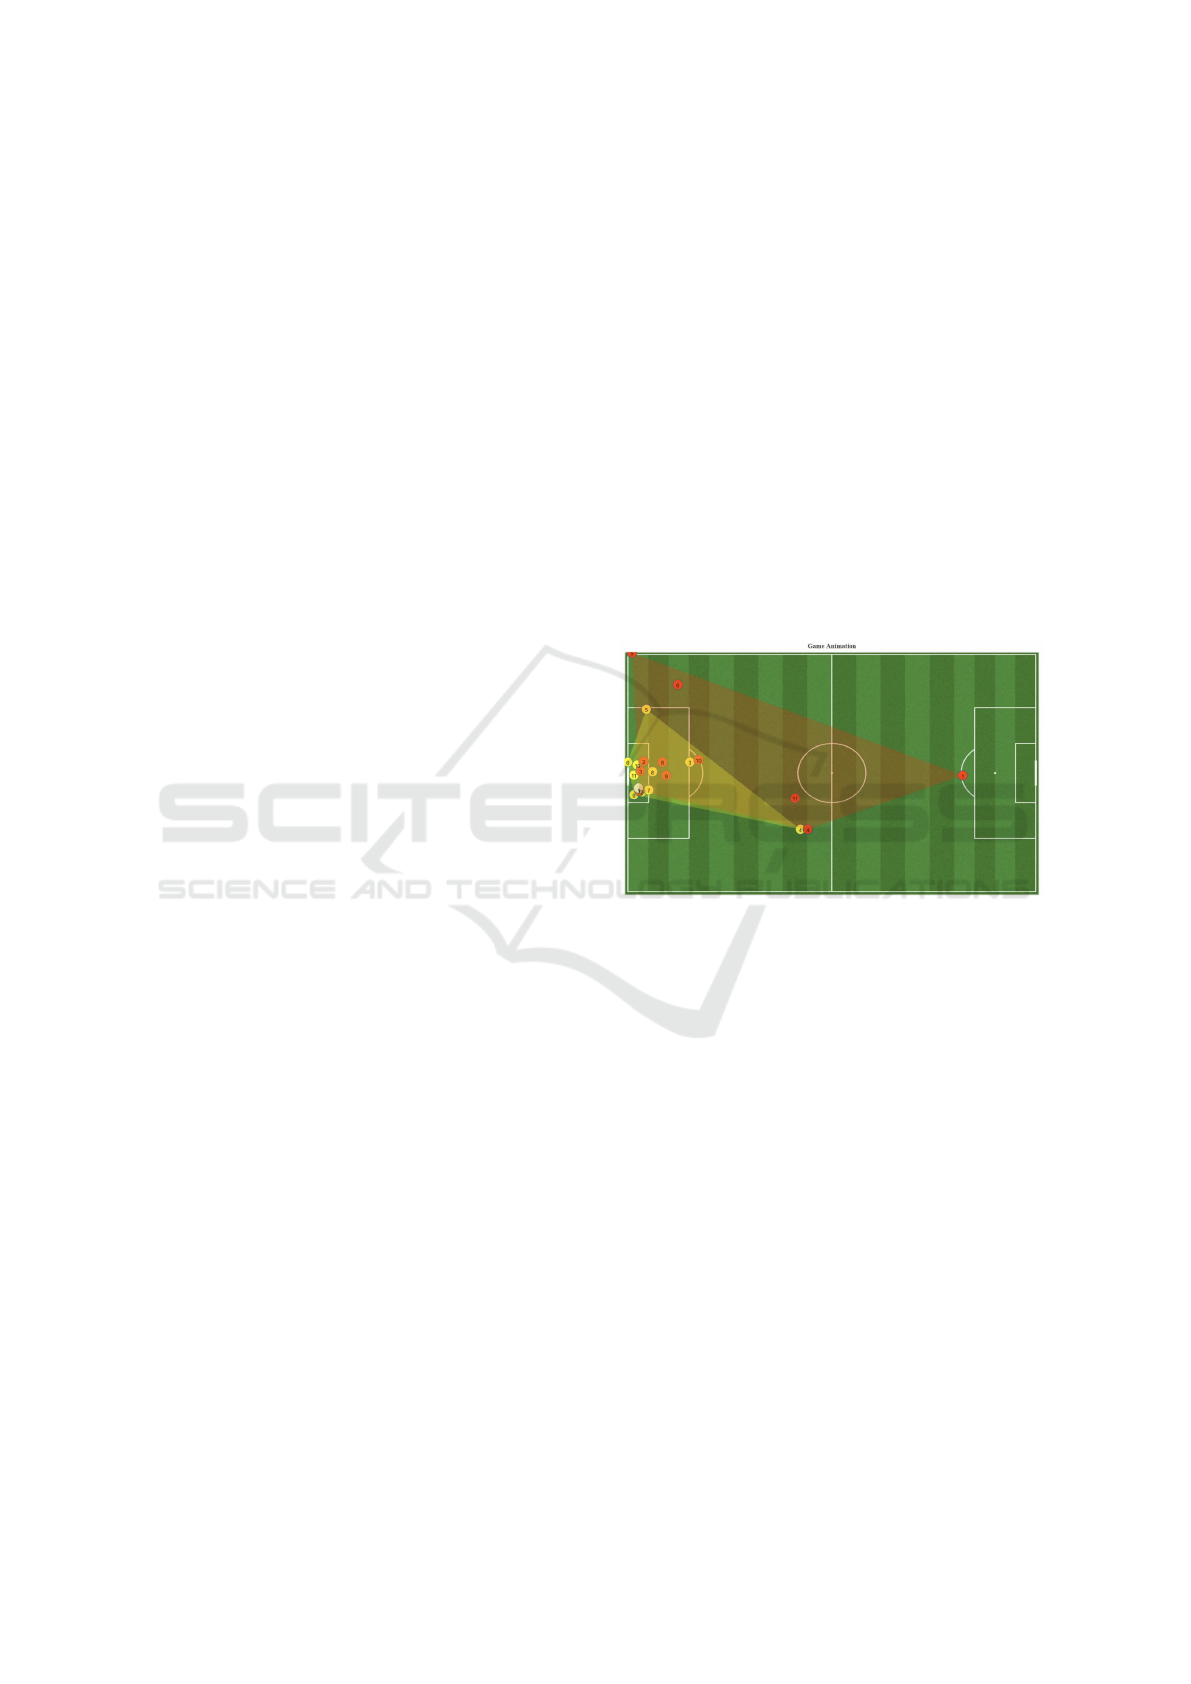
Figure 4 from the developed visualization tool, il-
lustrates pressure on a pass action.
Figure 4: Pressure: Player under pressure, highlighted with
a red circle. The white line indicates the destination of the
next pass. The red polygon represents the visible area of the
broadcast camera.
Compactness
Compactness refers to the team’s ability to remain
close together, minimising spaces between players
and lines. This limits the opponent’s passing op-
tions and enhances the collective defensive response
(Plakias et al., 2024; Meerhoff et al., 2019).
A useful metric is the average distance between
teammates:
¯
d =
1
n
n
∑
i, j=1,i̸= j
q
(x
i
− x
j
)
2
+ (y
i
− y
j
)
2
(3)
where x
i
, y
i
and x
j
, y
j
are player i and j spatial coor-
dinates; and
¯
d is the average pairwise distance.
We can also calculate how much space the team
occupies on the field:
C
i
=
A
field
A
team
(4)
where A
field
corresponds to the total field area and
A
team
the area covered by a particular team.
And assess their compactness via the Stretch In-
dex:
S
i
=
max
i, j
(d
i, j
)
¯
d(i, j)
(5)
here max(d
i, j
) is the maximum distance between
player pairs and
¯
d(i, j) its mean value.
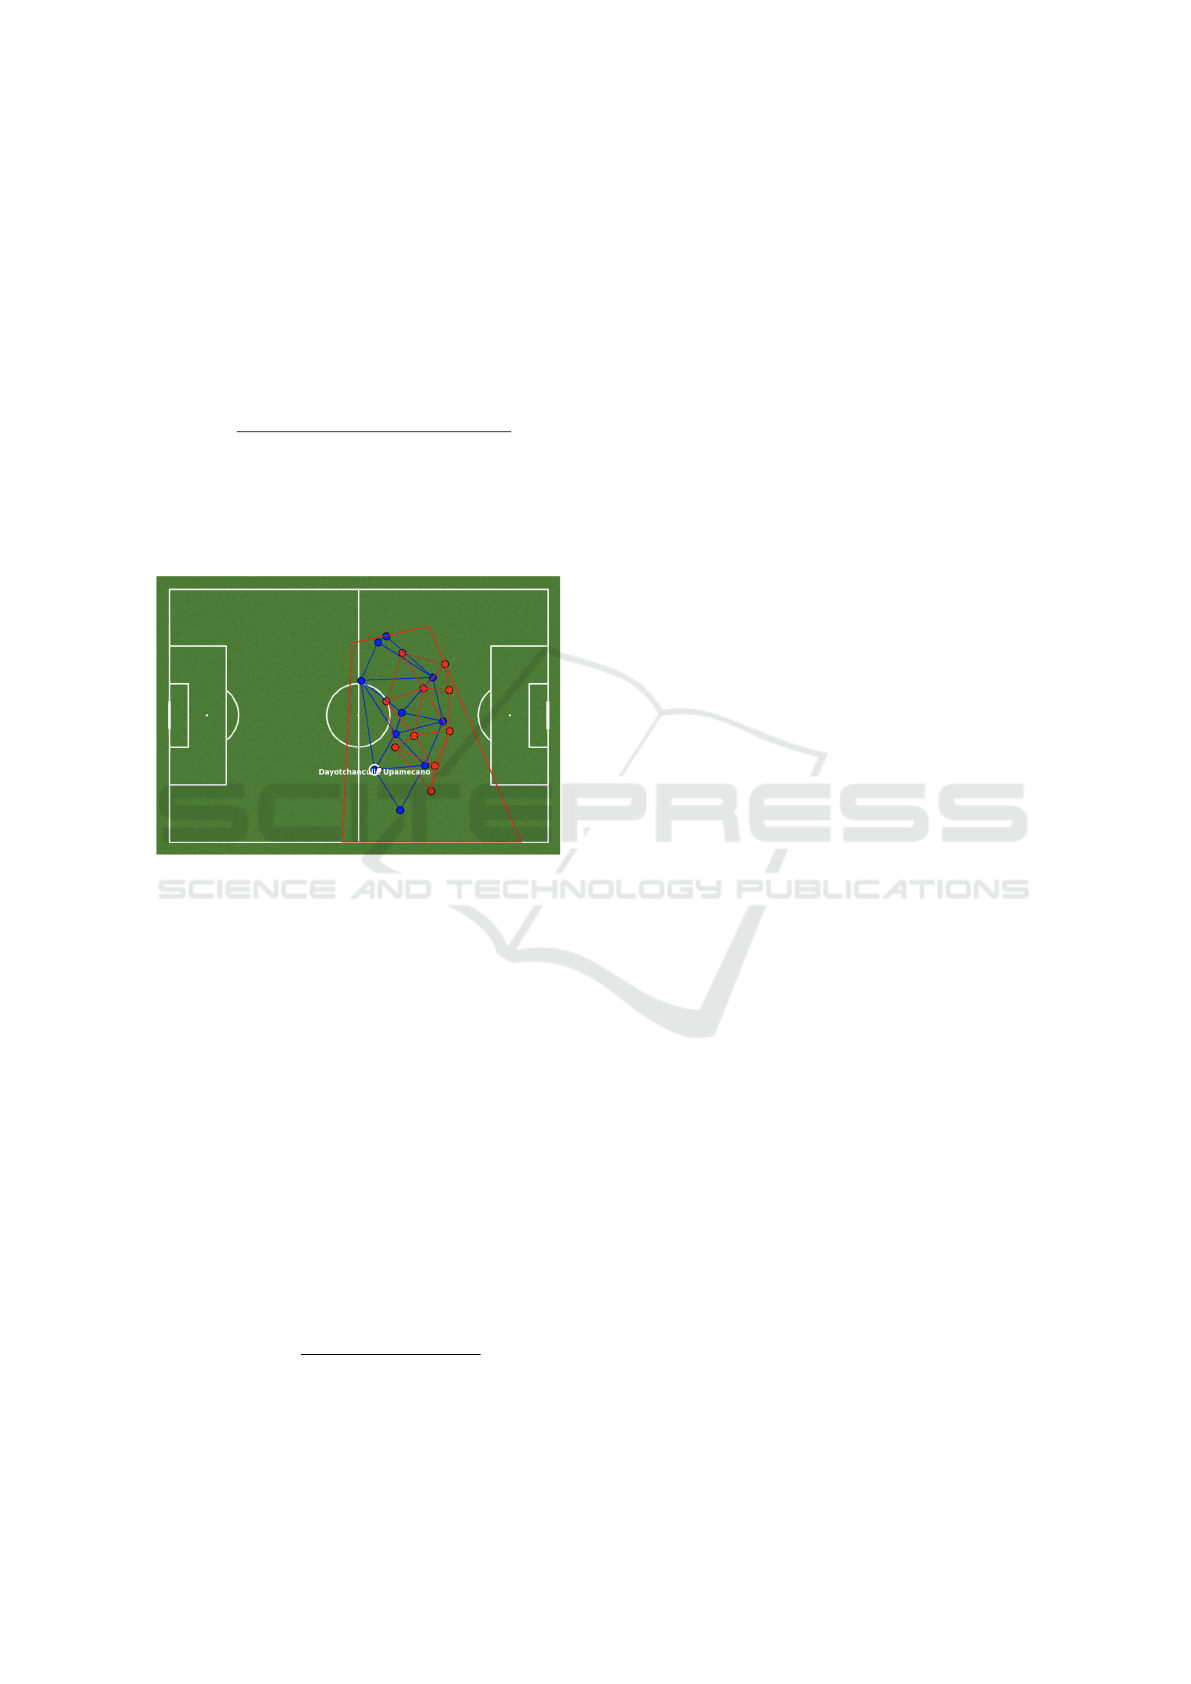
This principle of play is illustrated in Figure 5
from the visualization tool. Here the possible pairs
from each team are represented using the Delaunay
triangulation.
Figure 5: Compactness: Visual representation of team com-
pactness using Delaunay triangulation.
Coverage and Balance
This principle ensures that the team maintains struc-
ture when pressing by repositioning nearby players to
cover the space left by the presser. It provides de-
fensive balance and avoids opening exploitable gaps
(Plakias et al., 2024; Herold et al., 2019).
The proximity between pressing and covering
players is essential and given by the Euclidean dis-
tance between pressing and covering players:
d =
q
(x
1
− x
2
)
2
+ (y
1
− y
2
)
2
(6)
where x
1
, y
1
and x
2
, y
2
are the coordinates of pressing
and covering players.
We can quantify the fraction, B of players main-
taining their defensive roles:
B =
N
def
N
total
(7)
where N
def
is the number of players in defensive roles
and N
total
the total number of players.
And evaluate team balance using its centroid:
C
x
=
1
n
n
∑
i=1
x
i
, C
y
=
1
n
n
∑
i=1
y
i
(8)
where C
x
, C
y
is the team centroid coordinates; and
x
i
, y
i
the coordinates of each player of the focus team.
Containment
Containment slows down the opponent’s offensive
momentum without direct ball recovery attempts. It
forces lateral or backward play and provides time
Assessing and Visualizing Principles of Play in Soccer
95

for team reorganization (Rein and Memmert, 2016;
Forcher et al., 2024).
The defender’s reaction time, t
r
is given by:
t
r
= t
decision
−t
pressure
(9)
where t
decision
and t
pressure
correspond to the oppo-
nent’s action defender’s approach timestamps.
Passes blocked or intercepted during containment
are measured as:
I =
n
∑
i=1
I
i
, I
i
=
(
1 if pass i is intercepted
0 otherwise
(10)
where I is the total interceptions and I
i
= binary indi-
cator of interception (or not) for pass i.
Control
Control reflects the ability to dictate space and rhythm
defensively, usually by positioning to block danger-
ous zones and slow the match’s tempo Nouraie et al.
(2023).
The controlled area, A
c
, can be estimated by:
A
c
= d × P
b
(11)
here d stands for the defender’s proximity and P
b
the
number of blocked passes.
Possession time while maintaining defensive con-
trol, t
c
is:
T
c
= t
possession
−t
interception
(12)
where t
possession
and t
interception
correspond to the start
of controlled possession and interception timestamps.
4.2 Tactical Principles with Ball
Penetration
Penetration is the ability to move the ball past defen-
sive lines using passes, dribbles, or forward runs and
is key to disrupting defensive structures and creating
chances (Bauer and Anzer, 2021; Rein and Memmert,
2016).
The forward progress achieved, d, via pass or ball
carry, is given by:
d =
q
(x
2
− x
1
)
2
+ (y
2
− y
1
)
2
(13)
where x
1
, y
1
and x
2
, y
2
are the initial and final posi-
tions.
In addition to the pitch progress we can also count
the number of successful penetrative passes, P
s
as:
P
s
=
∑
n
i=1
P
i
, P
i
=
(
1 if line-breaking pass is completed
0 otherwise
(14)
where P
i
is an indicative binary function associated to
progressive pass completion. Figure 6 illustrates the
representation of a progressive pass situation.
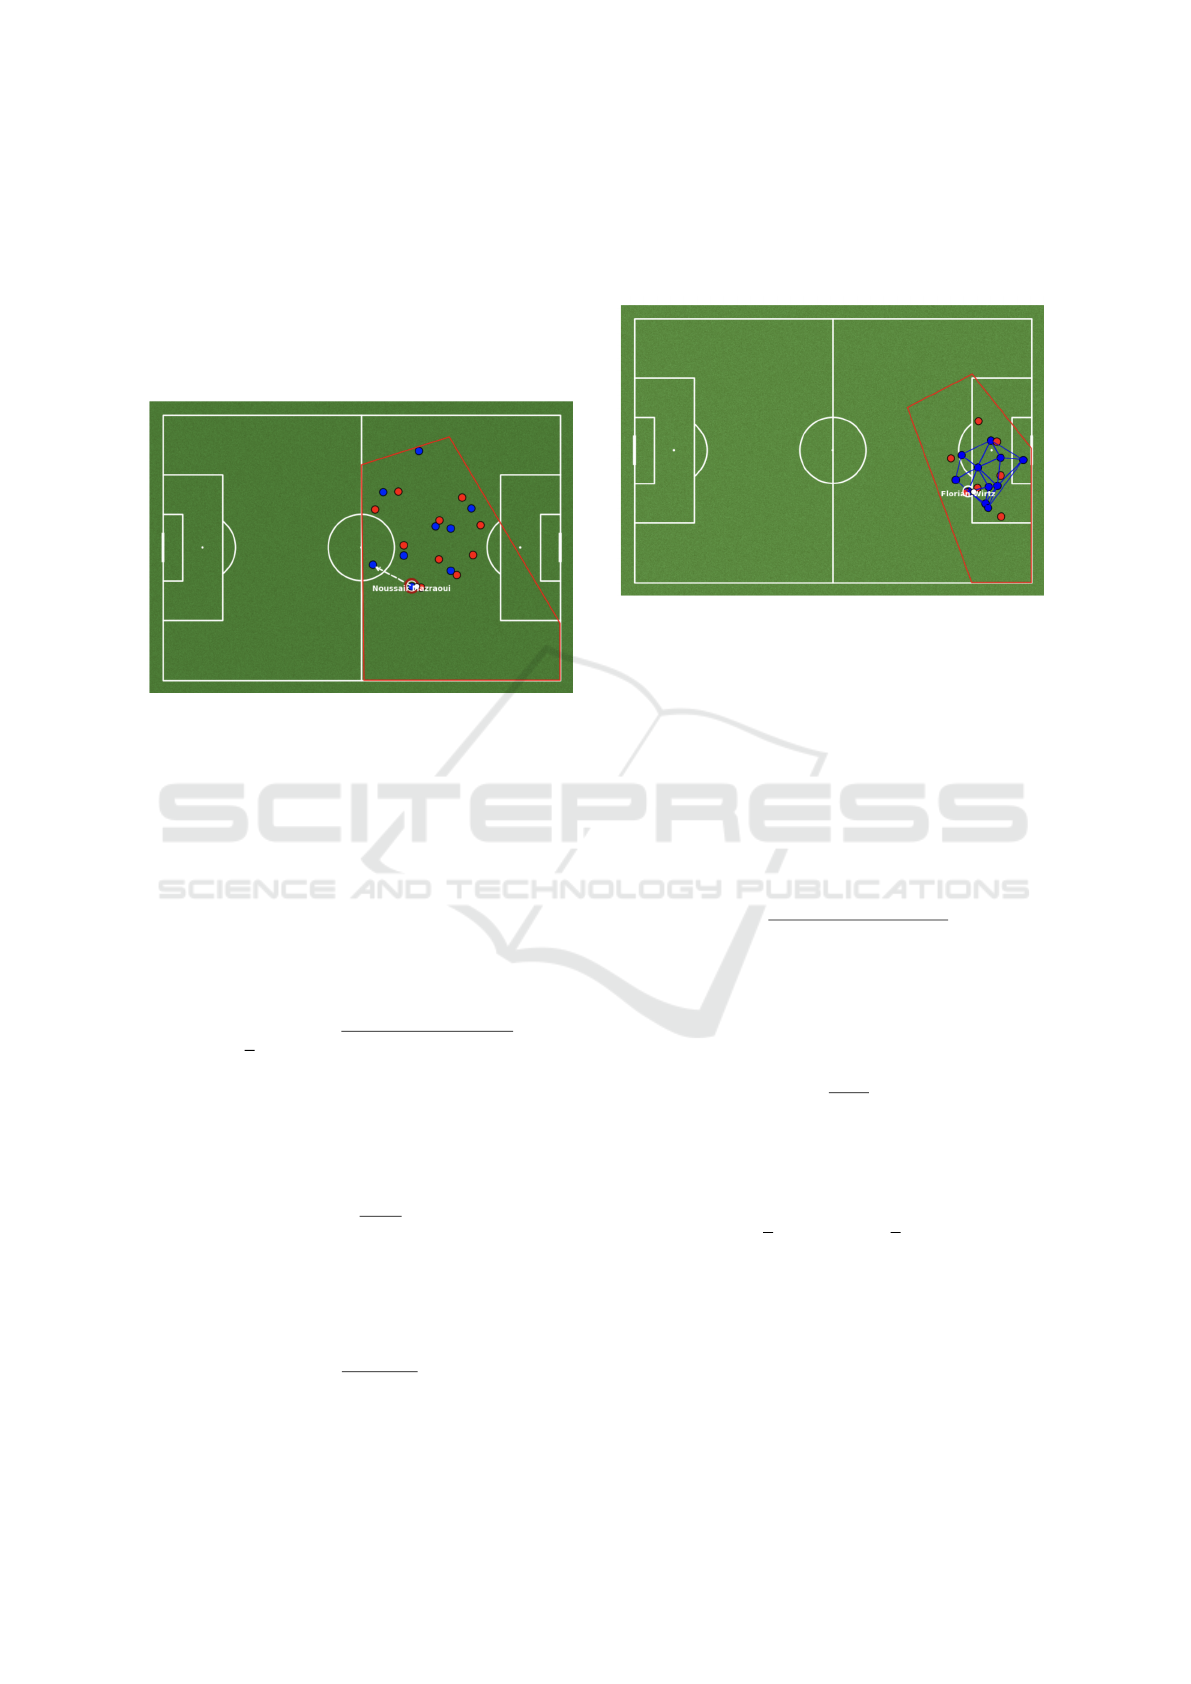
Figure 6: Example of a penetrative pass breaking the de-
fensive line.A red dashed line with an arrow represents the
penetrating pass.The faded point indicates the player who
will receive the ball in the next frame.
Space Creation
Space creation stretches the opposing defence using
width, movement, and decoy runs. It helps open
passing lanes and create favourable match-ups (Stival
et al., 2023; Caldeira, 2023; Meerhoff et al., 2019).
The available space generated, A
s
is:
A
s
= A
total
− A
occupied
(15)
where A
total
is full field area and A
occupied
the used
area.
The Stretch Index, S
i
also applies here:
S
i
=
max
i, j
(d
i, j
)
¯
d(i, j)
(16)
where max(d
i, j
) is the maximum inter-player distance
and
¯
d(i, j) is the average inter-player distance.
Player Movement
This principle involves intelligent off-ball movement
to unbalance defences, either by dragging defenders
away or creating new passing lanes (Bauer and Anzer,
2021; Rein and Memmert, 2016; Plakias et al., 2024).
We can measure the frequency of such move-
ments, M
s
as:
M
s
=
∑
n
i=1
M
i
M
i
=
(
1 movement creates passing option
0 otherwise
(17)
here M
i
is a binary indicator function for meaningful-
ness of movement i.
Support
Support ensures that the ball carrier has immediate
and safe passing options nearby, enabling fluid and
continuous attack (Muacho et al., 2022; Bauer and
Anzer, 2021; Rein and Memmert, 2016).
icSPORTS 2025 - 13th International Conference on Sport Sciences Research and Technology Support
96
The total number of supported passes, P
r
is:
P
r
=
n
∑
i=1
P
i
, P
i
=
(
1 if pass is received
0 otherwise
(18)
here P
i
is a binary indicator function if pass i had sup-
port (or not).
In addition to the number of supported passes, the
distance, d
s
between the ball carrier and a support
player can also be computed as:
d
s
=
q
(x
player
− x
pass
)
2
+ (y
player
− y
pass
)
2
(19)
where x
player
, y
player
and x
pass
, y
pass
are the positional
coordinates for the player with ball and its support
player. Figure 7 illustrates this concept.
Figure 7: Support, contextual positioning of players, high-
lighting available passing lanes and supporting options.
Creativity
Creative actions introduce unpredictability through
dribbles, disguised passes, or unusual movements.
These actions break rigid defensive lines and sur-
prise opponents (Rein and Memmert, 2016; Bauer
and Anzer, 2021; Stival et al., 2023).
We track the number of successful creative ac-
tions, J
s
by:
J
s
=
n
∑
i=1
J
i
, J
i
=
(
1 if creative action succeeds
0 otherwise
(20)
where J
i
is a binary indicator function accounting if
creative action i succeeded (or not).
The ground covered in these creative moments can
be assessed by distance d
c
:
d
c
=
q
(x
2
− x
1
)
2
+ (y
2
− y
1
)
2
(21)
where x
1
, y
1
and x
2
, y
2
correspond to the start and end
coordinates for the creative action.
As illustrated in the previous figures, rather than
focusing purely on statistical metrics, the tool is de-
signed to represent how and where these tactical prin-
ciples occur on the pitch. By combining event data
with 360 freeze frames, it becomes possible to explore
the spatial context of each action, including the posi-
tioning of teammates, opponents, and the visible area
perceived by the player at the time of the event.
Notably, the use of timestamped notational data
enables the clear definition of time boundaries for the
representation of each principle of play. In Figure
8 different metrics are represented at the two time
boundaries of the selected event (a pass).
The aim is to go beyond isolated data points and
enable the analysis of movement, positioning, and in-
teraction patterns within the collective behaviour of
the team. The system helps identify when certain
principles are respected or broken, and under what
match conditions these patterns tend to emerge, offer-
ing valuable support for tactical evaluation and coach-
ing decision-making.
5 CONCLUSIONS
Building upon the review of existing tools, this pa-
per examined the evolution of soccer data visualisa-
tion, pointing out the transition from static statistical
outputs to more sophisticated, context-aware systems.
While the field has advanced considerably, many ex-
isting tools still fall short in representing the tactical
nuances of the match—particularly those related to
the principles of play that guide collective team be-
haviour.
To address these limitations, we developed a visu-
alisation prototype based on StatsBomb Open Data,
designed to capture and interpret tactical patterns such
as compactness, pressing, width, support, and pene-
tration. The tool integrates spatial and temporal con-
text using event data and 360 freeze frames, allowing
analysts to explore not just what happens on the pitch,
but how and why those behaviours emerge in different
phases of play.
Rather than relying on isolated metrics or pre-
defined statistics, the system visualizes the position-
ing, interactions, and movements that underpin team
dynamics. This enables analysts and coaches to eval-
uate whether tactical principles are being respected,
where they break down, and under what match condi-
tions such patterns tend to appear.
Match-related factors such as opponent, score,
referee and lineups are integrated as contextual infor-
mation and can be used to filter or group the visualisa-
tions. This allows analyses across multiple matches,
Assessing and Visualizing Principles of Play in Soccer
97
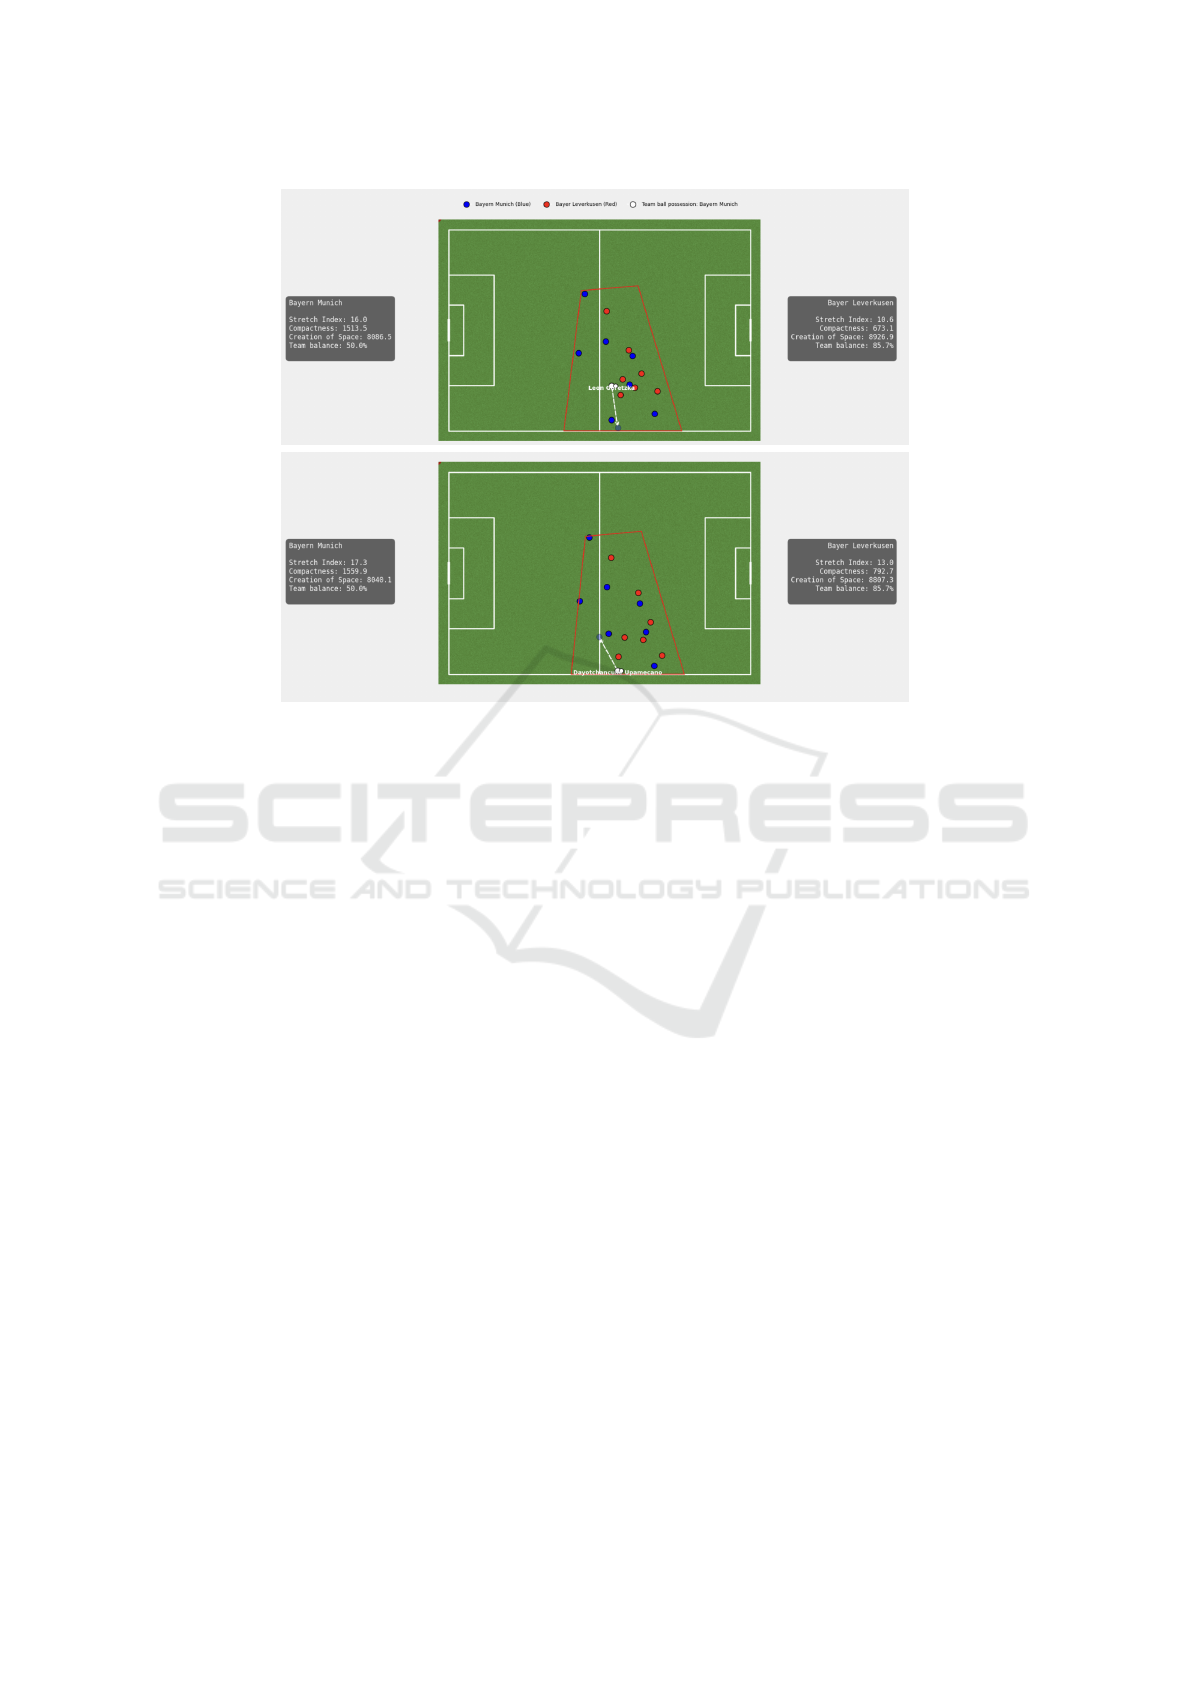
Figure 8: Two consecutive moments.
for example by aggregating positional data to build
heatmaps or computing average metrics for specific
opponents, score-lines or lineups.
The tool has been developed in close collabora-
tion with an elite-level coach, who provides continu-
ous expert feedback as a form of practical validation.
Ultimately, the approach bridges the gap between
raw match data and applied tactical insight, offering a
practical resource for those seeking to enhance perfor-
mance evaluation, coaching feedback, and decision-
making in professional soccer. Although using Stats-
Bomb open data the principles and tools proposed are
of general validity and can be used, with proper adap-
tation and caution, to other data sets.
ACKNOWLEDGEMENTS
We would like to thank Nelson Caldeira for shar-
ing valuable insights into the key aspects that soccer
coaches prioritise when analysing team performance.
Rui J. Lopes was partly supported by FCT - Fundac¸
˜
ao
para a Ci
ˆ
encia e Tecnologia, I.P. by project refer-
ence UIDB/50008/2020, and DOI identifier https:
//doi.org/10.54499/UIDB/50008/2020 awarded
to Instituto de Telecomunicac¸
˜
oes.
REFERENCES
Bauer, P. and Anzer, G. (2021). Data-driven detection of
counterpressing in professional football. Data Mining
and Knowledge Discovery, 35:2009–2049.
Bauer, P., Anzer, G., and Shaw, L. (2023). Putting team for-
mations in association football into context. Journal
of Sports Analytics, 9(1):39–59.
Caldeira, N. C. A. (2023). Functional space-time properties
of team synergies in high-performance football. Sen-
sors, 23(5):1284.
Delibas, E., Uzun, A., Inan, M. F., Guzey, O., and Cakmak,
A. (2019). Interactive exploratory soccer data analyt-
ics. INFOR, 57(2):141–164.
Forcher, L., Beckmann, T., Wohak, O., Romeike, C., Graf,
F., and Altmann, S. (2024). Prediction of defensive
success in elite soccer using machine learning – tac-
tical analysis of defensive play using tracking data
and explainable ai. Science and Medicine in Football,
8(4):317–332.
Herold, M., Goes, F., Nopp, S., Bauer, P., Thompson, C.,
and Meyer, T. (2019). Machine learning in men’s pro-
fessional football: Current applications and future di-
rections for improving attacking play. International
Journal of Sports Science and Coaching, 14(6):798–
817.
Janetzko, H., Sacha, D., Stein, M., Schreck, T., Keim, D. A.,
and Deussen, O. (2014). Feature-driven visual analyt-
ics of soccer data. In 2014 IEEE Conference on Visual
Analytics Science and Technology (VAST), pages 13–
22.
Krishnamurthy, P. and Nanda, N. (2021). Dynamic data
icSPORTS 2025 - 13th International Conference on Sport Sciences Research and Technology Support
98

visualization for soccer performance metrics. In
2021 6th International Conference for Convergence in
Technology (I2CT), pages 1–6.
Liu, N. (2022). Geovisualisation of football players move-
ment. Master’s thesis, Palack
´
y University Olomouc
and Paris Lodron University Salzburg. Erasmus
Mundus Joint Master in Digital Earth.
Meerhoff, L. A., Goes, F. R., Leeuw, A.-W. D., and Knobbe,
A. (2019). How dots behave in two different pitch
sizes? analysis of tactical behavior based on posi-
tion data in two soccer field sizes. Communications in
Computer and Information Science, 1168:235–246.
Muacho, H., Ribeiro, R., and Lopes, R. (2022). The elusive
features of success in soccer passes: A machine learn-
ing perspective. In 10th International Conference on
Sport Sciences Research and Technology Support (ic-
SPORTS 2022), pages 110–116.
Nouraie, M., Eslahchi, C., and Baca, A. (2023). Intelligent
team formation and player selection: A data-driven
approach for football coaches. Applied Intelligence,
53:30250–30265.
Perin, C., Vuillemot, R., Stolper, C. D., Stasko, J. T., Wood,
J., and Carpendale, S. (2018). State of the art of
sports data visualization. Computer Graphics Forum,
37(3):663–686.
Plakias, S., Kokkotis, C., and Tsaopoulos, D. E. (2024).
Can artificial intelligence revolutionize soccer tactical
analysis? Trends in Sport Sciences, 31(3).
Rein, R. and Memmert, D. (2016). Big data and tactical
analysis in elite soccer: Future challenges and oppor-
tunities for sports science. SpringerPlus, 5:1410.
Sacha, D., Al-Masoudi, F., Stein, M., Schreck, T., Keim,
D. A., Andrienko, G., and Janetzko, H. (2017). Dy-
namic visual abstraction of soccer movement. Com-
puter Graphics Forum, 36(3):305–315.
Sotudeh, H. (2025). The principles of tactical formation
identification in association football (soccer) – a sur-
vey. Frontiers in Sports and Active Living, 6:1512386.
StatsBomb (2019a). Statsbomb open data specifica-
tion: Competitions v2.0.0. https://github.com/
statsbomb/open-data. Accessed May 2025.
StatsBomb (2019b). Statsbomb open data specification:
Events v4.0.0. https://github.com/statsbomb/
open-data. Accessed May 2025.
StatsBomb (2019c). Statsbomb open data specification:
Lineups v2.0.0. https://github.com/statsbomb/
open-data. Accessed May 2025.
StatsBomb (2019d). Statsbomb open data specification:
Matches v3.0.0. https://github.com/statsbomb/
open-data. Accessed May 2025.
StatsBomb (2021). Statsbomb open data specification: 360
frames v1.0.0. https://github.com/statsbomb/
open-data. Accessed May 2025.
Stival, L., Pinto, A., dos Santos Pinto de Andrade, F., San-
tiago, P. R. P., Biermann, H., da Silva Torres, R., and
Dias, U. (2023). Using machine learning pipeline to
predict entry into the attack zone in football. PLoS
ONE, 18(1):e0265372.
Assessing and Visualizing Principles of Play in Soccer
99
