Real-Time Weld Quality Prediction in Automated Stud Welding:
A Data-Driven Approach
Beatriz Coutinho
1 a
, Bruno Santos
1 b
, Rita Gomes Mendes
2 c
, Gil Gonc¸alves
1 d
and V
´
ıtor H. Pinto
1 e
1
SYSTEC ARISE, Faculdade de Engenharia, Universidade do Porto,
Rua Dr. Roberto Frias, 4200-465 Porto, Portugal
2
ISQ&CTAG Automotive Technologies, Monc¸
˜
ao, Portugal
Keywords:
Stud Welding, Weld Quality Prediction, Sensorisation, Data Acquisition.
Abstract:
Drawn arc stud welding is extensively used in automotive assembly lines for attaching components to vehicle
bodies. In these automated processes, low-quality welds can compromise structural integrity and cause produc-
tion delays due to rework and maintenance. This paper describes the initial development stage of an artificial
intelligence (AI)-based system for real-time weld quality prediction in automated stud welding. The focus
of this first phase is on implementing sensorisation, developing a data acquisition system, and constructing a
dataset that captures the most relevant process variables characterizing the welding process. A Flask-based
application was developed to facilitate data collection, incorporating an automatic character recognition al-
gorithm to extract parameters directly from the control unit display. Initial welding experiments produced a
dataset of approximately 200 samples, with preliminary data analysis validating expected parameter trends.
The results confirm the system’s capability to effectively capture relevant data, forming the basis for future
development of a predictive model aimed at enhancing weld quality monitoring and minimizing assembly line
interruptions.
1 INTRODUCTION
Drawn arc stud welding (SW) is a process that uses
an electric arc to fuse a metal stud to a workpiece.
It is widely used across various manufacturing sec-
tors due to its fast cycle time, and the simplicity and
cost-effectiveness of the equipment involved (Klaric
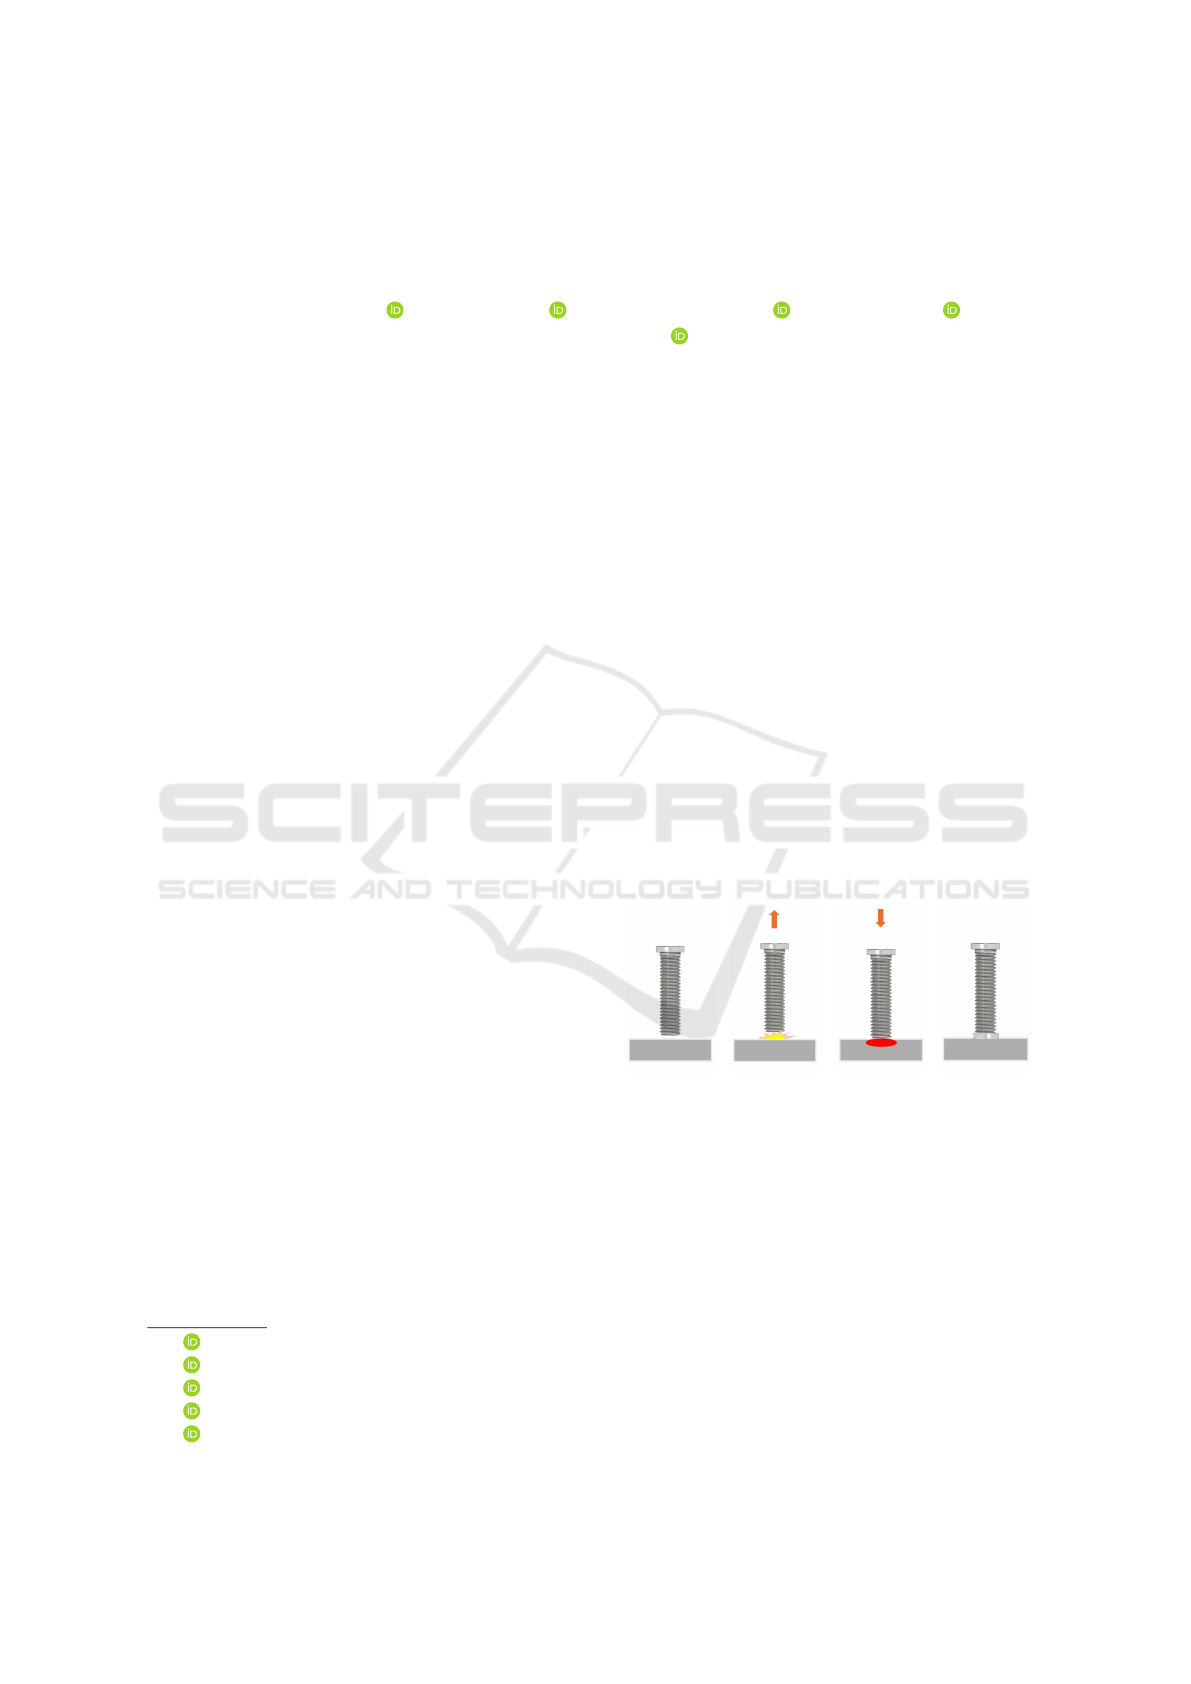
et al., 2010). The SW process involves generating an
electric arc between the stud and the workpiece (Fig-
ure 1b), which melts both the surface of the workpiece
and the tip of the stud. Once the materials are molten,
the stud is pressed into the workpiece (Figure 1c), and
as the metal cools and solidifies, it forms a strong and
permanent bond (Figure 1d) (T. Lienert, 2011).
In the automotive industry, SW is commonly used
on assembly lines to attach different components to
the car body, with the process typically being fully au-
a
https://orcid.org/0009-0000-9769-6726
b
https://orcid.org/0009-0007-6038-6506
c
https://orcid.org/0009-0008-9899-6729
d
https://orcid.org/0000-0001-7757-7308
e
https://orcid.org/0000-0002-7840-0333
(a) Stud po-
sitioning.
(b) Lift. (c) Plunge. (d) Welded
stud.
Figure 1: Arc stud welding process.
tomated. Low-quality welds in these automated lines
can have a significant impact. If undetected, they may
compromise the structural integrity of the final prod-
uct, and even when detected, they lead to frequent in-
terruptions for maintenance and manual rework, re-
ducing overall efficiency and causing production de-
lays.
This work addresses this issue by proposing the
development of an artificial intelligence (AI) model
capable of predicting, in real-time, if a weld will be
defective. To achieve this, two main stages are re-
Coutinho, B., Santos, B., Mendes, R. G., Gonçalves, G. and Pinto, V. H.
Real-Time Weld Quality Prediction in Automated Stud Welding: A Data-Driven Approach.
DOI: 10.5220/0013714100003982
Paper published under CC license (CC BY-NC-ND 4.0)
In Proceedings of the 22nd International Conference on Informatics in Control, Automation and Robotics (ICINCO 2025) - Volume 1, pages 251-258
ISBN: 978-989-758-770-2; ISSN: 2184-2809
Proceedings Copyright © 2025 by SCITEPRESS – Science and Technology Publications, Lda.
251
quired: (1) the construction of a dataset containing
key process variables that reflect weld quality, and
(2) the selection, training, and testing of a super-
vised machine learning (ML) algorithm to predict the
weld quality outcomes. This project is part of the
GreenAuto Agenda, co-financed by the Portuguese
Recovery and Resilience Plan, that aims to posi-
tion the national automotive industry within the value
chain of low-emission vehicles (Agenda GreenAuto,
2021).
This paper primarily focuses on the first develop-
ment stage: the construction of the dataset . Section 2
presents a literature review supporting the selection
of relevant process parameters. Section 3 outlines
the methodology, including the welding environment
setup, welding experiments, and the key parameters
identified for assessing weld quality. Section 4 fo-
cuses on the implementation details of the sensorisa-
tion setup and the data acquisition system and meth-
ods. Section 5 presents the implementation results
along with a preliminary data analysis. Lastly, Sec-
tion 6 summarizes the main findings and future work
directions.
2 LITERATURE REVIEW
Accurately estimating and predicting the quality of
the stud weld requires identifying the most relevant
process parameters and selecting the appropriate anal-
ysis methods. This Section reviews studies on SW to
help determine the key parameters that best character-
ize the process.
In (Naddaf-Sh et al., 2023), an AI-based approach
was proposed to detect and classify defects in SW. An
experimental setup was created to intentionally pro-
duce defective welds while recording parameters such
as voltage, welding current, linear motor current, and
pin displacement. The study concluded that welding
voltage and pin lift distance were the most influential
factors in defect classification.
Similarly, (Samardzic et al., 2007) explored the ef-
fects of welding voltage and current on weld quality
by applying the process to surfaces with varying con-
tamination levels, such as dust and rust, while keeping
other variables constant. The findings reiterated that
welding voltage plays a critical role in identifying de-
fects, however changes in current alone were found to
be insufficient.
In (Klaric et al., 2010), several factors, such as
welding current, process duration, and stud plunge
and lift were evaluated to assess their impact on weld
penetration depth. The analysis revealed that welding
current and duration were the most significant factors.
Another author (Chambers, 2001) examined the
fundamental principles of SW to support better inter-
pretation of results. It emphasized the importance of
parameters like pin motion, process duration, and cur-
rent, as well as the condition of the welding equip-
ment and environment. Factors such as dust, humid-
ity, and high machine temperatures were found to de-
grade components, especially electrical cables, con-
sequently affecting weld quality. The study also high-
lighted more process specific parameters, including
the pin immersion depth, lift distance, weld duration,
current, and pin-to-plate alignment, as valuable for
characterizing the process.
Lastly, (Al-Sahib et al., 2009) emphasized the sig-
nificance of electrical parameters, particularly cur-
rent, in assessing weld quality. The analysed met-
rics included root mean square (RMS), average, time-
integrated, and peak current, identifying peak current
as the most indicative of weld quality. It also dis-
cussed how the welding duration, current range, plate
thickness, and pin diameter affect the process. Ad-
ditionally, the study highlighted challenges in using
external sensors due to heat, splatter, fumes, and elec-
tromagnetic noise generated during welding.
3 METHODOLOGY
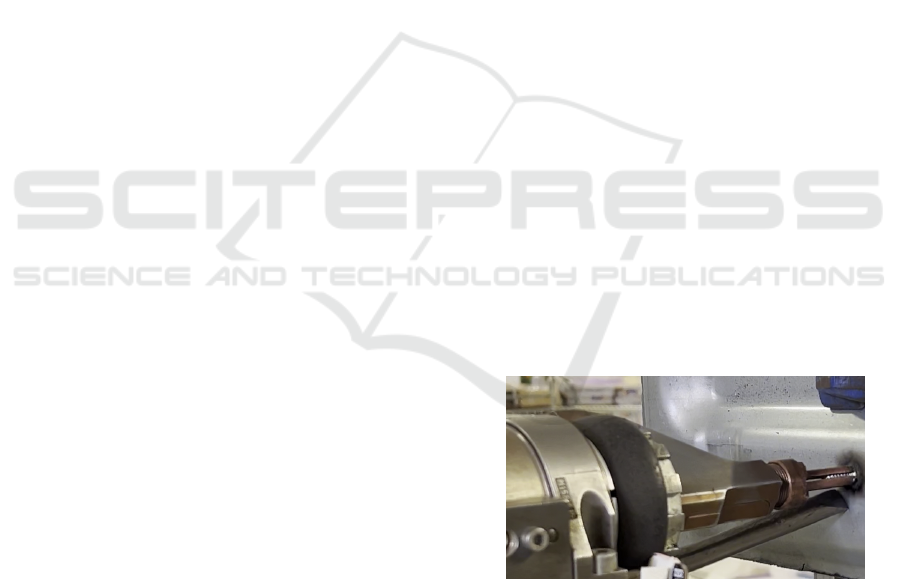
The SW process being modelled involves the attach-
ment of metal studs to metal plates, as seen in Fig-
ure 2, as part of an automotive assembly line. The
process is carried out using an LM310 welding head,
which is powered by a DCE1500 control and energy
unit.
Figure 2: Stud welding process.
The DCE1500 unit features a small display that
shows some process parameters measured by the sys-
tem itself after each weld, such as the arc voltage in
the pilot current phase, arc voltage in weld current
phase, weld current, welding process duration, stud
drop time, lift distance and process energy, as illus-
trated in Figure 3. Figure 4 outlines the typical weld-
ing cycle under DCE1500 control, showing the tem-
ICINCO 2025 - 22nd International Conference on Informatics in Control, Automation and Robotics
252
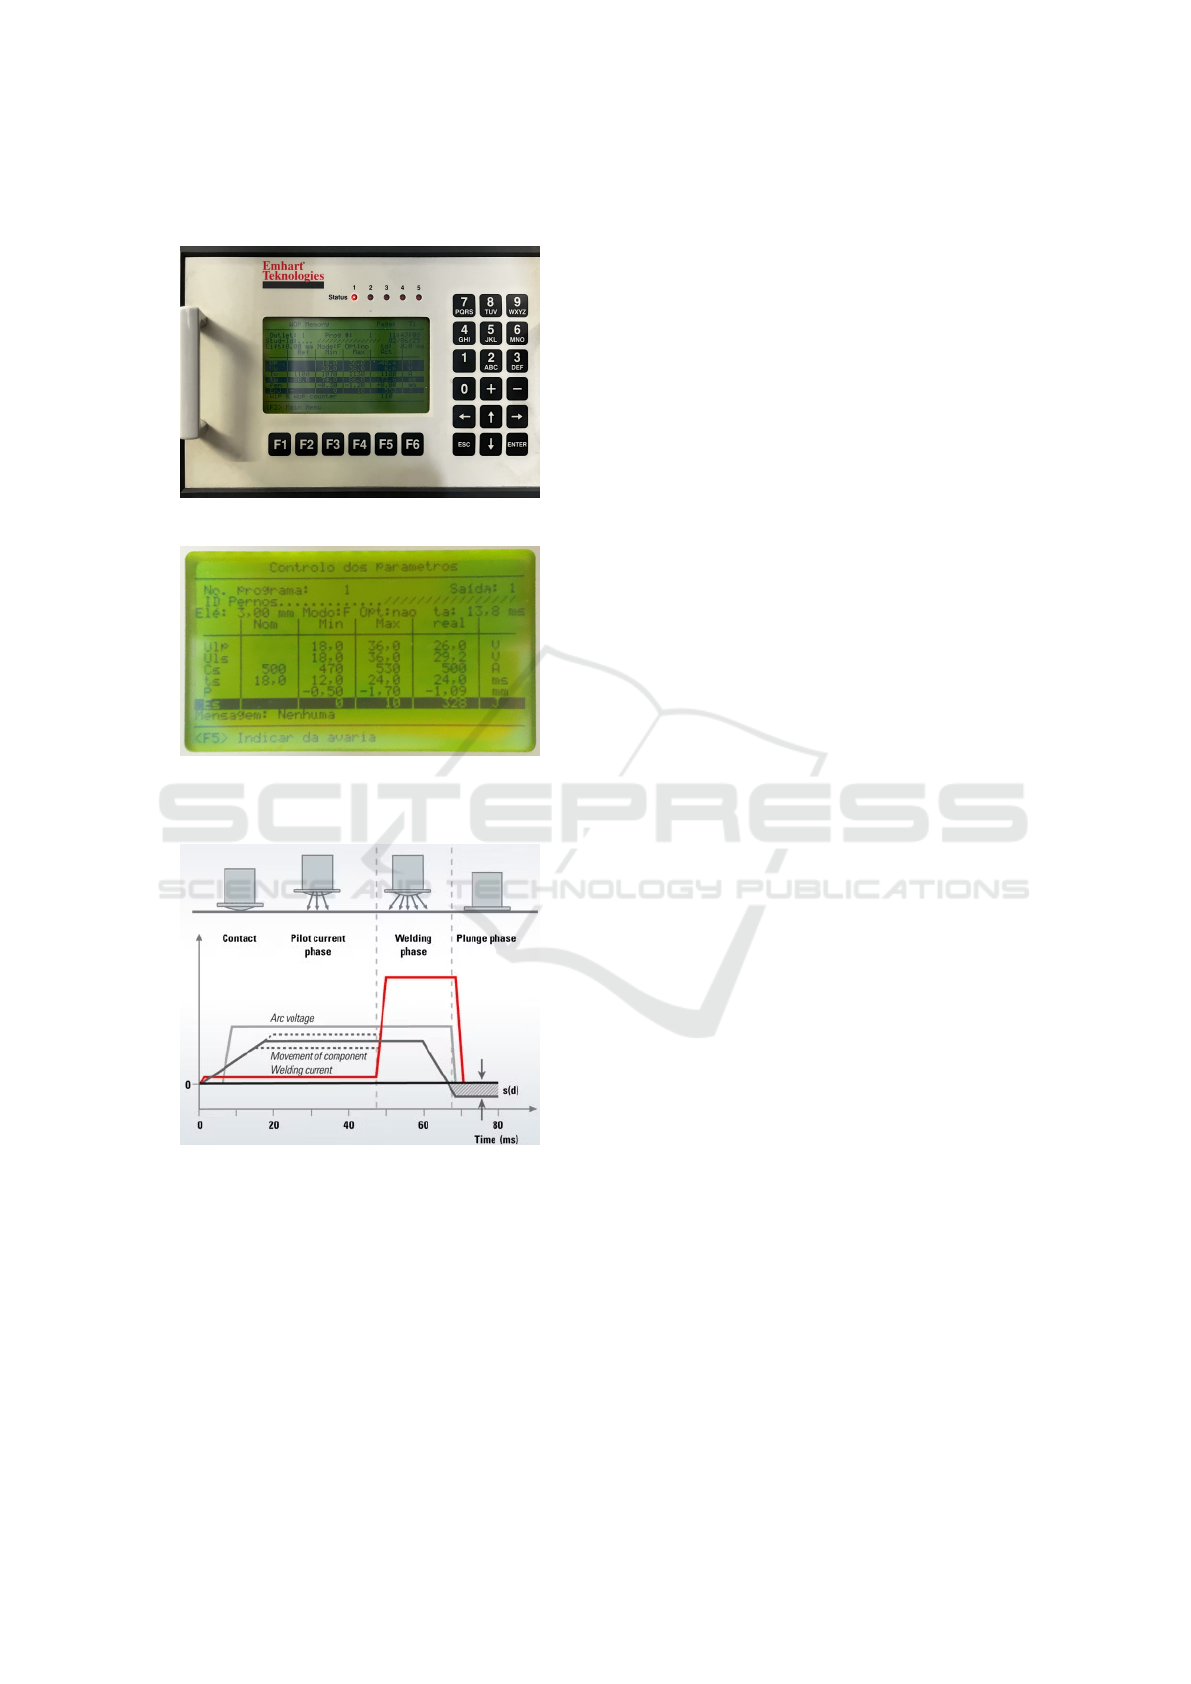
poral evolution of arc voltage, welding current, and
stud movement.
(a) DCE1500 control unit display.
(b) Displayed process parameters (close-up).
Figure 3: Welding system control and display panel.
Figure 4: Typical stud welding cycle under DCE1500 con-
trol (PT. Unggul Semesta, ).
Since the objective is to run the predictive model
in real-time during production, a Physical Twin of the
welding system was developed to enable model de-
velopment and testing in a non-disruptive way. This
Physical Twin will be used in the early project stages
to collect data and perform welding experiments, be-
fore the deployment on the assembly line.
The literature review presented in Section 2
guided the selection of the variables to be monitored
in this case study. These studies helped anticipate how
different welding parameters can affect the final weld
quality and revealed potential challenges in modelling
the SW process. As a result, the variables listed in
Table 1 were considered to be monitored for their po-
tential to accurately characterize the SW process, and
therefore support the successful development of the
weld quality prediction model.
4 IMPLEMENTATION
This Section details the implementation of the devel-
oped system.
4.1 Sensorisation
Among the parameters listed in Table 1, electrical
quantities such as voltage and current stand out as es-
sential for assessing the quality of the SW process.
The temperature reached by the plate during the weld-
ing is also a critical factor, as inadequate values can
result in excessive or insufficient fusion of the compo-
nents, jeopardising the final weld quality. Other im-
portant parameters include the distance between the
welding gun and the plate, as well as the inclination
of the plate during the process. Environmental condi-
tions, specifically the concentration of carbon monox-
ide (CO), ambient humidity, and temperature, were
also considered essential to monitor due to their po-
tential influence on process stability.
Considering this, the following sensors were se-
lected:
• LEM HTFS 800-P: a current sensor, capable of
measuring currents until 1200A with an accuracy
of 1%. Utilised to measure the welding process
current.
• MLX90614-DCI: an I2C non-contact in-
frared (IR) temperature sensor, suitable
for industrial applications due to its small
field of view (FOV) of 5º. It is capable of measur-
ing temperatures between -70ºC and 270ºC with
an accuracy of 0.5ºC. Utilised for measuring the
plate temperature.
• MQ-7: a CO sensor, capable of detecting
CO concentrations in the air from 20 to 2000
parts per million (ppm). Utilised to measure the
air quality during the welding process.
• BME688: an I2C environmental, utilised for
measuring the ambient temperature and humidity.
It is capable of measuring temperature between
0ºC and 65ºC with an accuracy of 0.5ºC and rel-
Real-Time Weld Quality Prediction in Automated Stud Welding: A Data-Driven Approach
253
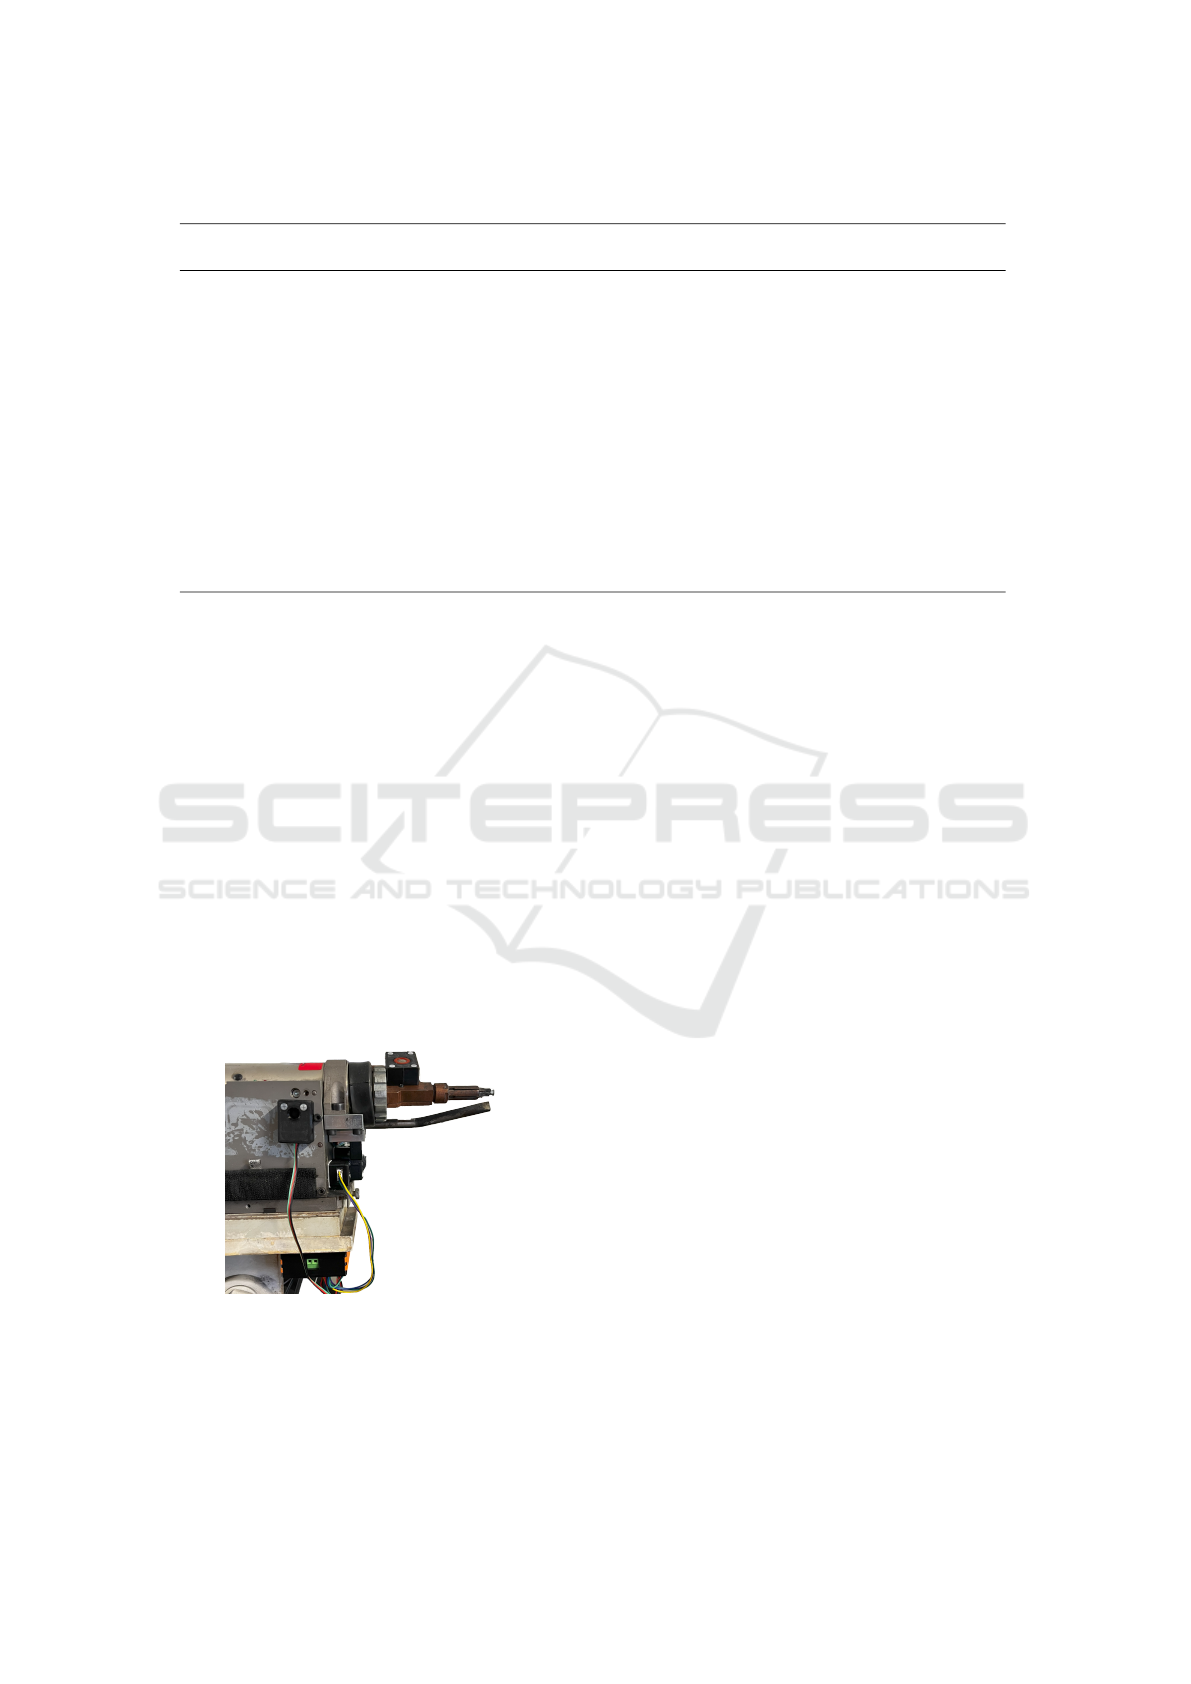
Table 1: Relevant parameters to monitor during the welding process.
Category Variables
Electric Quantities Voltage, Current (peak, effective, and average), Power
Process Parameters Stud lift distance, Stud immersion length, Stud incidence angle, Process
time duration
Environmental Parameters Ambient temperature, Ambient humidity, Air purity
Other Factors Temperature of materials (stud and plate), Temperature of machinery
(head and feeder), Cleanliness of the equipment (head, stud, and plate),
Current/Speed of the linear actuator, Cooling rate of welding
Discarded Factors Factors dependent on the materials of the studs and plates (composition,
purity, dimensions, etc.)
ative humidity (RH) between 20% and 80% with
an accuracy of 3%.
• LM35: a temperature sensor, capable of measur-
ing temperatures between 0ºC and 100ºC. Utilised
to measure the ambient temperature during the
welding.
• VL53L0X: a time-of-flight (ToF) high-precision
distance sensor, capable of measuring distances
between 30mm and 2000mm with an accuracy of
3%. Utilised for measuring the plate distance.
• YDLIDAR GS2: a linear array solid Light Detec-
tion and Ranging (LiDAR) sensor with a FoV of
100º capable of measuring distance in a range be-
tween 25mm and 300mm with an accuracy of 8%
for distances superior than 200mm. Utilised to
measure the plate inclination angle, correspond-
ing to the stud incidence angle.
Figure 5: Welding system sensorisation.
Figure 5 illustrates the installation of sensors in
the Factory Twin. The CO sensor is mounted on the
top, the temperature sensor on the side, and the dis-
tance and plate inclination sensors are positioned at
the front. The sensors not visible in the image, such
as the humidity sensor and the current sensor attached
to the welding system’s ground cable, are installed on
the opposite side.
To acquire the data from the sensors, two Arduino
Nano boards were used: one exclusively dedicated to
capturing high-frequency data from the current sen-
sor, and the other for the remaining sensors.
4.2 Data Acquisition System
To store the collected data in an organized and struc-
tured manner, a data acquisition system was devel-
oped. The two previously mentioned Arduino Nano
boards were connected to a Raspberry Pi 5 (RPI5),
running a Flask-based data acquisition application de-
veloped using Python, HTML, JavaScript, and CSS.
Because the parameters measured and displayed by
the welding system itself could not be directly ac-
cessed, but were still considered relevant, the RPI5
was also connected to a camera to capture images of
the values shown on the DCE1500 display. Addition-
ally, a RPI touch display was used to provide a graph-
ical user interface (GUI).
The GUI, illustrated in Figure 6, allows users to
start and stop the sensor data recording at appropri-
ate moments during the welding tests, while track-
ing the weld identifiers (IDs) to maintain organized
records. During recording, real-time values from the
Arduino boards and the camera are displayed, allow-
ing users to confirm that the data is being captured
as expected. After recording, the user should capture
an image of the DCE1500 display using the system.
Once both sensor data and the image are collected,
they are automatically saved: the sensor data as a
comma-separated values (CSV) file and the image as
ICINCO 2025 - 22nd International Conference on Informatics in Control, Automation and Robotics
254
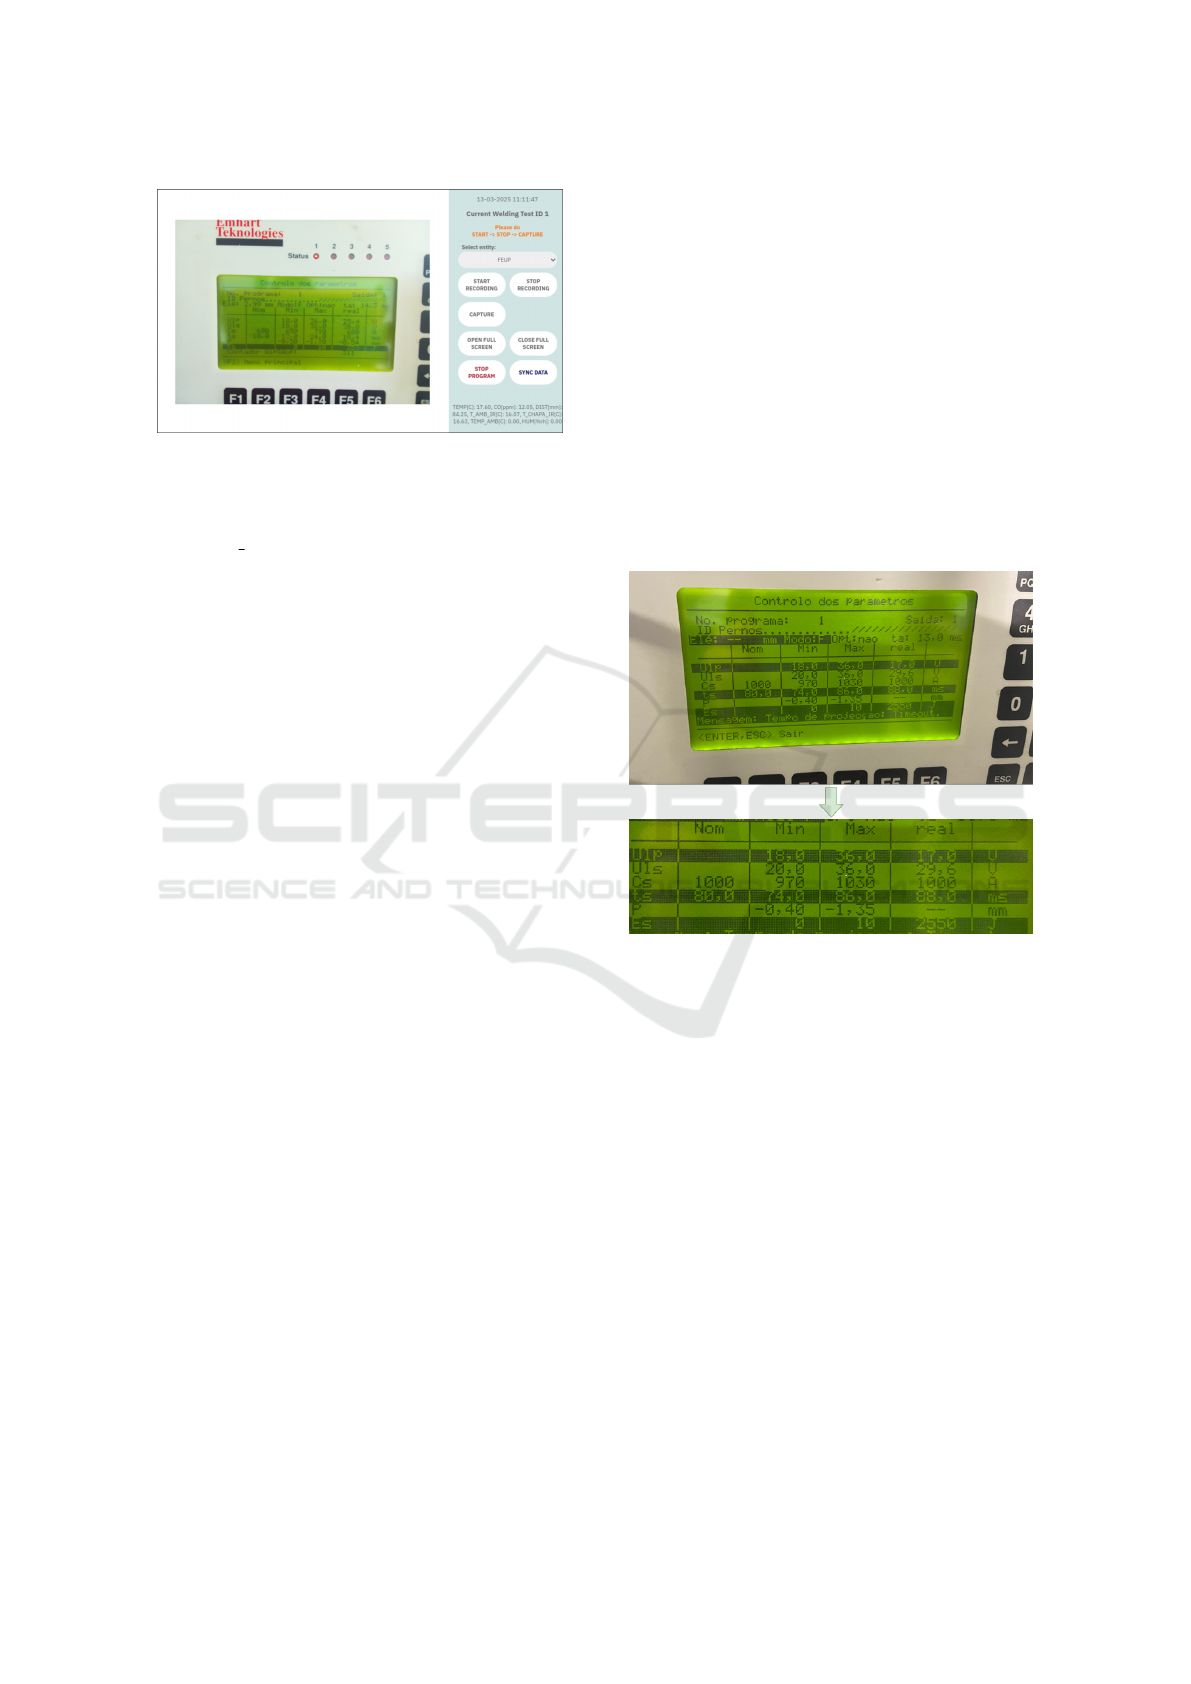
Figure 6: Data acquisition application GUI.
a separate file. Both files are named using the record-
ing date and the corresponding welding test ID (e.g.,
“20250512 4”), ensuring consistent organization and
easy identification. Finally, the system is integrated
with a cloud-based database, allowing remote access
to all the collected data.
4.3 Automatic Parameter Extraction
To extract the process parameters from the collected
images of the DCE1500 display, an automatic two-
stage procedure was developed.
In the first stage, image processing is performed
mainly by a YOLOv11 neural network trained to seg-
ment the display, isolating the relevant foreground
while filtering out the background. Morphologi-
cal operations, specifically a closing followed by an
opening, are applied to clean the segmentation mask.
This mask is then subjected to perspective correction
in order to standardise the output, and finally, the re-
gion of interest (ROI) is reduced to only the table con-
taining the process parameters.
In the second stage, optical character recogni-
tion (OCR) was necessary to extract the aforemen-
tioned parameters. Several OCR tools, including
pytesseract, EasyOCR, and Keras-OCR, were tested
but all proved ineffective. Consequently, a second
YOLOv11 model was trained to recognise and ex-
tract the characters from the ROI. This OCR model
was pre-trained using a publicly available dataset in
Roboflow (Phil, 2023). Once the characters were
identified, their values were extracted based on the
known positions of each parameter within the table.
5 RESULTS
The external system sensorisation behaved as ex-
pected, even under the demanding conditions of the
welding environment, which included sudden temper-
ature variations, sparks, smoke, and electromagnetic
noise. Despite such challenges, it was possible to cap-
ture data without interruptions or difficulties.
To explore the correlation between the monitored
parameters and final weld quality and to generate a
diverse dataset, several experiments were conducted
under varying conditions. Using the Factory Twin,
process variables such as weld current and duration
were adjusted. In total, 46 different combinations of
current and process duration were tested, resulting in
approximately 200 experimental welds. During each
experiment, both sensor data and process parameters
were recorded.
With the recording data available, the perfor-
mance of the automatic parameter extraction algo-
rithm was evaluated in two stages: (1) initial segmen-
tation of the display, and (2) character recognition.
Figure 7: Example of the display segmentation.
For the first stage, 15% of the dataset was reserved
as test data. The results were promising, with the
model achieving a mean Average Precision at Inter-
section over Union (IoU) 0.50 to 0.95 (mAP50-95) of
99.8%. Figure 7 illustrates this step with an example
showing both the input image and the resulting seg-
mented ROI.
For the second stage of the algorithm, 10% of the
dataset was used for evaluation, with each image con-
taining approximately 70 characters. The results were
less favourable, with a mAP50-95 of 67.7%. Never-
theless, the practical results were still acceptable, with
most errors being related to the recognition of the mi-
nus (“-”) character. Figures 8 and 9 show two exam-
ples of the character recognition algorithm’s output.
Having now both sensor data and process control
parameters available in a suitable format, a prelim-
inary data analysis was conducted. Since the final
weld quality classifications were not yet available, the
focus of this analysis was to verify whether the vari-
Real-Time Weld Quality Prediction in Automated Stud Welding: A Data-Driven Approach
255
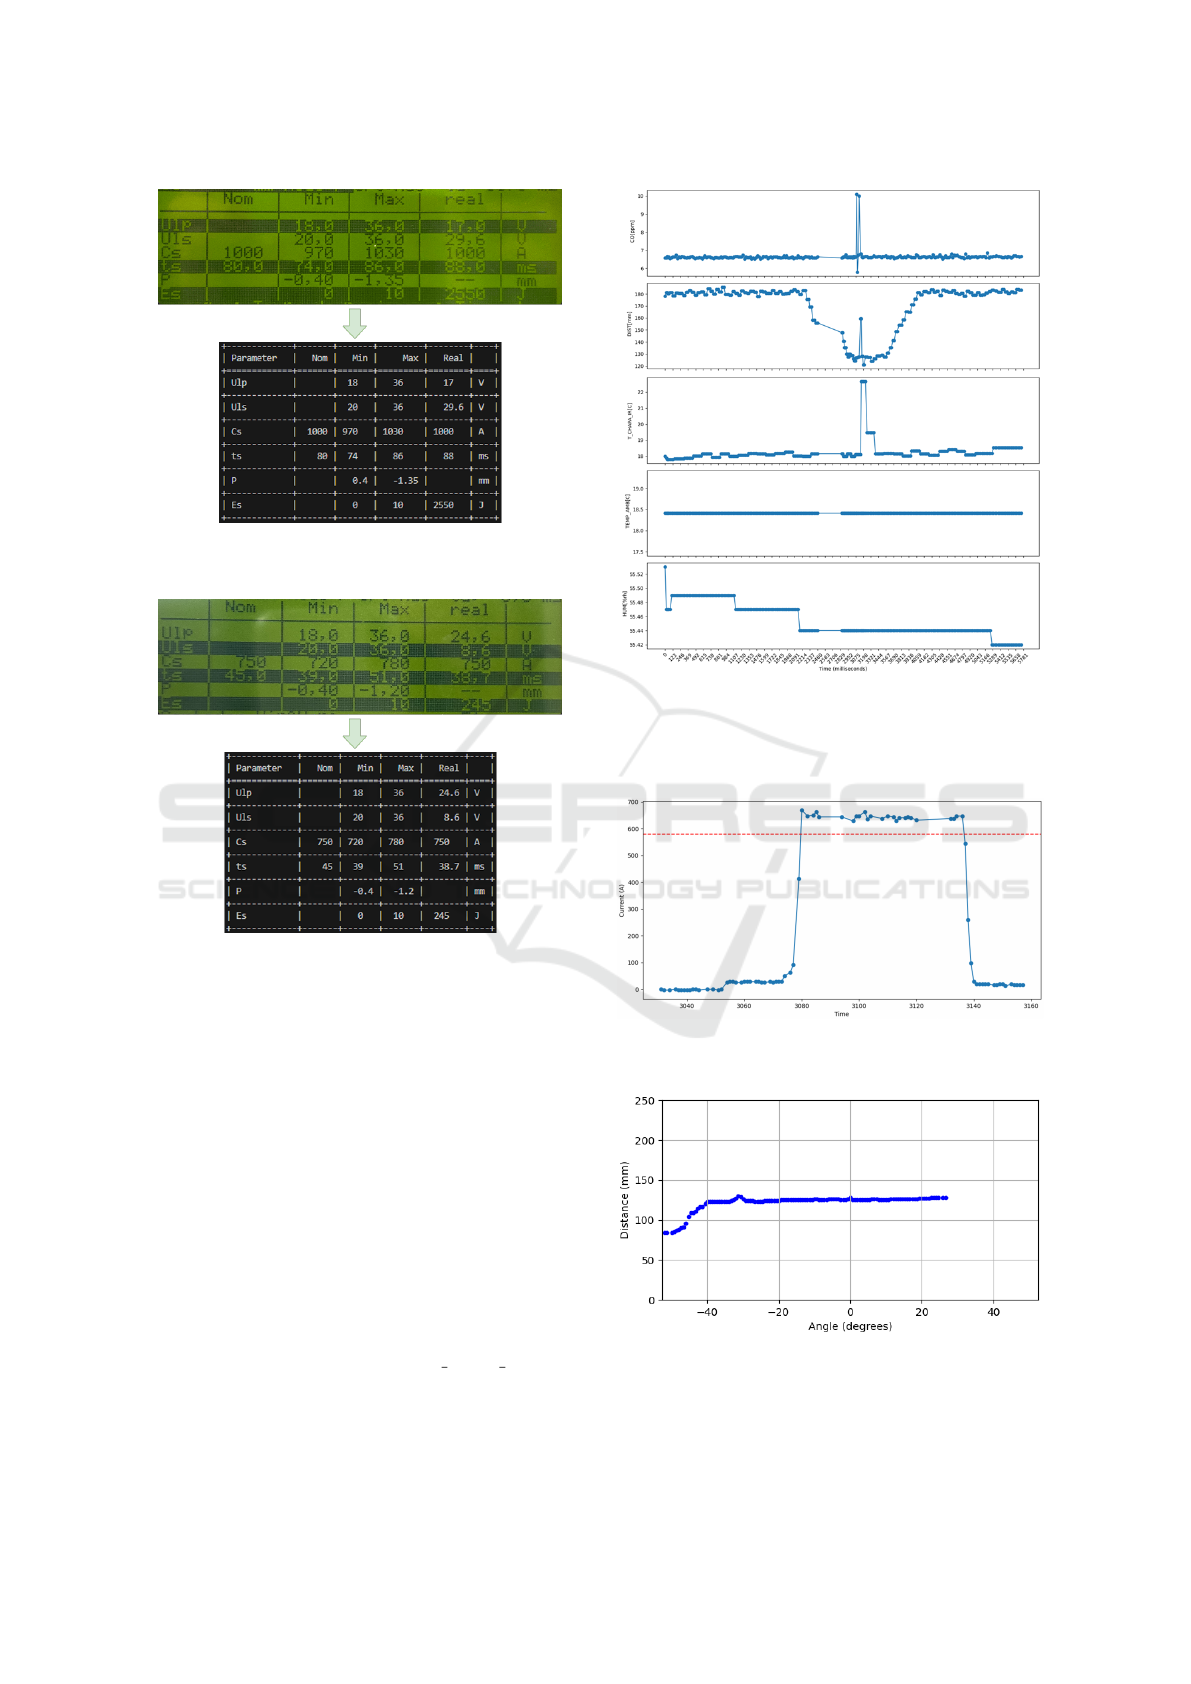
Figure 8: Character recognition output from the OCR algo-
rithm - Example 1.
Figure 9: Character recognition output from the OCR algo-
rithm - Example 2.
ables showed the expected behaviours. To that end,
plots were generated using Python libraries such as
matplotlib.pyplot, pandas, and numpy, illustrat-
ing how sensor readings varied over time.
Figures 10, 11, and 12 illustrate the plots gener-
ated from the collected data for one test iteration. As
previously mentioned, the variables monitored during
this preliminary analysis were selected based on find-
ings from the literature (Table 1).
In Figure 10, it can be observed that during the lift
and plunge moments of the welding process (see Fig-
ure 1b and 1c), indicated by a drop in the DIST[mm]
value, which represents the distance between the
welding gun and the welding surface, there is a corre-
sponding spike in both CO concentration (CO[ppm])
and the welding plate temperature (T CHAPA IR[C]).
These variations are expected: the momentary in-
crease in CO concentration likely indicates gas emis-
sions caused by the welding arc, possibly due to the
Figure 10: Variation of CO concentration, welding surface
distance, welding surface temperature, ambient tempera-
ture, and ambient humidity, respectively, throughout the
welding cycle.
Figure 11: Approximation of the weld current near the peak
during the welding cycle.
Figure 12: Visualization of point cloud data captured during
the welding cycle.
combustion of surface materials. Similarly, the quick
ICINCO 2025 - 22nd International Conference on Informatics in Control, Automation and Robotics
256

rise and drop in the welding plate temperature reflects
the material’s heating during the arc, followed by a
quick cooling once the arc is extinguished.
The room ambient temperature (TEMP AMB[C])
stays constant during the welding process, confirm-
ing that the rise in the welding plate temperature is a
local effect and not due to a change in the overall en-
vironment. Humidity (HUM[%]) also shows very little
variation, specifically around 0.1 percentage points,
which is negligible considering the characteristics of
the sensor.
The peak current plot in Figure 11 shows the same
waveform shape as expected from the reference in
Figure 4. The red line represents the nominal current
value reported by the control unit during the weld.
The close match between the measured and expected
values shows that the sensor can accurately capture
the welding current.
Finally, the point cloud visualisation in Figure 12
shows the data collected by the LiDAR sensor. As
mentioned in Section 4, this sensor was mainly used
to measure the inclination of the plate, which corre-
sponds to the stud incidence angle. For most angles
measured, the distance values remain nearly constant,
which indicates that the welding plate is flat and par-
allel to the welding gun. From the conducted exper-
iments, it was observed that when the plate was not
parallel or not flat, the resulting welds were visibly of
poor quality or even broken. Therefore, this suggests
that plate inclination and surface flatness are relevant
parameters for detecting and predicting poor quality
welds.
Based on this example and the analysis of data
from additional test iterations, it can be concluded that
the collected sensor data exhibits the expected pat-
terns. This confirms that the selected variables are
suitable for characterizing the welding process. Fur-
thermore, these results validate the sensor setup and
establish a foundation for the development of future
models to predict weld quality.
6 CONCLUSIONS AND FUTURE
WORK
During automated SW processes, particularly in au-
tomotive assembly lines, low-quality welds can not
only compromise the quality of the final product but
also cause production delays due to the need for man-
ual rework. Real-time weld quality prediction sys-
tems can help identify potential defects early in the
assembly process, allowing operators to take correc-
tive actions immediately and mitigate these issues.
This paper presents the first development stage of
an AI-based system for real-time weld quality assess-
ment in an automated SW process. It focuses on the
study of the relevant variables that characterise the
welding process and their correlation with final weld
quality, as well as the welding setup sensorisation,
and the development of a data acquisition system to
build a dataset for future predictive model develop-
ment. A Flask-based application was developed as
part of the acquisition system to provide an interface
for data collection. Additionally, an automatic char-
acter recognition algorithm was developed to extract
welding parameters from images of the control unit
display, as this data could not be extracted directly.
Through a series of welding experiments, testing
with different variations of process parameters, an ini-
tial dataset of approximately 200 samples was gener-
ated. The implemented sensors performed well under
the challenging welding conditions, and the automatic
parameter extraction algorithm showed promising re-
sults. The preliminary data analysis confirmed the ex-
pected trends and variations in the recorded parame-
ters.
Overall, these initial results show that the system
was able to effectively capture data from the weld-
ing process, enabling the development of the predic-
tive model. Future work will focus on improving the
parameter extraction algorithm and performing weld
quality classifications on the experimental samples to
generate labelled data to train a supervised quality
prediction model.
ACKNOWLEDGEMENTS
This work was financially supported by PPS 14:
Quality control predictive system for soldering from
Agenda GreenAuto: Green Innovation for the Auto-
motive Industry, no. C644867037-00000013, invest-
ment project no. 54, from the Incentive System to
Mobilising Agendas for Business Innovation, funded
by the Recovery and Resilience Plan and by European
Funds NextGeneration EU.
REFERENCES
Agenda GreenAuto (2021). Agenda greenauto: Green in-
novation for the automotive industry. https://www.
agendagreenauto.pt/. Accessed: 2025-05-12.
Al-Sahib, N. K. A., Ameer, H. K. A., and Ibrahim, S. G. F.
(2009). Monitoring and quality control of stud weld-
ing. Al-Khwarizmi Engineering Journal, 5(1):53–70.
Chambers, H. A. (2001). Principles and practices of stud
welding. Pci, 46:46–59.
Real-Time Weld Quality Prediction in Automated Stud Welding: A Data-Driven Approach
257

Klaric, S., Kladari
´
c, I., and Kozak, D. (2010). The influ-
ence of the stud arc welding process parameters on
the weld penetration. BULETIN S¸TIINT¸IFIC, Seria C
/ SCIENTIFIC BULLETIN, Series C, XXIII(Fascicle:
Mechanics, Tribology, Machine Manufacturing Tech-
nology).
Naddaf-Sh, S., Naddaf-Sh, M.-M., Dalton, M., Ramezani,
S., Kashani, A. R., and Zargarzadeh, H. (2023).
Application of machine learning in automotive stud
weld defect classification. IEEE Sensors Journal,
23(20):25547–25556.
Phil (2023). Digits object detection dataset. https://universe.
roboflow.com/phils-workspace/digits-coi4f/dataset/3.
Accessed: 2025-07-25.
PT. Unggul Semesta. Dce control and energy source.
https://www.unggulsemesta.com/brand/tucker/
product/dce-control-and-energy-source/. Accessed:
2025-05-13.
Samardzic, I., Klaric, S., and Siewert, T. (2007). Analysis
of welding parameter distribution in stud arc welding.
Proceedings of the Conference: Welding and Materi-
als, Dubrovnik, Croatia, 1, YU.
T. Lienert, T. Siewert, S. B. V. A. (2011). Stud arc weld-
ing. In Welding Fundamentals and Processes. ASM
International.
ICINCO 2025 - 22nd International Conference on Informatics in Control, Automation and Robotics
258
