
Web-Based Crowd Detection and Emotion Analysis for Fashion Retail
Using Computer Vision
Fiorella Valencia Rivera
a
, Erik Romero Polli
b
and Efrain Bautista Ubillus
c
Faculty of Engineering, Peruvian University of Applied Sciences, Lima, Peru
Keywords:
Computer Vision, Crowd Detection, Emotion Analysis, Fashion Retail, Heat Map Visualization,
Convolutional Neural Networks (CNN), YOLO Algorithm, Customer Behavior Analysis, Retail
Analytics, Facial Expression Recognition.
Abstract:
This study proposes a web-based solution to address the difficulty fashion retail stores face in obtaining ac-
curate information on crowding and their customers’ emotional states. Using computer vision techniques, the
application leverages the YOLO algorithm for people detection and convolutional neural networks (CNN) for
emotion classification. Integrating this data provides retailers with strategic insights to optimize space layout,
improve resource allocation, and adjust their marketing strategies, allowing managers to make decisions based
on objective data. The study emphasizes ethical considerations, including data anonymization and secure stor-
age, and highlights limitations and future research directions, such as real-world testing and collaboration with
retailers for contextually accurate data collection. The system was validated in a simulated environment that
replicated the operating conditions of a retail store, allowing an initial evaluation of its performance.
1 INTRODUCTION
In the competitive fashion retail environment, identi-
fying and analyzing customer crowding and emotions
is crucial for improving experience and sales. Per-
ceived crowding can trigger stress or excitement, af-
fecting purchasing behavior and store image (Kelle-
her, 2019; Fiedler, 1967). However, limited technol-
ogy often prevents companies from spotting key be-
havioral patterns that could optimize product place-
ment, shelf layout and marketing (Babar et al., 2023).
Advanced computer vision has shown promise in
speeding up and refining data collection, enabling
faster responses to market needs (Szeliski, 2022).
Properly managing emotions in busy settings is linked
to customer satisfaction, retention and increased rev-
enue (Mittal et al., 2023). This challenge is espe-
cially pressing for SMEs, which lack the resources
and expertise for data-driven strategies and may fall
behind larger competitors (Grewal et al., 2003; Narvi-
las et al., 2022).
We propose a web application that uses computer
vision to capture customer movements and emotions,
helping fashion retailers make informed decisions on
marketing and in-store resource allocation. Imple-
a
https://orcid.org/0009-0001-6100-2910
b
https://orcid.org/0009-0004-7304-2030
c
https://orcid.org/0000-0002-8188-4690
menting this requires selecting and tuning algorithms
such as OpenCV for image processing, YOLO for
face and body detection, and CNNs for emotion clas-
sification.
Previous approaches often focused on foot traffic
or audio cues, missing the full picture of visual and
emotional data (Batch et al., 2023; Guo et al., 2016).
Even deep learning methods that count people usually
overlook emotions (J
¨
ahne et al., 1999). Our solution
unites behavior and emotion analysis, offering SMEs
deeper insights by combining movement tracking, in-
teraction mapping and emotion recognition.
Key components include:
• OpenCV and YOLO for real-time face/body de-
tection.
• CNN-based emotion classification to gauge cus-
tomer responses.
• Heat maps to highlight high-traffic zones, guiding
layout and product placement.
Challenges involve ensuring high-quality video
feeds and mitigating factors like lighting and camera
angles that can impact detection accuracy.
This paper makes three contributions:
1. A web application integrating behavior and emo-
tion analysis for fashion retail.
2. Implementation of CNN-based emotion recogni-
tion to inform marketing and enhance satisfaction.
366
Valencia Rivera, F., Romero Polli, E. and Bautista Ubillus, E.
Web-Based Crowd Detection and Emotion Analysis for Fashion Retail Using Computer Vision.
DOI: 10.5220/0013711300003985
Paper published under CC license (CC BY-NC-ND 4.0)
In Proceedings of the 21st International Conference on Web Information Systems and Technologies (WEBIST 2025), pages 366-373
ISBN: 978-989-758-772-6; ISSN: 2184-3252
Proceedings Copyright © 2025 by SCITEPRESS – Science and Technology Publications, Lda.

3. Heat map visualizations for optimizing store lay-
out based on customer flow.
The rest of the paper is organized as follows. Sec-
tion II reviews related work. Section III covers project
context and methodology. Section IV describes ex-
periments and validation. Finally, Section V presents
conclusions and future directions.
2 RELATED WORKS
This chapter reviews existing solutions for crowd de-
tection and emotion analysis via a systematic liter-
ature review using the methodology from (Kitchen-
ham and Charters, 2007). The review addressed four
research questions: facial recognition methods (Q1),
crowd analysis techniques (Q2), computer vision for
emotion recognition (Q3), and customer crowding de-
tection (Q4). SCOPUS was queried with Boolean
terms like ”computer vision,” ”crowd analysis,” and
”heatmaps,” yielding 746 candidate articles. After
applying inclusion/exclusion criteria (quartile range
Q1/Q2, language, recency, relevance), six recent stud-
ies (2021–2024) were selected.
In (Mayuri et al., 2021), uxSense supports user ex-
perience evaluation through video/audio analysis us-
ing computer vision and machine learning, extracting
behavioral features and enabling emotion classifica-
tion. Unlike this system, our proposal specifically tar-
gets customer crowding and emotion analysis in fash-
ion retail using OpenCV/YOLO-generated heatmaps.
In (Njanda et al., 2024), people counting em-
ploys IR-UWB radar sensors and machine learning
for privacy-preserving occupancy estimation. While
effective for counting, it lacks emotion/behavioral in-
sights for retail studies. Our work overcomes this by
integrating emotion detection and crowding analysis
via heatmaps and facial recognition.
In (Cao et al., 2024), CrowdUNet uses
segmentation-assisted U-Net architecture for
high-density crowd counting, addressing occlusion
and perspective distortion. However, it focuses
solely on counting without emotion analysis. Our
approach extends this by combining density estima-
tion with facial recognition and heatmaps to capture
behavioral-emotional patterns in retail.
In (Babar et al., 2023), a survey categorizes deep
learning methods for crowd counting, emphasizing
regression-based density estimation. It lacks emo-
tional analysis and behavioral insights. Our pro-
posal integrates counting with facial recognition and
heatmaps to analyze both emotions and spatial behav-
ior in fashion retail.
In (Nethravathi et al., 2022), a facial expression
system uses OpenCV/CNN to classify emotions into
retail feedback categories (”Satisfied,” ”Not Satis-
fied,” ”Neutral”). It ignores spatial customer move-
ment. Our work bridges this gap by merging emotion
recognition with heatmap generation for comprehen-
sive density-emotion analysis in retail spaces.
In (Ganesan, 2023), real-time customer satisfac-
tion analysis employs cascaded CNNs for head pose
and expression recognition. While efficient for inter-
est quantification, it neglects crowd movement anal-
ysis. Our solution enhances this by incorporating
heatmaps to track spatial distribution and customer
flow in fashion stores.
Although outside our systematic review, (Sadik
et al., 2022) presents a real-time crowd system us-
ing YOLO for occupancy monitoring via CCTV. It fo-
cuses exclusively on counting without emotion anal-
ysis, limiting retail optimization insights. Our ap-
proach provides holistic behavioral understanding by
integrating emotion recognition with heatmap visual-
ization for fashion retail.
Table 1: Comparison of Related Works.
Work Emotion Analysis Crowd/Body Tracking Heatmap
Mayuri et al., 2021 Yes No No
Njanda et al., 2024 No Yes No
Cao et al., 2024 No Yes No
Babar et al., 2023 No Yes No
Nethravathi et al., 2022 Yes No No
Ganesan, 2023 Yes No No
Sadik et al., 2022 No Yes No
Our approach Yes Yes Yes
3 BACKGROUND
Definition 1 (Deep Learning): Deep learning, a sub-
field of artificial intelligence, develops neural network
models for data-driven decisions in complex datasets
(Kelleher, 2019). It encompasses four primary cate-
gories: Convolutional Neural Networks (CNNs), Re-
stricted Boltzmann Machines (RBMs), Autoencoders,
and Sparse Coding (Organisation for Economic Co-
operation and Development (OECD), 2023).
Definition 2 (Convolutional Neural Networks -
CNNs): CNNs are deep learning models with
strongly trained layers, widely used in computer vi-
sion. They consist of three core components: con-
volutional layers for feature extraction, pooling lay-
ers for dimensionality reduction, and fully connected
layers for classification (Lecun et al., 1998; Organi-
sation for Economic Co-operation and Development
(OECD), 2023).
Definition 3 (Computer Vision): Computer vision
employs techniques to acquire, process, and interpret
Web-Based Crowd Detection and Emotion Analysis for Fashion Retail Using Computer Vision
367

Figure 1: Flowchart.
data from non-human perceptible dimensions, aim-
ing to reconstruct real-world properties like lighting,
shapes, and color distribution (Szeliski, 2022; J
¨
ahne
et al., 1999).
Definition 4 (Object Detection): As a computer vi-
sion task, object detection classifies objects into spe-
cific categories. It utilizes one-stage detectors (sin-
gle neural network pass) or two-stage detectors (e.g.,
Faster R-CNN, which first identifies regions of inter-
est then classifies them) (J
¨
ahne et al., 1999; Yu et al.,
2022).
Definition 5 (Image Processing for Analysis and
Recognition): This field manipulates digital images
to extract features through operations like noise re-
duction, segmentation, and edge/contour detection.
These processed features enable machine learning in-
puts for recognition and analysis (Yu et al., 2022).
Definition 6 (Body Tracking): Body tracking de-
tects and monitors human bodies across video frames
using techniques like region proposal networks and
CNNs. Frameworks such as SORT and NOMT ad-
dress multi-person tracking challenges in dynamic en-
vironments (Nethravathi et al., 2022; Yu et al., 2022).
Definition 7 (Heatmap): Heatmaps visualize data
density/intensity via color gradients, typically gener-
ated using Gaussian kernels centered on key points.
Intensity indicates key point likelihood, with Kernel
Density Estimation (KDE) and interpolation creat-
ing continuous visualizations from local maxima (Yu
et al., 2022; Taqu
´
ıa-Guti
´
errez, 2017).
4 CONTRIBUTIONS
4.1 Method
This research develops a system for customer crowd-
ing and emotion analysis in fashion retail using com-
puter vision and machine learning, employing the fol-
lowing multi-stage methodology:
Data Acquisition.
Video data was collected from: (1) Simulated
retail store footage (1080p/30fps) captured via cell-
phone camera with seven volunteers (3 women, 4
men) acting as customers, and (2) iStock commercial
videos depicting real retail environments with varying
densities and lighting conditions to enhance dataset
diversity.
Data Preprocessing.
Videos are segmented into frames, with back-
ground subtraction, noise reduction, and histogram
equalization applied to enhance customer silhouettes
and facial features for accurate analysis.
Pose Estimation and Feature Extraction.
Crowd Analysis: PyTorch and YOLOv8 extract
2D skeletal joint coordinates for body tracking and
heatmap generation. Emotion Recognition: Pre-
trained FER+ CNN model classifies facial expres-
sions into six emotions (happy, neutral, sad, fear, an-
gry, surprise) using SoftMax probabilities.
System Output.
Crowd Analysis Visualization: Movement data
generates heatmaps overlaid on store layouts to iden-
tify high-traffic zones. Emotion Recognition Out-
put: Aggregated facial emotion predictions determine
area-specific emotional climates.
Ethical Considerations.
Data anonymization (no identity linkage), en-
crypted storage with access controls, and transparent
customer signage with opt-out options ensure privacy
compliance despite no formal ethics approval require-
ment for simulated data.
The non-real-time nature enables computationally
intensive models for enhanced analysis accuracy.
Application Overview.
Figure 1 illustrates the architecture: (1) Angular
web interface uploads videos; (2) API manages data
flow between frontend, backend, and database; (3)
OpenCV handles preprocessing; (4) Integrated mod-
ules perform crowd/emotion analysis; (5) Results ex-
port as PNG heatmaps and CSV emotion data.
5 EXPERIMENTS
This section validates the feasibility and accuracy of
our core contribution: integrating emotion analysis,
crowd detection, and heatmap visualization within a
unified web platform for fashion retail. Unlike prior
isolated approaches (focusing solely on crowd count-
ing or emotion recognition), our experiments evalu-
ate the synergistic performance of all three compo-
nents in generating comprehensive customer behav-
ior insights. Using controlled simulations and diverse
video datasets, we demonstrate the system’s ability
to simultaneously detect customer presence, analyze
emotions, and visualize spatial patterns—providing
WEBIST 2025 - 21st International Conference on Web Information Systems and Technologies
368

holistic retail intelligence for store layout optimiza-
tion, resource allocation, and targeted marketing
strategies.
5.1 Experimental Protocol
5.1.1 System Configuration
Experiments ran on a high-performance workstation
with:
• CPU: Intel Core i7 (10th Gen, 8 cores, 2.60 GHz)
• RAM: 16 GB DDR4
• GPU: NVIDIA GeForce RTX with CUDA 12.3
• OS: Windows 11 LTSC
• Software: Python 3.10 with PyTorch, OpenCV,
YOLOv8, FER, Flask
5.1.2 Dataset Overview
Videos from online repositories (promotional/staged
retail footage) and a custom-simulated clothing
store environment. All sequences standardized at
1920×1080 resolution and 60 fps for consistent anal-
ysis.
5.1.3 Processing Workflow
Frame-by-frame extraction of pose and facial emotion
features via vision models, including automated seg-
mentation, filtering, and detection pipelines.
5.1.4 Experiment Execution
Evaluated system performance under:
• Crowd Density: Low, moderate, and high density
scenarios
• Lighting Variation: Natural, mixed, and artifi-
cial illumination
• Camera Angle/Occlusion: Front-facing, over-
head, and obstructed views
5.2 Results
5.2.1 Emotion Detection and Confidence
Metrics Analysis
The emotion detection model was evaluated using av-
erage confidence and confidence variance across all
frames. “Happy” emerged as the most confidently
detected emotion, while “Fear” and “Sad” showed
higher variability, indicating environmental or expres-
sion ambiguity.
Key points:
Table 2: Average Confidence and Variance per Emotion.
Emotion Detected Average Confidence (%) Confidence Variance
Angry 38.70 64.58
Fear 45.76 107.55
Happy 76.43 419.42
Neutral 50.43 128.96
Sad 47.32 117.43
• “Happy” had the highest mean confidence, reflect-
ing strong detection of positive expressions.
• “Fear” and “Sad” exhibited greater variance, sug-
gesting inconsistent recognition under different
conditions.
• Although “Angry” showed stable confidence
(lowest variance), its overall confidence remained
low.
Table 3: Average Confidence and Variance per Detected
Emotion by Video.
Video Detected Emotion Average Confidence (%) Confidence Variance
Video 1
Angry 38.70 64.58
Fear 45.76 107.55
Happy 76.43 419.42
Neutral 50.43 128.96
Sad 47.32 117.43
Video 2
Angry 40.77 72.03
Fear 42.77 142.03
Happy 85.64 372.43
Neutral 57.17 154.02
Sad 48.01 151.94
Surprise 33.00 181.00
Video 3
Fear 33.88 10.86
Happy 92.68 165.65
Neutral 39.92 55.52
Sad 42.11 59.49
5.2.2 Performance Metrics for Facial
Recognition and Emotion Detection:
Precision, Recall and F1-Score
Facial recognition and emotion detection were further
assessed using precision, recall and F1-Score across
all videos. Facial recognition achieved high accuracy,
especially under good lighting, while emotion detec-
tion showed strong results for “Happy” but lower per-
formance on negative emotions.
Table 4: Facial Recognition Performance Metrics per
Video.
Video Precision (%) Recall (%) F1-Score (%)
Video 1 93.21 89.35 91.24
Video 2 91.45 85.78 88.51
Video 3 88.12 79.67 83.67
Average 90.93 84.93 87.81
Web-Based Crowd Detection and Emotion Analysis for Fashion Retail Using Computer Vision
369
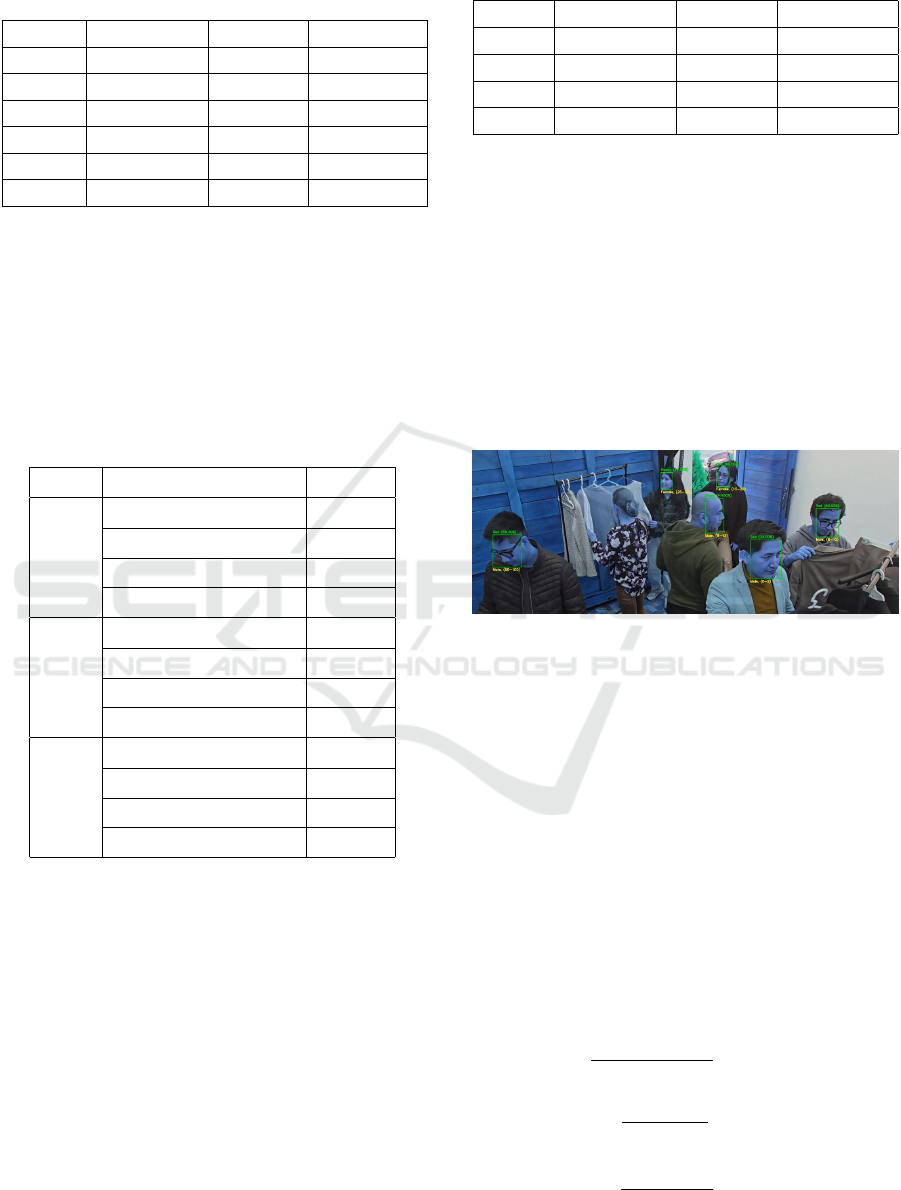
Table 5: Emotion Detection Performance Metrics per Emo-
tion across Videos.
Emotion Precision (%) Recall (%) F1-Score (%)
Angry 58.13 52.40 55.12
Fear 60.21 47.81 53.14
Happy 89.87 82.69 86.13
Neutral 72.44 65.20 68.63
Sad 61.08 55.49 58.16
Average 68.75 60.72 64.64
5.2.3 Body Tracking & Heatmap Generation
Metrics Analysis
Body tracking metrics highlighted customer flow pat-
terns and congregation hotspots. Video 3 showed the
highest activity and densest clustering, useful for op-
timizing store layout.
Table 6: Body Tracking & Heatmap Generation Metrics by
Video.
Video Metric Value
1
Overall people count 3
Activity Level 90769.3
Repetitive Motion 1094
Interpersonal Distance 137.348
2
Overall people count 5
Activity Level 113269
Repetitive Motion 622
Interpersonal Distance 268.918
3
Overall people count 4
Activity Level 183435
Repetitive Motion 1499
Interpersonal Distance 273.001
5.2.4 Body Detection Performance: Precision,
Recall and F1-Score
Person detection achieved excellent recall but varied
precision depending on background clutter. Overall
recall was strong (91.67%), with room to reduce false
positives in complex scenes.
5.2.5 Summary of Results
Across all modules, the system excels at detecting
positive emotions and achieves high recall in body
and face detection. Variability in negative emotion
recognition and occasional false positives in crowded
scenes point to areas for targeted model refinement
Table 7: Person Detection Performance Metrics per Video.
Video Precision (%) Recall (%) F1-Score (%)
Video 1 85.71 100.00 92.31
Video 2 54.54 100.00 70.56
Video 3 96.66 75.00 84.62
Average 78.97 91.67 82.50
and dataset expansion.
5.2.6 Simulation Experiment (1 Min, 60fps, 7
People)
The simulation video was recorded at 1920×1080px,
60fps, over 1 minute (3600 frames). It depicted a
mock retail environment with three sections (men’s,
neutral, women’s). Seven actors (3 women, 4 men)
entered one by one, then moved freely, mimicking a
crowded store. Approximately 2800 frames contained
one or more visible people.
Figure 2: Facial recognition of the Simulation Experiment.
Facial Recognition in Simulation. The facial
recognition module detected all seven actors in ev-
ery frame where they were visible (no false nega-
tives), but produced a spurious “floor” face detec-
tion in roughly half the frames (approximately 1800
frames). This resulted in:
TP = 7 faces/frame × 2,800 frames = 19,600 (1)
FP = 1 spurious face/frame × 1,800 frames = 1,800
(2)
FN = 0 (3)
Precision =
19,600
19,600 + 1,800
≈ 0.916 (91.6%) (4)
Recall =
19,600
19,600 + 0
= 1.0 (100%) (5)
F1-Score = 2 ×
0.916 × 1.0
0.916 + 1.0
≈ 0.956 (95.6%) (6)
WEBIST 2025 - 21st International Conference on Web Information Systems and Technologies
370
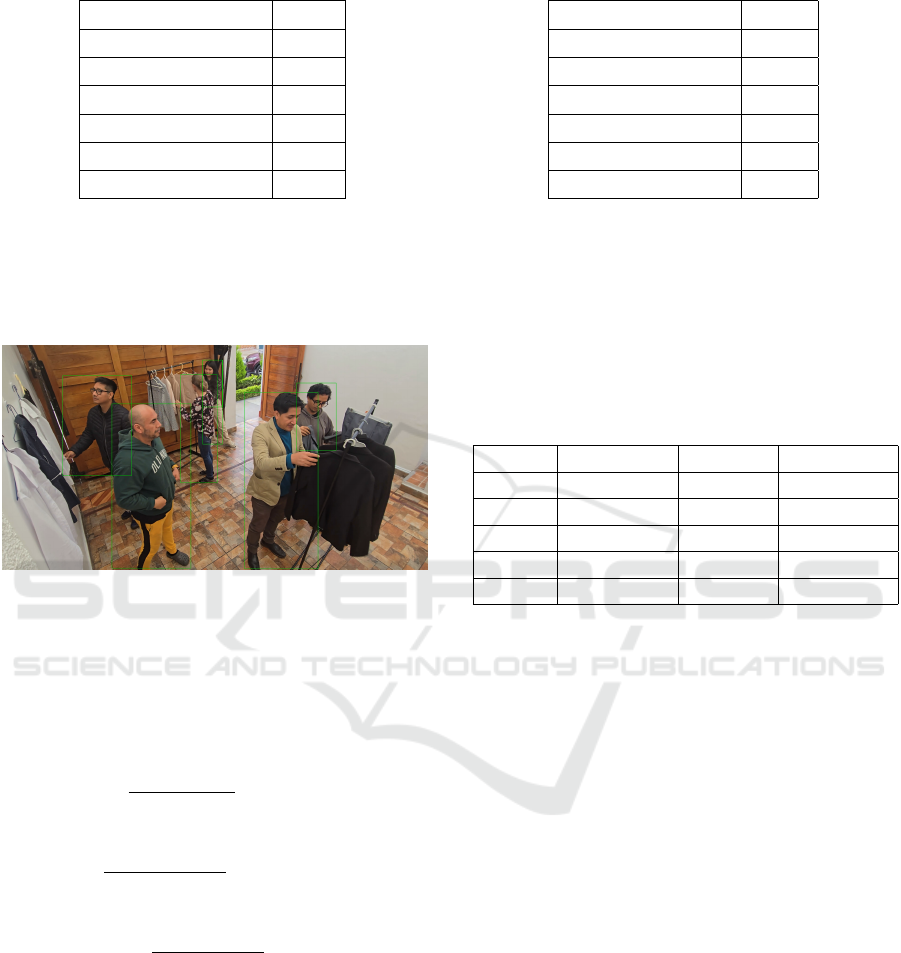
Table 8: Facial Recognition Performance on Simulation.
Metric Value
True Positives (TP) 19600
False Positives (FP) 1800
False Negatives (FN) 0
Precision (%) 91.6
Recall (%) 100.0
F1-Score (%) 95.6
Body Tracking in Simulation. The body-tracking
module detected all seven individuals in every frame
where they were present but registered a small num-
ber of false positives (100) and false negatives (1 000).
Thus:
Figure 3: Body Tracking of the Simulation Experiment.
TP = 7 faces/frame × 2,800 frames = 19,600 (7)
FP = 100, FN = 1 000 (8)
Precision =
19,600
19,600 + 100
≈ 0.995 (99.5%) (9)
Recall =
19,600
19,600 + 1,000
≈ 0.951 (95.1%) (10)
F1-Score = 2 ×
0.995 × 0.951
0.995 + 0.951
≈ 0.973 (97.3%)
(11)
Emotion Detection and Heatmap Generation in
Simulation. In the simulated environment, facial
expressions were identified for all seven actors in each
frame where they appeared, with no missed detec-
tions. However, a small number of spurious “face”
detections on background elements were filtered out
prior to emotion classification. The distribution of
emotions, from most to least prevalent, was: Sad,
Table 9: Body Tracking Performance on Simulation.
Metric Value
True Positives (TP) 19 600
False Positives (FP) 100
False Negatives (FN) 1 000
Precision (%) 99.5
Recall (%) 95.1
F1-Score (%) 97.3
Neutral, Angry, Happy. This reflects that, unlike pro-
motional or staged repository videos, actors in a re-
alistic retail setting do not frequently exhibit overtly
positive expressions. Consequently, true “Happy” ex-
pressions stand out more clearly when they do occur.
The emotion detection performance in simulation is
summarized below:
Table 10: Emotion Detection Performance Metrics per
Emotion in Simulation.
Emotion Precision (%) Recall (%) F1-Score (%)
Sad 95.00 93.00 94.00
Neutral 92.00 90.00 91.00
Angry 90.00 88.00 89.00
Happy 99.00 98.00 98.50
Average 94.00 92.25 93.12
The results indicate that detecting Sad and Neu-
tral expressions was more challenging due to their
prevalence and subtle variations, yielding F1-scores
of 94.00% and 91.00%, respectively. Angry expres-
sions achieved an F1-score of 89.00%. In contrast,
Happy expressions—being relatively rare in a non-
promotional context—were classified with very high
confidence, resulting in an F1-score of 98.50%. Over-
all, the average F1-score across all four emotions was
93.12%.
We conclude that when videos are drawn from re-
alistic retail interactions rather than staged or promo-
tional content, overtly positive (happy) expressions
appear less frequently. This skew in emotional preva-
lence makes it easier for the system to reliably detect
“Happy” when it does occur, while more neutral or
negative expressions dominate most frames.
Additionally, the following metrics were extracted
from the body-tracking data:
• Overall people count: 7
• Activity level: 3,683,636.6 (aggregate movement
intensity)
• Repetitive motion: 2,716 occurrences
• Interpersonal distance: 728.832 (mean distance
between individuals)
Web-Based Crowd Detection and Emotion Analysis for Fashion Retail Using Computer Vision
371

Figure 4: Heatmap result of the Simulation Experiment.
Discussion: The simulation test demonstrated that
our web-based application scales to seven simultane-
ously moving subjects without degradation. Despite
the persistent false-positive “floor face” in roughly
50% of the frames, facial recognition recall remained
perfect and overall classification remained robust
(F1=95.6%). Body tracking and heatmap generation
operatedn near flawlessly (F1=97.3%), confirming the
system’s reliability under high-density, multi-person
scenarios.
6 CONCLUSIONS
This work presents a web-based application for fash-
ion retail integrating crowd detection and emotion
analysis using YOLO-based body/face detection and
CNN emotion recognition. The system generates
heatmaps of customer movement and quantifies emo-
tional states. Simulated experiments with seven ac-
tors achieved strong performance: facial recogni-
tion (91.6% precision, 100% recall, 95.6% F1), body
tracking (99.5% precision, 95.1% recall, 97.3% F1),
and emotion detection (98.5% F1 for ”Happy,” 94.0%
for ”Sad,” 91.0% for ”Neutral”). Results confirm re-
liable positive emotion detection in retail contexts.
Repository video analysis revealed promotional
footage predominantly shows ”Happy” expressions,
which may not reflect genuine customer reactions.
In contrast, simulations demonstrated customers are
typically neutral or negative in authentic interac-
tions, making ”Happy” detections more significant.
Heatmaps consistently identified high-density zones
across both data sources, validating their utility for
optimizing store layouts and product placement.
Key limitations include reliance on
staged/simulated videos preventing evaluation in
uncontrolled retail environments, and the need for
further validation of environmental factors (lighting,
camera angles) in operational stores.
6.1 Lessons Learned
Simulated environments, while useful for validation,
lack the complexity of real-world retail scenarios in-
cluding spontaneous customer behavior. Negative
emotions proved challenging to detect due to sub-
tle facial expressions, indicating a need for enriched
training data.
Future work should prioritize real-world deploy-
ment with retail partners to collect authentic cus-
tomer data (with strict privacy safeguards), incorpo-
rate audio cues for deeper satisfaction insights, and
develop real-time analytics for dynamic store man-
agement. This research demonstrates the feasibility
of integrated crowd and emotion analysis for fash-
ion retail, providing objective data to drive decisions
in store layout optimization, resource allocation, and
marketing strategies. With continued development
and validation, this approach can become essential for
fashion retailers seeking to enhance customer satis-
faction and competitive advantage.
REFERENCES
Babar, M. J., Husnain, M., Missen, M. M. S., Samad, A.,
Nasir, M., and Khan, A. K. N. (2023). Crowd count-
ing and density estimation using deep network-a com-
prehensive survey. TechRxiv.
Batch, A., Ji, Y., Fan, M., Zhao, J., and Elmqvist, N.
(2023). uxsense: Supporting user experience anal-
ysis with visualization and computer vision. IEEE
Transactions on Visualization and Computer Graph-
ics, 29(5):1923–1936.
Cao, Z., Lyu, L., Qi, R., and Wang, J. (2024). Crowdunet:
Segmentation assisted u-shaped crowd counting net-
work. Neurocomputing, 601:128215.
Fiedler, F. (1967). A theory of leadership effectiveness.
Journal of the Academy of Marketing Science, pages
33–44.
Ganesan, S. (2023). Deep learning model for identification
of customers satisfaction in business. Journal of Au-
tonomous Intelligence, 7(1).
Grewal, D., Baker, J., Levy, M., and Voss, G. (2003). The
effects of wait expectations and store atmosphere eval-
uations on patronage intentions in service-intensive
retail stores. Journal of Retailing, 79(4):259–268.
Guo, Y., Liu, Y., Oerlemans, A., Lao, S., Wu, S., and Lew,
M. S. (2016). Deep learning for visual understanding:
A review. Neurocomputing, 187:27–48.
J
¨
ahne, B., Haussecker, H., and Geißler, P. (1999). Hand-
book of Computer Vision and Applications. Academic
Press.
Kelleher, J. D. (2019). Deep Learning. MIT Press Essential
Knowledge series. MIT Press, Cambridge, MA.
Kitchenham, B. and Charters, S. (2007). Guidelines for
performing systematic literature reviews in software
WEBIST 2025 - 21st International Conference on Web Information Systems and Technologies
372

engineering. EBSE Technical Report EBSE-2007-01,
Software Engineering Group, Keele University and
University of Durham.
Lecun, Y., Bottou, L., Bengio, Y., and Haffner, P. (1998).
Gradient-based learning applied to document recogni-
tion. Proceedings of the IEEE, 86(11):2278–2324.
Mayuri, K., Rao, N. V. K., Jayanthi, N., AlakanandaKasam,
T., Nalla, G., and Jaggavarapu, S. (2021). Understand-
ing customer reviews using facial expression recogni-
tion system. In 2021 5th International Conference on
Electronics, Communication and Aerospace Technol-
ogy (ICECA).
Mittal, V., Han, K., Frennea, C., Blut, M., Shaik, M., Bo-
sukonda, N., and Sridhar, S. (2023). Customer sat-
isfaction, loyalty behaviors, and firm financial perfor-
mance: what 40 years of research tells us. Marketing
Letters, 34:171–187.
Narvilas, G., Urbonas, V., and Butkevi
ˇ
ci
¯
ut
˙
e, E. (2022). Hu-
man’s behavior tracking in a store using multiple se-
curity cameras. Baltic Journal of Modern Computing,
10(3).
Nethravathi, P. S., Koti, M. S., Taramol, K. G., Anwar,
S., Babu, G., and Thinakaran, R. (2022). Real time
customer satisfaction analysis using facial expressions
and headpose estimation. International Journal of Ad-
vanced Computer Science and Applications, 13(10):–.
Njanda, A. J. N., Gbadoubissa, J. E. Z., Radoi, E., Ari,
A. A. A., Youssef, R., and Halidou, A. (2024). Peo-
ple counting using ir-uwb radar sensors and machine
learning techniques. Systems and Soft Computing,
6:200095.
Organisation for Economic Co-operation and Development
(OECD) (2023). SME and Entrepreneurship Outlook
2023. OECD Publishing.
Sadik, S., Balakrishnan V., T., R., V. M., and Stoble B.,
J. (2022). A web-based application for monitoring
crowd status in stores. Journal of Applied Informa-
tion Science, 10(1):34–38.
Szeliski, R. (2022). Computer Vision. Texts in Computer
Science. Springer.
Taqu
´
ıa-Guti
´
errez, J. A. (2017). El procesamiento de
im
´
agenes y su potencial aplicaci
´
on en empresas con
estrategia digital. Interfases, (010):11.
Yu, H., Du, C., and Yu, L. (2022). Scale-aware heatmap rep-
resentation for human pose estimation. Pattern Recog-
nition Letters, 154:1–6.
Web-Based Crowd Detection and Emotion Analysis for Fashion Retail Using Computer Vision
373
