Model Predictive Control for Crowd Navigation via Learning-Based
Trajectory Prediction
Mohamed Parvez Aslam
1
, Bojan Derajic
2,3 a
, Mohamed-Khalil Bouzidi
2,4 b
,
Sebastian Bernhard
2 c
and Jan Oliver Ringert
1 d
1
Bauhaus-Universit
¨
at Weimar, Germany
2
Continental Automotive GmbH, Germany
3
Technical University of Berlin, Germany
4
Free University of Berlin, Germany
Keywords:
Crowd Navigation, Model Predictive Control, Trajectory Prediction.
Abstract:
Safe navigation in pedestrian-rich environments remains a key challenge for autonomous robots. This work
evaluates the integration of a deep learning-based Social-Implicit (SI) pedestrian trajectory predictor within
a Model Predictive Control (MPC) framework on the physical Continental Corriere robot. Tested across
varied pedestrian densities, the SI-MPC system is compared to a traditional Constant Velocity (CV) model
in both open-loop prediction and closed-loop navigation. Results show that SI improves trajectory predic-
tion—reducing errors by up to 76% in low-density settings—and enhances safety and motion smoothness
in crowded scenes. Moreover, real-world deployment reveals discrepancies between open-loop metrics and
closed-loop performance, as the SI model yields broader, more cautious predictions. These findings empha-
size the importance of system-level evaluation and highlight the SI-MPC framework’s promise for safer, more
adaptive navigation in dynamic, human-populated environments.
1 INTRODUCTION
The rapid advancement of autonomous systems has
transformed mobile robotics, particularly in shared
environments where robots and pedestrians coex-
ist (Korbmacher and Tordeux, 2022; Golchoubian
et al., 2023). A critical challenge in this domain is
ensuring safe navigation in dynamic settings, such
as crowded sidewalks and factory floors (Wabersich
et al., 2023). Pedestrian trajectory prediction (PTP) is
central to this challenge, enabling robots to anticipate
human movements and adjust their behavior proac-
tively (Alahi et al., 2016; Salzmann et al., 2021).
Traditional heuristic- or knowledge-based models,
while interpretable, often fail to capture the complex-
ity of pedestrian behavior (Sighencea et al., 2021).
In contrast, deep learning methods—such as Social
LSTM (Alahi et al., 2016), Social GAN (Huang et al.,
2021), spatiotemporal graph models (Salzmann et al.,
a
https://orcid.org/0009-0000-6175-535X
b
https://orcid.org/0009-0009-9734-3133
c
https://orcid.org/0000-0002-7194-7539
d
https://orcid.org/0000-0002-3610-3920
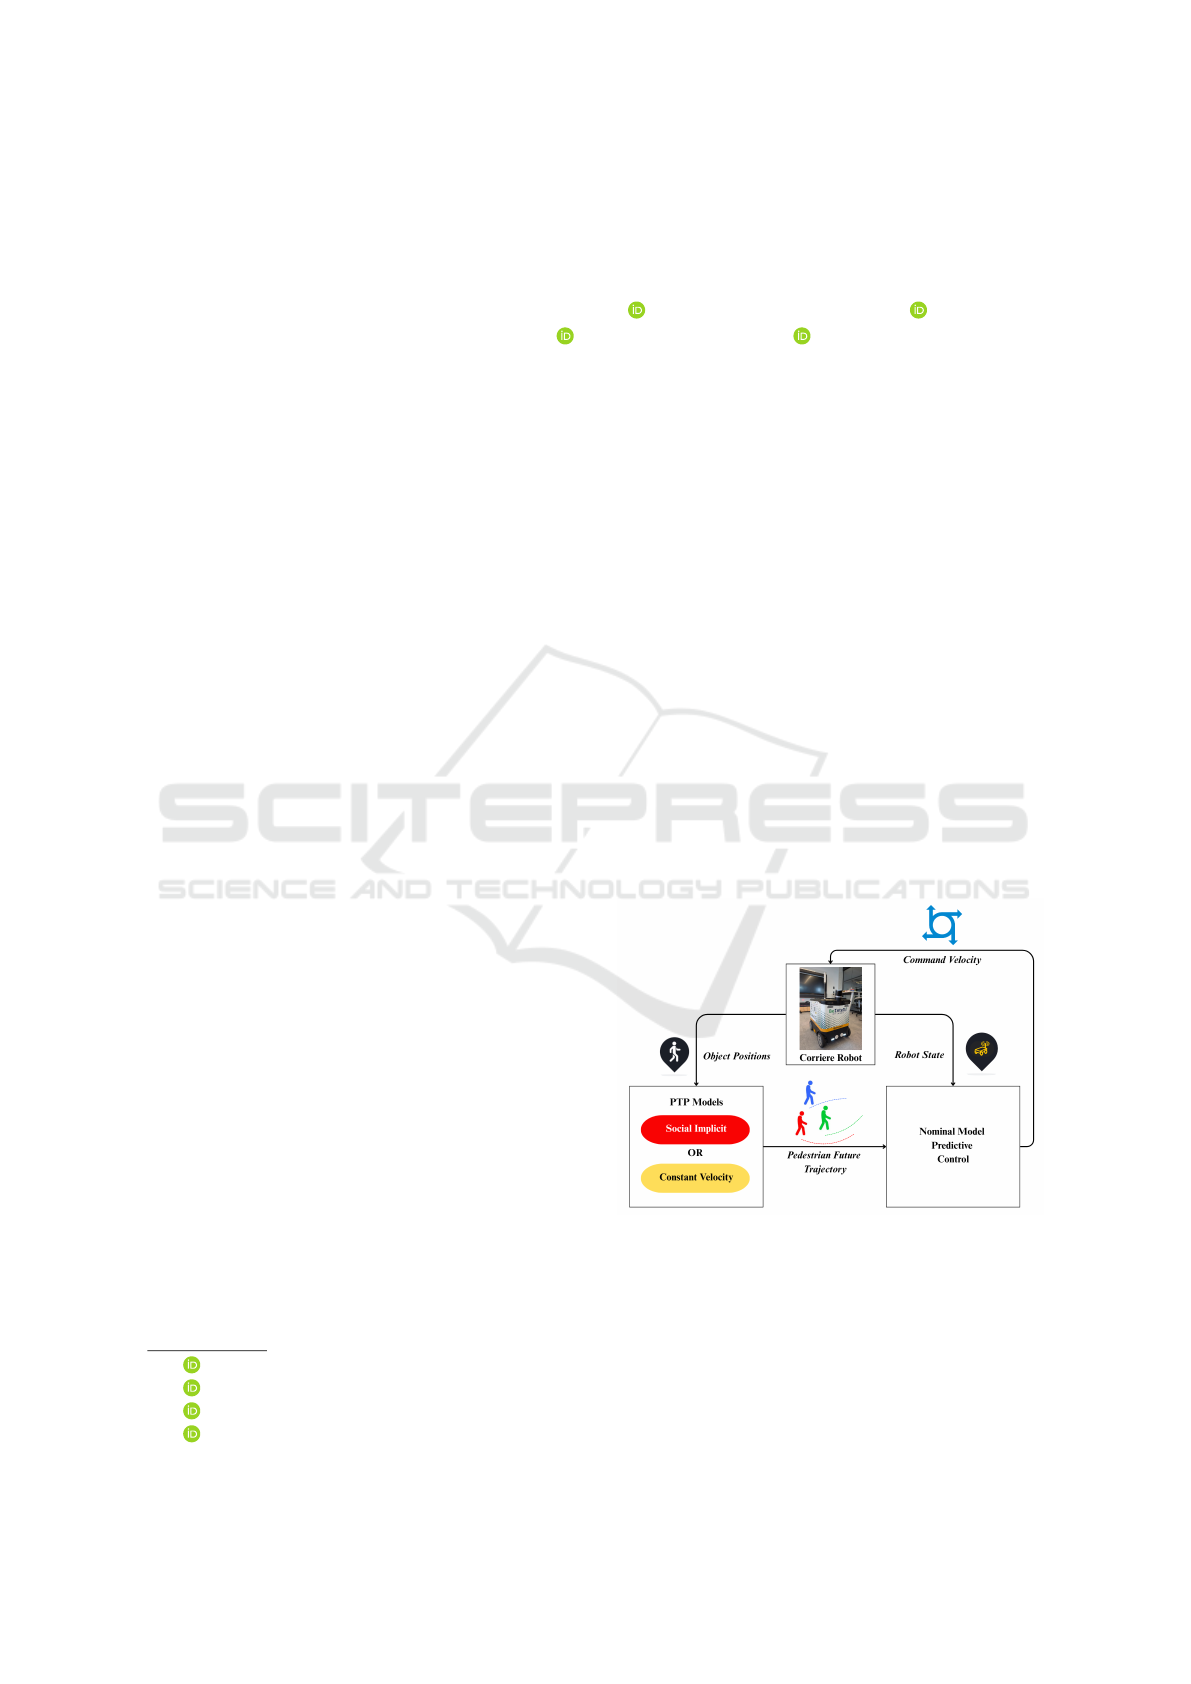
Figure 1: The architecture of an MPC-based motion plan-
ning framework with PTP module.
2021; Mohamed et al., 2020; Lian et al., 2023),
and hybrid architectures like Y-Net (Mangalam et al.,
2020) and Social-Implicit (SI) (Mohamed et al.,
2022)—leverage datasets like ETH/UCY (Pellegrini
et al., 2009) to model social interactions, generally
outperforming traditional approaches in open-loop
Aslam, M. P., Derajic, B., Bouzidi, M.-K., Bernhard, S. and Ringert, J. O.
Model Predictive Control for Crowd Navigation via Learning-Based Trajectory Prediction.
DOI: 10.5220/0013710400003982
Paper published under CC license (CC BY-NC-ND 4.0)
In Proceedings of the 22nd International Conference on Informatics in Control, Automation and Robotics (ICINCO 2025) - Volume 2, pages 251-258
ISBN: 978-989-758-770-2; ISSN: 2184-2809
Proceedings Copyright © 2025 by SCITEPRESS – Science and Technology Publications, Lda.
251

accuracy.
However, open-loop evaluation on static datasets
overlooks how these models perform in real-world,
dynamic environments, where real-time execution
and distribution shift are critical (Alahi et al., 2016).
Despite progress in learning-based trajectory pre-
diction, integration into full navigation stacks and
closed-loop evaluation remains limited.
Model Predictive Control (MPC) provides a prin-
cipled framework for dynamic navigation, relying
heavily on accurate motion predictions (Bhatt et al.,
2023). While MPC aligns well with the output of
PTP models, many systems still use simplistic predic-
tors like constant velocity (de Groot et al., 2023; Brito
et al., 2019; Vo et al., 2024) or other heuristic-based
methods (Chen et al., 2022; Piccinelli et al., 2023;
Sani et al., 2021).
Our contributions in this paper are summarized
below:
• First, we identify the criteria required for a
learning-based PTP model to be integrated within
an MPC framework and deploy it on a phys-
ical robot, as shown in Fig. 1. The result-
ing navigation behavior is evaluated by quantify-
ing improvements in both safety metrics—such
as minimum collision distance—and trajectory
smoothness, measured via acceleration rate (Fran-
cis et al., 2023).
• Second, we compare the open-loop performance
of predictors on standard datasets with their be-
havior when integrated into a full navigation
stack, thereby assessing the generalization capac-
ity of learned models.
• Third, we demonstrate through extensive experi-
ments that learning-based predictors provide tan-
gible improvements over the baseline, leading
to smoother trajectories and improved safety.
The evaluation assessment is presented, measur-
ing prediction accuracy, spread, smoothness, and
safety across varying pedestrian densities.
2 PRELIMINARIES
2.1 Problem Formulation
We consider a mobile robot navigating in a dynamic,
pedestrian-populated environment. The goal is to
generate a collision-free, dynamically feasible trajec-
tory that minimizes a cost function over a finite hori-
zon. The optimization incorporates the robot’s con-
straints and learning-based pedestrian motion predic-
tions that model human interactions. The robot adapts
its trajectory in real time to ensure safe and socially
compliant navigation.
2.2 Trajectory Prediction Metrics
To evaluate predicted trajectories, we use four key
metrics:
Average Displacement Error (ADE) measures
the mean Euclidean distance between predicted and
ground truth positions over the prediction horizon:
ADE =
1
N
N
∑
t=1
∥ ˆp
t
− p
t
∥ (1)
where ˆp
t
and p
t
are the predicted and true positions
at time t, and N is the number of future steps. Final
Displacement Error (FDE) measures the distance at
the final prediction step:
FDE = ∥ ˆp
N
− p
N
∥ (2)
where ˆp
N
and p
N
are the predicted and true final po-
sitions.
Average Mahalanobis Distance (AMD) (Mo-
hamed et al., 2022) compares predicted samples to
ground truth, accounting for the shape of the predicted
distribution:
AMD =
1
MN
M
∑
i=1
N
∑
t=1
q
( ˆp
i
t
− p
i
t
)
⊤
Σ
−1
( ˆp
i
t
− p
i
t
) (3)
where ˆp
i
t
is the i-th predicted sample at time t, p
i
t
is
the corresponding ground truth, Σ is the covariance
matrix of the predictions, M is the number of samples,
and N is the number of time steps.
Average Maximum Eigenvalue (AMV) (Mo-
hamed et al., 2022) quantifies prediction uncertainty
by measuring spread in the predicted samples:
AMV =
1
MN
M
∑
i=1
N
∑
t=1
λ
max
(Σ
i
t
) (4)
where λ
max
(Σ
i
t
) is the largest eigenvalue of the covari-
ance matrix Σ
i
t
for sample i at time t.
2.3 Robot Model
The robot’s motion is modeled using a non-holonomic
kinematic unicycle model, which is commonly used
in practice for robots with differential drive locomo-
tion. The state of the robot is defined as x = [x, y,θ]
⊤
,
where (x,y) is the position and θ is the heading angle.
The control inputs are linear and angular velocities
u = [v, ω]
⊤
. The robot dynamics is:
˙x = v cos(θ), (5a)
˙y = v sin(θ), (5b)
˙
θ = ω, (5c)
with control limits v ∈ [−1.0, 1.0] m/s and ω ∈
[−1.0,1.0] rad/s.
ICINCO 2025 - 22nd International Conference on Informatics in Control, Automation and Robotics
252

3 METHODOLOGY
This section describes how we combine the SI pre-
dictive model with an MPC local planner for mobile
robot navigation in crowds.
3.1 Social-Implicit: A Lightweight and
Distribution-Aware Pedestrian
Motion Prediction Model
The Social-Implicit model (Mohamed et al., 2022)
presents a state-of-the-art approach to pedestrian tra-
jectory prediction, addressing common limitations in
evaluation methods while offering a compact and ef-
ficient architecture suitable for real-time applications.
Traditional metrics such as Best-of-N (BoN), ADE
and FDE primarily focus on the single best trajectory
prediction, often ignoring the distributional character-
istics of the output. On the other hand, the SI model is
trained using Implicit Maximum Likelihood Estima-
tion (IMLE), which encourages the predicted trajec-
tory samples to cluster around the ground truth distri-
bution tightly. This results in improved prediction ac-
curacy and reliability, which are very important char-
acteristics for downstream modules such as the MPC
local planner.
The SI model was chosen as a motion prediction
module because it achieves a strong balance of predic-
tion accuracy (lowest ADE/FDE), computational ef-
ficiency (5.8K parameters, sub-10ms inference), and
ease of integration. SI’s simple architecture enables
direct, parallelizable use in MPC frameworks with-
out preprocessing or social pooling, while maintain-
ing robust performance even in dense crowds. Also,
smaller models are less prone to overfitting (Caruana
et al., 2000). The model used for this paper is trained
on the ETH dataset (Pellegrini et al., 2009).
In the following, we describe how the SI model’s
output is integrated with an MPC, which is necessary
for the setup. For each pedestrian i = 1, . . ., M, the
observed history h
i
is a sequence of N
h
past positions
h
i
=
(x
i
t−N
h
+1
,y
i
t−N
h
+1
),. . . , (x
i
t
,y
i
t
)
This means that for pedestrian i, their 2D positions
(x, y) at each timestep from t −N
h
+1 up to the current
time t exist
1
. Each h
i
is a matrix in R
N
h
×2
, where
each row is a (x,y) position at a past timestep. All
pedestrian histories are stacked together into a single
tensor H = [h
1
,. . . , h
M
] ∈ R
M×N
h
×2
.
1
If the full history of a pedestrian is not observed at the
current time, the first observed position is used to pad the
history sequence to the necessary length.
The model predicts, for each pedestrian i, a future
trajectory of length N:
ˆp
i
=
( ˆx
i
t+1
, ˆy
i
t+1
),. . . , ( ˆx
i
t+N
, ˆy
i
t+N
)
∈ R
N×2
This is the sequence of predicted future 2D positions
for pedestrian i.
All predicted futures are stacked as:
P = [ ˆp
1
,. . . , ˆp
M
] ∈ R
M×N×2
,
where P is a tensor containing the predicted future
trajectories for all pedestrians. We denote
P ∼
e
p
Θ
(· | H)
to indicate that
e
p
Θ
is our predictive model, parame-
terized by Θ, which defines a probability distribution
over possible future trajectories P conditioned on the
observed history H.
3.2 Model Predictive Control
The objective is to compute a collision-free and dy-
namically feasible trajectory that minimizes a cost
function over a finite prediction horizon while ac-
counting for the predicted motion of surrounding
pedestrians. Let the robot’s state at time t be denoted
by x
t
∈ R
n
, and control inputs u
t
∈ R
m
. The robot
aims to find a trajectory {x
t
}
N
t=0
by solving an opti-
mization problem of the form:
min
u
0:N−1
N−1
∑
t=0
ℓ(x
t
,u
t
) + ℓ
N
(x
N
) (6)
subject to:
x
t+1
= f (x
t
,u
t
),
x
t
∈ X
free
(t),
u
t
∈ U,
∀t ∈ {0, . . ., N − 1},
where ℓ(·) and ℓ
N
(·) denote the stage and terminal
costs, f (·) is the discretized system dynamics, U is
the set of admissible controls, and X
free
(t) represents
the obstacle-free space, which is time-varying due to
dynamic agents such as pedestrians.
We define the stage cost ℓ(x
t
,u
t
) as the following
weighted quadratic form:
ℓ(x
t
,u
t
) =
x
t
− x
goal
2
Q
+ ∥u
t
∥
2
R
(7)
where x
goal
is the goal state, Q and R are weight
matrices and || · || is the L2 norm. The terminal
cost ℓ
N
(x
N
) =
x
N
− x
goal
2
Q
T
emphasizes reaching
the goal, where Q
T
is a terminal weight matrix.
The predicted pedestrian trajectories are used to
define X
free
(t). To ensure collision avoidance, we im-
pose circular safety zones of radii r
r
(robot) and r
p
(pedestrian) in the following way:
[x
t
,y
t
] − ˆp
i
t
≥ r
r
+ r
p
, ∀i ∈ [1, M], ∀t ∈ [0, N]. (8)
Model Predictive Control for Crowd Navigation via Learning-Based Trajectory Prediction
253
4 PERFORMANCE EVALUATION
This section describes what hardware is used fol-
lowed by the test setup and analysis. It presents the
evaluation of the combined SI predictive model with
an MPC local planner for mobile robot navigation.
4.1 Hardware Setup
The Continental’s delivery robot is equipped with
a comprehensive sensor suite and high-performance
computing hardware to support real-time PTP and
MPC. Key perception sensors include a 3D LiDAR
Robosense RS-Helios 5515 for high-resolution envi-
ronmental mapping and two Intel RealSense D435
depth cameras for RGB-D data acquisition. Compu-
tation is handled by an Intel NUC11PHKi7C Mini PC
with an Intel Core i7 processor, 16GB RAM, and an
NVIDIA RTX2060 GPU, enabling the execution of
complex PTP models and MPC algorithms.
The MPC architecture is implemented using the
CasADi optimization framework and ROS for system
integration. The control loop operates at a 100 ms
sampling time, using a 4th-order Runge-Kutta dis-
cretization of the robot’s dynamics. Optimization is
performed with IPOPT NLP solver, and CasADi’s
code generation is used to compile efficient solver
code for real-time execution. This setup ensures re-
sponsive control while managing the computational
demands of integrating PTP models into dynamic
navigation tasks.
4.2 Test Environment and Layout
To evaluate the navigation performance in crowds of
the MPC planner with the learning-based predictive
model, we set up different scenarios that represent
real situations encountered during deployment. The
robot begins at a fixed central start position (SP in
Fig. 2) in all test cases. From SP, it navigates toward
one of three goal positions (GP1, GP2, GP3), repre-
senting distinct real-world destinations as shown in
Fig. 2:
• GP1 (top-left): Simulates a leftward navigation.
• GP2 (top-center): Represents a straightforward
corridor-like route.
• GP3 (top-right): Simulates a rightward naviga-
tion.
Pedestrians follow predefined routes to introduce
structured interaction scenarios. Their paths are cate-
gorized by movement direction (see Fig. 2):
• Red paths: Horizontal (left-right or right-left).
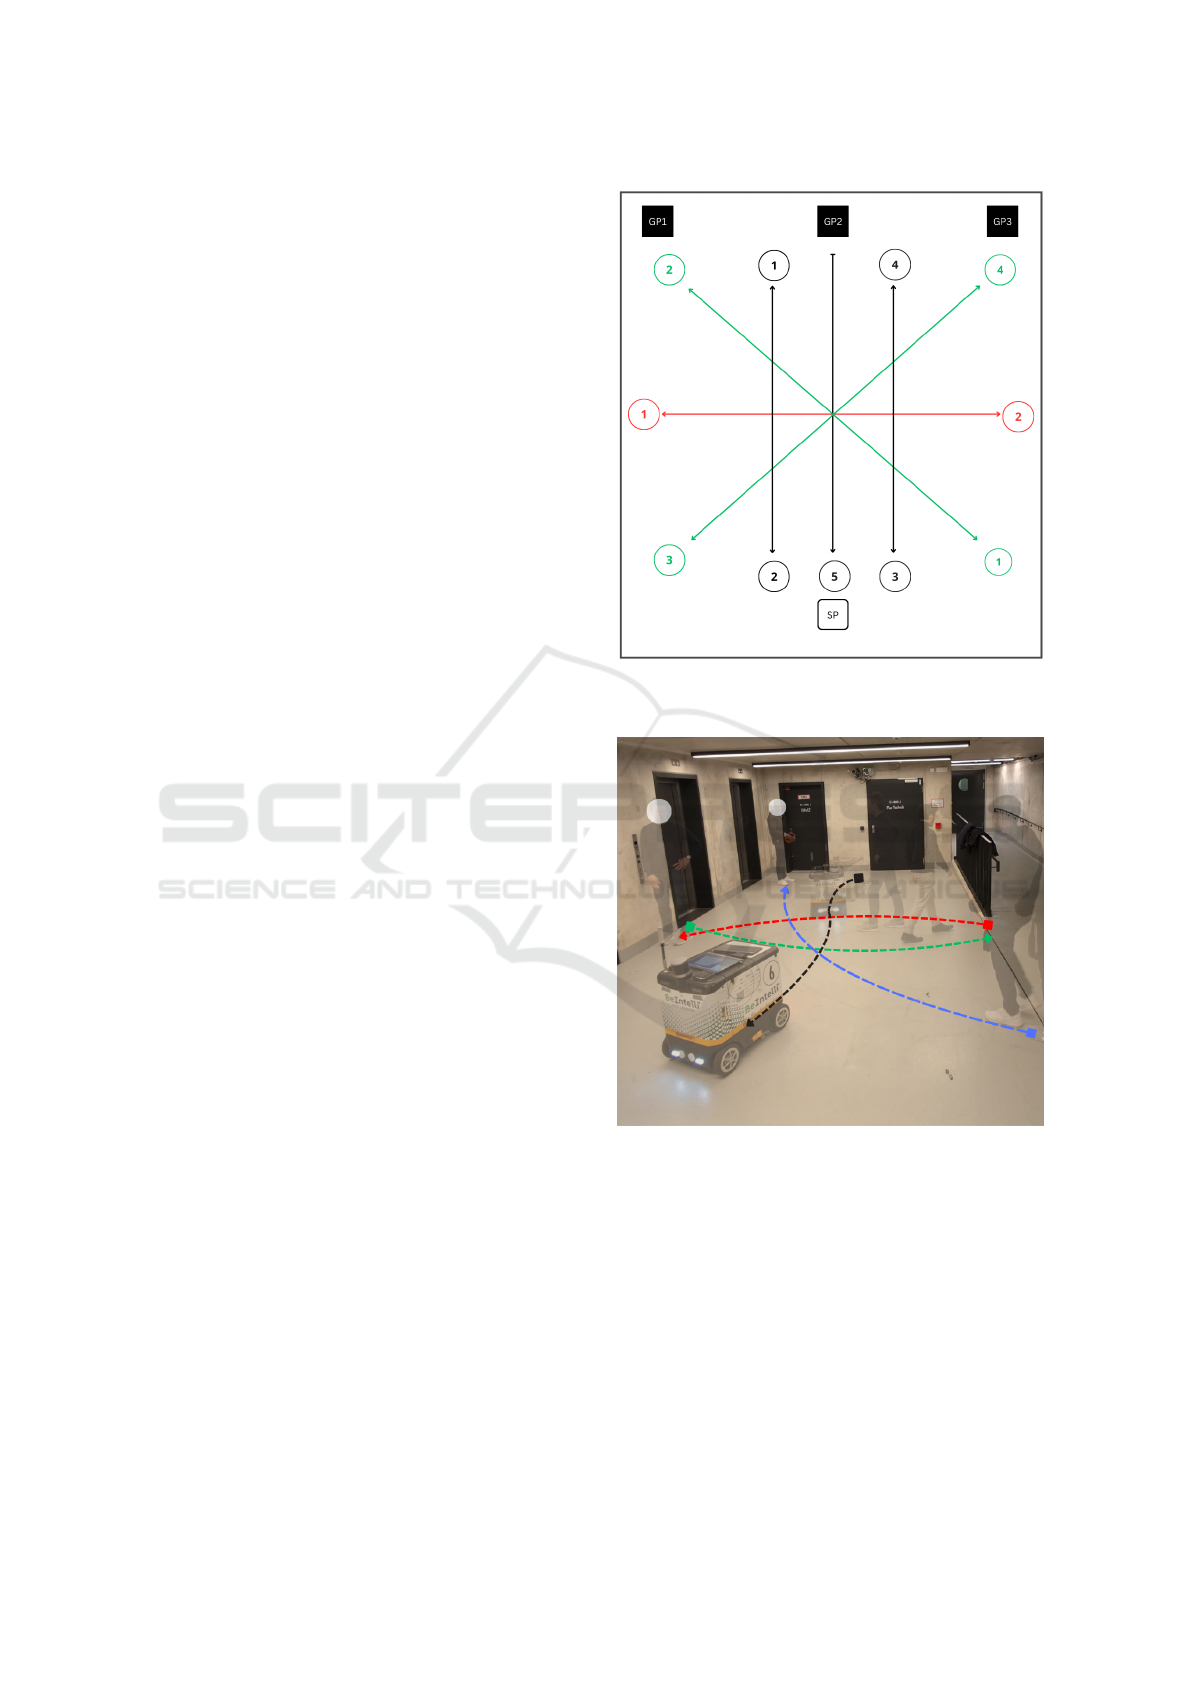
Figure 2: Schematic of the test environment showing robot
paths (SP to GP) and pedestrian routes (color-coded).
Figure 3: Visualization of the robot navigation with the SI-
MPC planner from the 8th experiment. The black arrow
represents the robot’s motion, while the motion of pedestri-
ans is illustrated by the red, green, and blue arrows.
• Green paths: Diagonal.
• Black paths: Vertical (toward or away from the
robot).
Fig. 3 visualizes one particular scenario from the set
of conducted experiments, while a more detailed de-
scription of the experiments is provided in Table 1.
Test cases systematically varied the robot’s goal
position and pedestrian density. Pedestrians crossed
ICINCO 2025 - 22nd International Conference on Informatics in Control, Automation and Robotics
254

Table 1: Description of the conducted experiments.
Test Case Robot Path Pedestrian 1 Pedestrian 2 Pedestrian 3
Scene 1 SP → GP1 Red 1 → Red 2 — —
Scene 2 SP → GP2 GP2 → Black 5 — —
Scene 3 SP → GP3 Green 2 → Green 1 — —
Scene 4 SP → GP1 Red 2 → Red 1 Black 1 → Black 2 —
Scene 5 SP → GP2 Red 1 → Red 2 Green 4 → Green 3 —
Scene 6 SP → GP3 Black 4 → Black 3 Green 3 → Green 4 —
Scene 7 SP → GP1 Black 1 → Black 2 GP2 → Black 5 Green 4 → Green 3
Scene 8 SP → GP2 Red 2 → Red 1 Red 1 → Red 2 Black 1 → Black 2
Scene 9 SP → GP1 Black 1 → Black 2 Green 2 → Black 1 Red 1 → Red 2
Scene 10 SP → GP2 Black 4 → Black 3 Green 1 → Black 2 GP2 → Black 5
paths with the robot, moved in parallel, or approached
from the opposite direction. Also, the pedestrians al-
ways tend to reach their goal positions that are speci-
fied at the current test scenario. The tests aim to eval-
uate the robot’s navigation performance under differ-
ent interaction scenarios and pedestrian densities (1–3
pedestrians). The experiments consist of 20 test cases,
divided into two categories – 10 experiments using
the SI model and 10 experiments with the CV model.
We analyze several aspects of navigation perfor-
mance with this setup, including the comparison of
robot behavior under SI and CV models using metrics
such as ADE, FDE, AMD, and AMV. Also, we assess
how the choice of predictive model influences time-
to-goal and minimum distance to pedestrians. This
controlled test environment ensures a fair comparison
of navigation strategies and highlights the robot’s ca-
pacity to adapt to varying pedestrian interactions.
4.3 Quantitative Analysis
The performance evaluation of the SI and CV mod-
els integrated in MPC for motion planning of a robot
provides critical insights into their effectiveness in dy-
namic pedestrian environments. This part of the anal-
ysis focuses on quantitative metrics (prediction ac-
curacy, motion planning efficiency, safety margins)
and qualitative observations (smoothness, adaptabil-
ity, real-world applicability). The results highlight
key trade-offs between safety, efficiency, and motion
stability, offering actionable recommendations for de-
ploying these models in real-world robotics.
In low-density environments, the SI model shows
a clear advantage over the CV model, as shown in Ta-
ble 2. It reduces ADE (0.455 vs. 1.655) and FDE
(0.687 vs. 2.849) by 72.5% and 75.9%, respectively,
reflecting significantly more accurate trajectory pre-
dictions. This stems from the SI model’s ability to
anticipate pedestrian intent through social navigation
behaviors, rather than assuming constant motion. Ad-
ditionally, the SI model yields an 84.8% lower AMV
(0.018 vs. 0.122), indicating greater confidence and
Table 2: Trajectory prediction metrics for varying numbers
of pedestrians.
# Ped. Metric SI CV Improv. (%)
1
ADE 0.455 1.655 72.5
FDE 0.687 2.849 75.9
AMD 4.430 8.151 45.6
AMV 0.018 0.122 84.8
2
ADE 0.561 0.746 24.7
FDE 0.859 1.338 35.8
AMD 5.367 3.226 -66.4
AMV 0.018 0.120 84.5
3
ADE 0.560 0.938 40.3
FDE 0.873 1.654 47.2
AMD 5.627 4.443 -26.7
AMV 0.018 0.121 84.6
reduced uncertainty, and a 45.6% lower AMD (4.430
vs. 8.151), showing closer alignment with true pedes-
trian distributions. These results highlight the SI
model’s superior reliability in simple, predictable set-
tings.
As interaction complexity increases, the SI model
maintains better results in ADE (0.561 vs. 0.746,
24.7% improvement) and FDE (0.859 vs. 1.338,
35.8% improvement), though the margin narrows
compared to the 1-pedestrian case. This is expected,
as multi-pedestrian interactions introduce more vari-
ables such as crossing paths and group dynamics.
However, the AMD (5.367 vs. 3.226) increases by
66.4% for the SI model, indicating a broader, more
conservative prediction space. This suggests the SI
model accounts for a wider range of possible pedes-
trian behaviors to avoid collisions, even if it slightly
overestimates uncertainty. The AMV remains 84.5%
lower (0.018 vs. 0.120), reinforcing that the SI
model’s predictions are still more stable and less er-
ratic than the CV model’s.
In high-density environments, the SI model con-
tinues to outperform the CV model in ADE (0.560
vs. 0.938, 40.3% improvement) and FDE (0.873 vs.
1.654, 47.2% improvement). These reductions in er-
Model Predictive Control for Crowd Navigation via Learning-Based Trajectory Prediction
255
ror demonstrate the SI model’s robustness in highly
dynamic settings, where pedestrians may abruptly
change direction or speed. Like the 2-pedestrian case,
the AMD (5.627 vs. 4.443) is 26.7% higher for the
SI model, further emphasizing its cautious approach
in crowded scenarios. This conservative behavior en-
sures safer navigation but may slightly reduce path
optimality. The AMV (0.018 vs. 0.121) remains
84.6% lower, confirming that the SI model’s predic-
tions are statistically more reliable despite the in-
creased complexity.
Table 3: Comparison of ADE, FDE, AMD, and AMV for
open- and closed-loop evaluation.
Method ADE FDE AMD AMV
Open Loop (ETH data) 0.642 1.379 3.047 0.127
Closed Loop (SI-MPC) 0.525 0.806 5.141 0.018
Table 3 reveals a nuanced relationship between
open-loop benchmark performance and real-world
behavior in a full navigation stack. The SI model,
trained solely on the ETH dataset (early stopping at
epoch 45, minimum validation loss 0.053), achieves
better trajectory accuracy (ADE: 0.525 vs. 0.642;
FDE: 0.806 vs. 1.379) but shows higher AMD (5.141
vs. 3.047), indicating a broader predictive distribu-
tion during operation. Its much lower AMV (0.018
vs. 0.127) further suggests a more cautious, stable
behavior in real-time planning. This highlights a key
insight: strong open-loop metrics do not guarantee
equivalent closed-loop performance. Integration into
a navigation stack introduces constraints—like real-
time decision-making and safety—that alter model
behavior in ways not captured by static evaluations.
Thus, open-loop metrics, while useful, must be paired
with system-level evaluations to assess true opera-
tional generalization.
Table 4: Closed-loop performance comparison of SI and
CV motion prediction methods.
# Ped. Metric SI CV Improv. (%)
1
Min. Dist. (m) 0.50 0.31 61.80
Time Taken (s) 14.80 18.77 21.10
Jerk (m/s
3
) 0.13 0.19 32.35
MPC MSE 0.02 0.02 12.54
2
Min. Dist. (m) 0.30 0.22 36.70
Time Taken (s) 24.82 19.76 -25.50
Jerk (m/s
3
) 0.17 0.17 1.08
MPC MSE 0.024 0.020 -23.08
3
Min. Dist. (m) 0.26 0.19 41.10
Time Taken (s) 21.22 18.65 -13.80
Jerk (m/s
3
) 0.21 0.30 28.38
MPC MSE 0.03 0.04 18.61
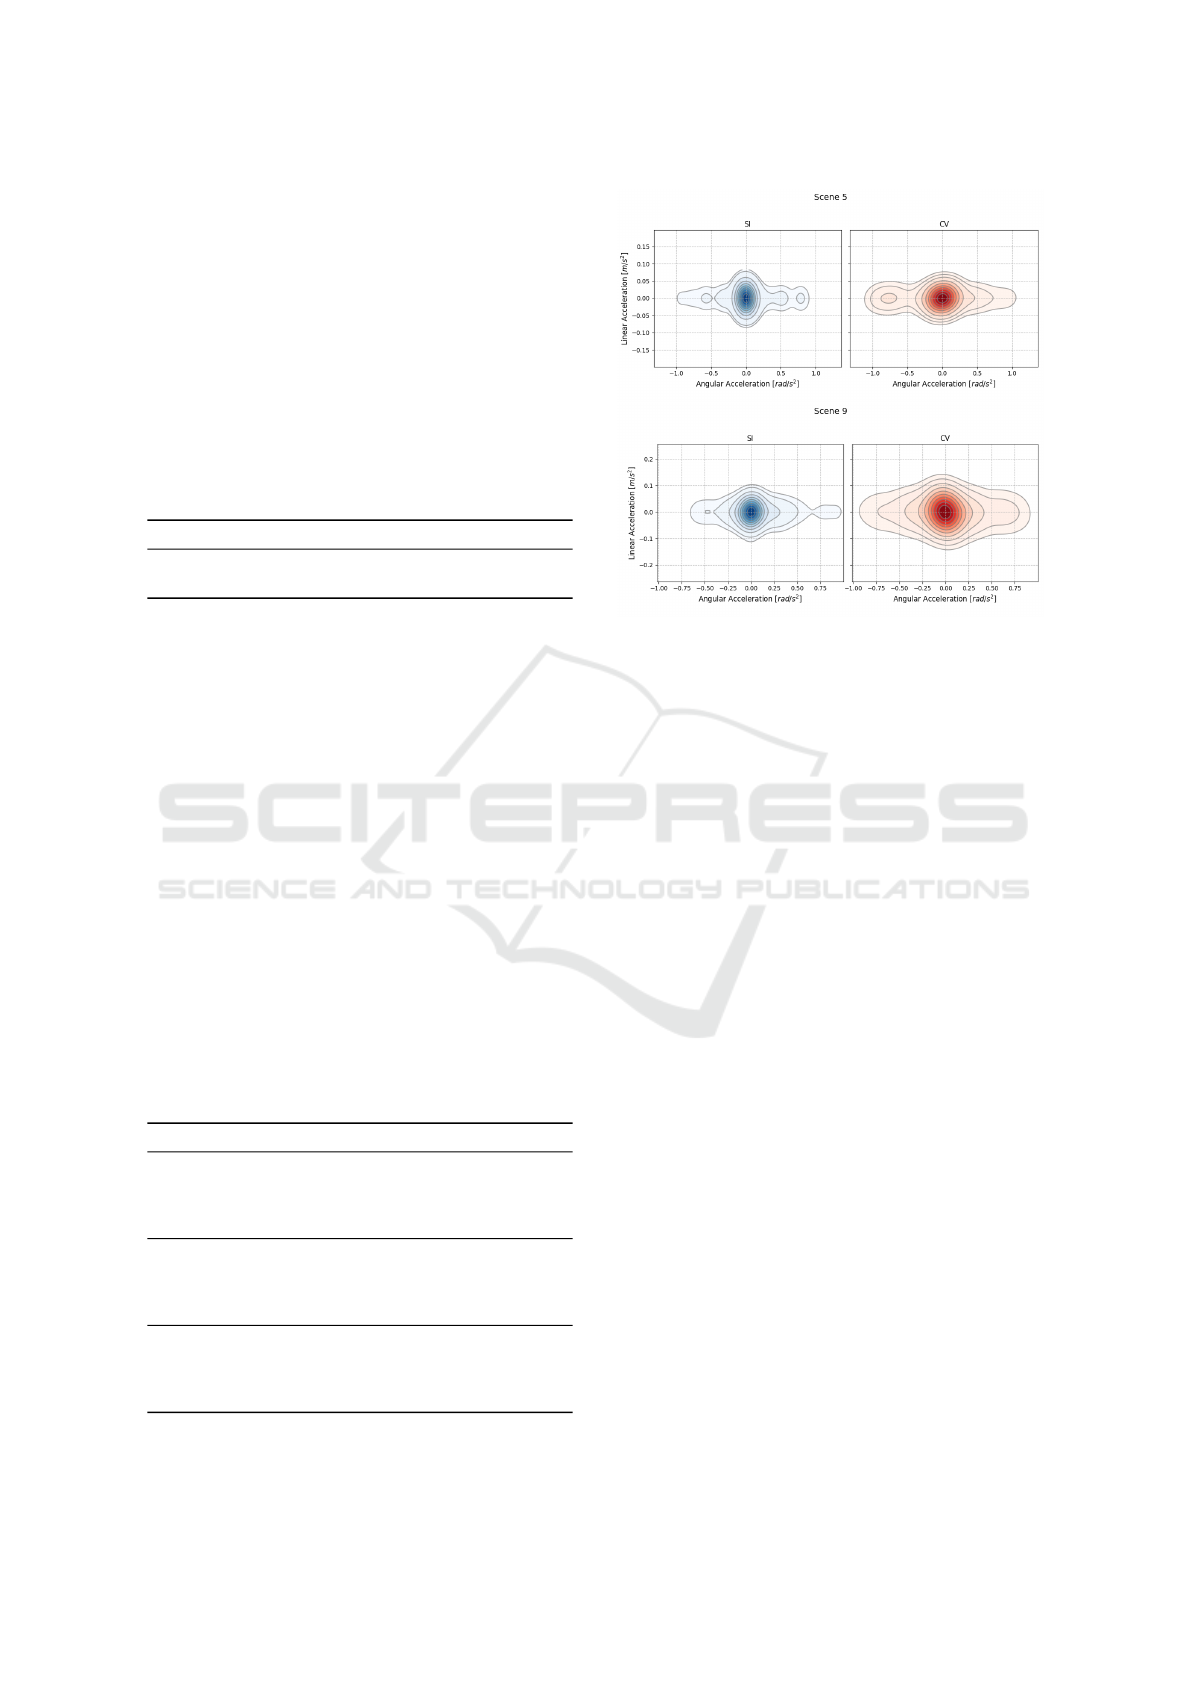
Figure 4: (Top) Linear vs. angular acceleration contour
plots for Scene 5. (Bottom) Linear vs. angular accelera-
tion contour plots for Scene 9.
The comparative analysis in Table 4 of mini-
mum distance and time taken reveals key behav-
ioral differences between the SI and CV models. In
single-pedestrian scenarios, the SI model maintained
a 61.8% larger safety margin (0.50 m vs. 0.31 m)
while completing the trajectory 21.1% faster (14.80 s
vs. 18.77 s), due to its proactive adaptation to pedes-
trian movement. As pedestrian density increased,
the SI model prioritized safety over speed: in two-
pedestrian cases, it preserved a 36.7% larger dis-
tance (0.30 m vs. 0.22 m) but took 25.5% more time
(24.82 s vs. 19.76 s); in three-pedestrian scenarios, it
achieved a 41.1% safety gain (0.268 m vs. 0.190 m)
with a 13.8% time increase (21.22 s vs. 18.65 s).
These results highlight the practical advantages of an
MPC planner using the SI model.
Motion smoothness, measured by jerk (rate of
acceleration change), directly influences pedestrian
trust. In single-pedestrian tests, the SI model re-
duced jerk by 31.6% (0.13 m/s
3
vs. 0.19 m/s
3
), indi-
cating smoother velocity transitions. For two pedes-
trians, both models showed similar jerk (0.17 m/s
3
),
though the SI model had more consistent accelera-
tion patterns (e.g., gradual deceleration in Test 6 vs.
abrupt stops in CV’s Test 4). The SI model’s advan-
tage was more evident in dense scenarios: with three
pedestrians, it lowered jerk by 28.4% (0.21 m/s
3
vs.
0.30 m/s
3
), avoiding CV’s erratic behavior (e.g., sharp
deceleration in Test 7). This aligns better with human
locomotion norms, reducing discomfort and improv-
ing social acceptance.
Prediction reliability, measured via Mean Squared
ICINCO 2025 - 22nd International Conference on Informatics in Control, Automation and Robotics
256
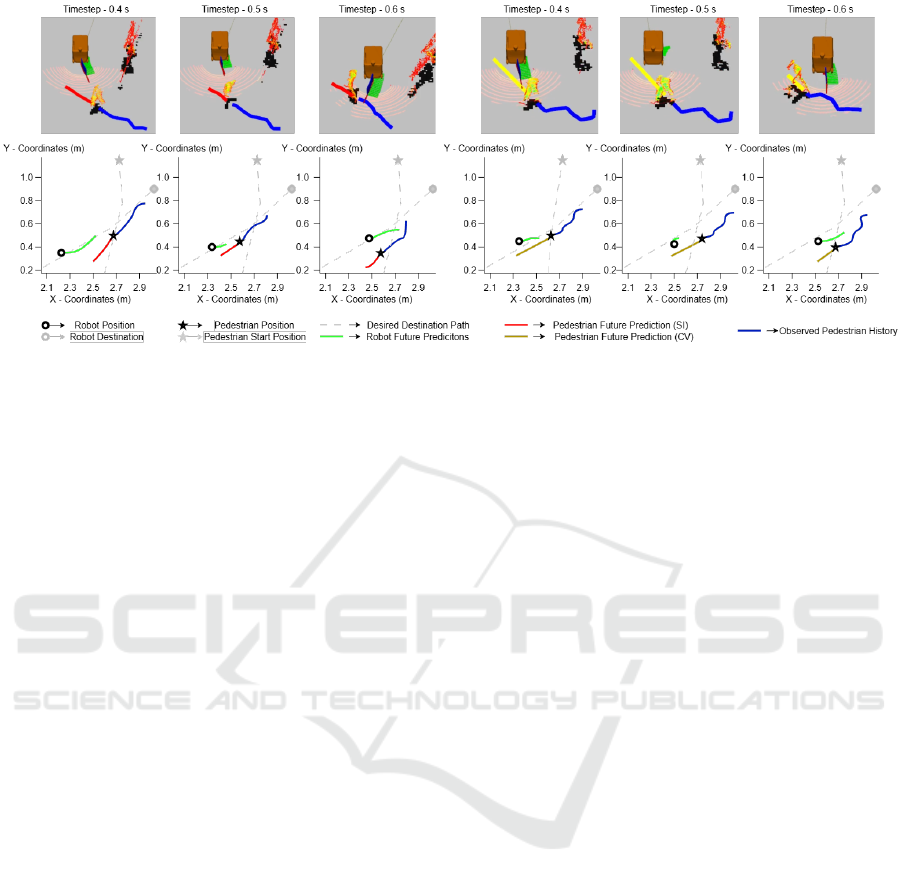
Figure 5: Robot navigation (Scene 1) through crowded environments using SI and CV models. Top row: Runtime snapshots
from RVIZ. Bottom row: Corresponding top-down schematic representations of trajectories.
Error (MSE), further distinguishes the models. The SI
model outperformed CV in 8 of 10 tests, with a 66.7%
lower MSE in Test 1 (0.005 vs. 0.017). This accu-
racy stems from its socially aware trajectory forecast-
ing, which accounts for pedestrian intent. Notably,
the CV model excelled in Test 10 (MSE: 0.026 vs.
SI’s 0.049), likely due to the SI model’s overcompen-
sation in dense crowds. While this outlier suggests
occasional over-cautiousness, the SI model’s overall
lower MSE (e.g., 37.6% improvement in Test 5) con-
firms its robustness in most real-world conditions.
4.4 Qualitative Analysis
Fig. 4 shows joint linear versus angular acceleration
contour plots for two pedestrian interaction scenes.
In both, the SI-based MPC produces more compact,
elliptical contours centered near the origin, indicat-
ing lower control effort and more stable acceleration.
This suggests that socially informed predictions help
the robot anticipate future states better, reducing the
need for corrective maneuvers. In contrast, the CV-
based MPC yields broader, more asymmetric distri-
butions, especially in angular acceleration, reflecting
more variable and reactive control inputs due to its
limited modeling of pedestrian behavior. This ef-
fect is pronounced in Scene 9, where higher angular
acceleration variance indicates frequent adjustments
and poor predictive accuracy. These findings im-
ply that socially aware prediction improves trajectory
smoothness and control efficiency, while naive mod-
els like CV increase instability and control burden,
potentially compromising safety and comfort in close
human-robot interactions.
Figure 5 illustrates Scene 1, where the robot nav-
igates from SP to GP1 as a pedestrian moves from
Red 1 to Red 2 under both CV and SI prediction mod-
els (see Table 1 and Fig. 2). The visualization shows
that the CV model, due to its simplistic and localized
predictions, prompts the robot to halt abruptly when
a potential collision is detected, particularly at 0.5s
and 0.6s. In contrast, the SI model enables smoother,
adaptive behavior: the robot reduces speed and ad-
justs its path gradually, reflecting a more temporally
consistent understanding of pedestrian motion. This
qualitative difference aligns with quantitative metrics,
especially jerk values, where lower values in the SI
case confirm its advantage.
Additionally, the overall time taken to reach the
goal with SI-MPC is more reasonable and efficient,
as it avoids unnecessary stops and abrupt actions,
thereby aligning with the observed improvements
in time-to-goal metrics presented in the quantitative
analysis. Thus, this scene effectively highlights the
advantages of the SI model in generating socially
compliant and efficient navigation for the robot.
5 CONCLUSION
This study presents three key advances in robot nav-
igation using a deep learning-based Social-Implicit
(SI) predictor integrated with MPC on a real robot.
First, the closed-loop system demonstrates real-time
feasibility at 10 Hz, validating stable MPC perfor-
mance with neural predictors. Second, comparisons
reveal a mismatch between open-loop and closed-
loop behavior—despite improved prediction accuracy
(e.g., ADE: 0.525 vs. 0.642), closed-loop deploy-
ment led to broader, more cautious predictions, em-
phasizing the need for system-level evaluation. Third,
across varied pedestrian densities, the SI-MPC out-
Model Predictive Control for Crowd Navigation via Learning-Based Trajectory Prediction
257

performed the CV-MPC approach, improving safety
margins (by 41–75%), reducing motion jerk (28–
84%), and achieving faster goal attainment (21–47%),
with only moderate efficiency trade-offs in dense
crowds. Overall, learned predictors enhance real-
world safety and social compliance, though future
work should address scalability and conservatism-
efficiency trade-offs.
ACKNOWLEDGEMENTS
This work was funded by the German Federal Min-
istry for Economic Affairs and Climate Action within
the project nxtAIM.
REFERENCES
Alahi, A., Goel, K., Ramanathan, V., Robicquet, A., Fei-
Fei, L., and Savarese, S. (2016). Social LSTM: Hu-
man trajectory prediction in crowded spaces. In 2016
IEEE Conference on Computer Vision and Pattern
Recognition (CVPR), pages 961–971. IEEE.
Bhatt, N. P., Khajepour, A., and Hashemi, E. (2023). MPC-
PF: Socially and Spatially Aware Object Trajectory
Prediction for Autonomous Driving Systems Using
Potential Fields. IEEE Transactions on Intelligent
Transportation Systems, 24(5):5351–5361.
Brito, B., Floor, B., Ferranti, L., and Alonso-Mora, J.
(2019). Model predictive contouring control for
collision avoidance in unstructured dynamic envi-
ronments. IEEE Robotics and Automation Letters,
4(4):4459–4466.
Caruana, R., Lawrence, S., and Giles, C. (2000). Overfit-
ting in neural nets: Backpropagation, conjugate gra-
dient, and early stopping. In Leen, T., Dietterich, T.,
and Tresp, V., editors, Advances in Neural Informa-
tion Processing Systems, volume 13. MIT Press.
Chen, Y., Rosolia, U., Ubellacker, W., Csomay-Shanklin,
N., and Ames, A. D. (2022). Interactive multi-
modal motion planning with branch model predic-
tive control. IEEE Robotics and Automation Letters,
7(2):5365–5372.
de Groot, O., Ferranti, L., Gavrila, D., and Alonso-Mora,
J. (2023). Globally guided trajectory planning in dy-
namic environments.
Francis, A., P
´
erez-D’Arpino, C., Li, C., Xia, F., Alahi, A.,
Alami, R., Bera, A., Biswas, A., Biswas, J., Chan-
dra, R., Chiang, H.-T. L., Everett, M., Ha, S., Hart,
J., How, J. P., Karnan, H., Lee, T.-W. E., Manso,
L. J., Mirksy, R., Pirk, S., Singamaneni, P. T., Stone,
P., Taylor, A. V., Trautman, P., Tsoi, N., V
´
azquez,
M., Xiao, X., Xu, P., Yokoyama, N., Toshev, A., and
Mart
´
ın-Mart
´
ın, R. (2023). Principles and guidelines
for evaluating social robot navigation algorithms.
Golchoubian, M., Ghafurian, M., Dautenhahn, K., and
Azad, N. L. (2023). Pedestrian trajectory prediction in
pedestrian-vehicle mixed environments: A systematic
review. IEEE Transactions on Intelligent Transporta-
tion Systems, 24(11):11544–11567.
Huang, L., Zhuang, J., Cheng, X., Xu, R., and Ma, H.
(2021). STI-GAN: Multimodal pedestrian trajectory
pre-diction using spatiotemporal interactions and a
generative adversarial network. IEEE Access.
Korbmacher, R. and Tordeux, A. (2022). Review of pedes-
trian trajectory prediction methods: Comparing deep
learning and knowledge-based approaches.
Lian, J., Ren, W., Li, L., Zhou, Y., and Zhou, B. (2023).
PTP-STGCN: Pedestrian trajectory prediction based
on a spatio-temporal graph convolutional neural net-
work. Applied Intelligence, 53(3):2862–2878.
Mangalam, K., An, Y., Girase, H., and Malik, J. (2020).
From goals, waypoints & paths to long term human
trajectory forecasting.
Mohamed, A., Qian, K., Elhoseiny, M., and Claudel, C.
(2020). Social-STGCNN: A social spatio-temporal
graph convolutional neural network for human tra-
jectory prediction. In 2020 IEEE/CVF Conference
on Computer Vision and Pattern Recognition (CVPR),
pages 14412–14420. ISSN: 2575-7075.
Mohamed, A., Zhu, D., Vu, W., Elhoseiny, M., and Claudel,
C. (2022). Social-implicit: Rethinking trajectory pre-
diction evaluation and the effectiveness of implicit
maximum likelihood estimation.
Pellegrini, S., Ess, A., Schindler, K., and van Gool, L.
(2009). You’ll never walk alone: Modeling social be-
havior for multi-target tracking. In 2009 IEEE 12th
International Conference on Computer Vision, pages
261–268.
Piccinelli, N., Vesentini, F., and Muradore, R. (2023). MPC
Based Motion Planning For Mobile Robots Using Ve-
locity Obstacle Paradigm. In 2023 European Control
Conference (ECC), pages 1–6.
Salzmann, T., Ivanovic, B., Chakravarty, P., and Pavone,
M. (2021). Trajectron++: Dynamically-feasible tra-
jectory forecasting with heterogeneous data.
Sani, M., Robu, B., and Hably, A. (2021). Dynamic obsta-
cles avoidance using nonlinear model predictive con-
trol. In IECON 2021 – 47th Annual Conference of the
IEEE Industrial Electronics Society, pages 1–6.
Sighencea, B. I., Stanciu, R. I., and C
˘
aleanu, C. D. (2021).
A review of deep learning-based methods for pedes-
trian trajectory prediction. Sensors, 21(22):7543.
Vo, V. D., Huy Pham, Q. A., Le, Q. T., Le, M. H., and Tran,
D. T. (2024). A model predictive control for dynamic
obstacle avoidance of a mobile robot based on ros.
In 2024 7th International Conference on Green Tech-
nology and Sustainable Development (GTSD), pages
299–303.
Wabersich, K. P., Taylor, A. J., Choi, J. J., Sreenath, K.,
Tomlin, C. J., Ames, A. D., and Zeilinger, M. N.
(2023). Data-driven safety filters: Hamilton-jacobi
reachability, control barrier functions, and predictive
methods for uncertain systems. IEEE Control Sys-
tems, 43(5):137–177.
ICINCO 2025 - 22nd International Conference on Informatics in Control, Automation and Robotics
258
