
MultiFlags: A Probabilistic Framework for Article-Based Size Advice in
Fashion E-Commerce
Matthias Sp
¨
ath
1,∗
, Andrea Nestler
1,∗
, Henry B
¨
oddeker
1,∗
, Leonidas Lefakis
1
, Yevgeniy Puzikov
1
,
Rodrigo Weffer
1
, Nour Karessli
1
, Nadja Klein
2
and Reza Shirvany
1
1
Zalando SE, Berlin, Germany
2
Technische Universit
¨
at Dortmund, Germany
Keywords:
Fashion, Article-Based Size Advice, Recommendation Systems, Size and Fit, Size-Related Returns,
E-Commerce, Probabilistic Framework.
Abstract:
Accurately modeling the size behavior of fashion articles at scale is a critical task for fashion e-commerce.
However, it has proven to be highly challenging due to inconsistent sizing systems across countries, inconsis-
tent garment design processes, and brand-specific sizing specifications. Widespread methods in the field focus
primarily on giving customers rudimentary size recommendations (e.g., we recommend you size S) based
on the customers’ purchase behavior and/or their size and fit preferences. These approaches fail to take into
account the size and fit behavior of the article, for example their design cut, shape, material, etc. (or at best
treat it with simplistic ad hoc assumptions), and in turn, not effectively reducing the high volume of online
article returns due to size and fit. In this work, we propose a theoretically-motivated probabilistic framework,
MultiFlags, which can significantly reduce size-related returns in fashion e-commerce thanks to modeling
multiple aspects of article’s size and fit behavior. We also highlight how this framework enables a principled
approach to article-based size advice, while leveraging data from multiple modalities. The results validate
the competitiveness of the proposed framework in the state-of-the-art in several size advice scenarios that are
critical for fashion e-commerce. The framework is deployed in production in a large e-commerce site, serving
millions of customers and driving significant results.
1 INTRODUCTION
The rise and steady growth of fashion e-commerce
has introduced customers to a novel shopping expe-
rience. On the one hand, customers are enabled to
browse and search clothing items from a multitude of
brands and different trends simply from their phones.
On the other hand, they can no longer physically inter-
act with the clothing items. In order to aid customers
in navigating this new shopping environment, a host
of fashion-focused algorithmic products have been
developed in recent years (see Jaradat et al. (Jaradat
et al., 2022) and references therein).
One of the main challenges in choosing the right
clothing item to wear is its size, which has been
shown to be a major factor in returning clothes and
shoes (C, 2014). In the brick-and-mortar experience,
a customer typically has access to a fitting room to try
∗
These authors contributed equally to this research.
clothes and shoes on before purchasing them, and to
shop attendants or family and friends who can give
feedback on the right size and fit of the item. In
online fashion, purchasing clothes and shoes in the
wrong size not only will result in that article be-
ing returned, it most importantly will cause frustra-
tion to the customer, increase CO2 emissions, reduce
profitability for the online shop, and increase logisti-
cal costs and delivery trucks on the roads. Consid-
ering the CO2 emissions, for example, a recent e-
commerce carbon report indicates that reducing one
return could cut a whooping ∼ 0.99 kg of CO2 equiv-
alent emissions (Aso, 2020). Considering that mil-
lions of clothes and shoes are returned each year in
online fashion due to size and fit issues, the CO2
impact of reducing the size related returns is signif-
icant. In fact, these effects are pivotal today and in
coming years where returns are seeing a steady in-
crease (Choi, 2016). We consider the size-related re-
turns, in theory, to be an unnecessary hassle, espe-
Späth, M., Nestler, A., Böddeker, H., Lefakis, L., Puzikov, Y., Weffer, R., Karessli, N., Klein, N. and Shirvany, R.
MultiFlags: A Probabilistic Framework for Article-Based Size Advice in Fashion E-Commerce.
DOI: 10.5220/0013709900004000
Paper published under CC license (CC BY-NC-ND 4.0)
In Proceedings of the 17th International Joint Conference on Knowledge Discovery, Knowledge Engineering and Knowledge Management (IC3K 2025) - Volume 1: KDIR, pages 313-322
Proceedings Copyright © 2025 by SCITEPRESS – Science and Technology Publications, Lda.
313

Figure 1: High level overview of the new article-based size advice framework MultiFlags.
cially considering that the customers are often satis-
fied with all other attributes of their order (e.g., item’s
color, price, material, delivery, etc.) and only due to
the fact that the ordered size of the clothes or shoes
does not fit them, they have no choice but to re-
turn the item. This is an unsolved problem today in
fashion e-commerce due to: the lack of standardized
sizing systems (e.g., discrepancies in a medium size
across different brands), incompatible sizing varia-
tions (e.g., the difference between EU and UK sizes),
the prevalence of vanity sizing (intentional mislabel-
ing to make customers feel smaller, e.g., make cus-
tomers believe they are a size 6 when in reality they
are a size 8), inconsistent size charts (e.g., conflict-
ing measurements for the same size across brands),
limited size range (e.g., excluding plus-size or petite
options), variations in body shapes (e.g., inadequate
consideration of different proportions), inconsistent
fit (e.g., the same size fitting differently in different
styles), and insufficient size information in product
descriptions.
Addressing these challenges requires the imple-
mentation of creative solutions to enhance the siz-
ing experience and improve overall customer satis-
faction in the realm of online fashion. Prior work on
developing algorithmic products to assist customers
often focuses on providing personalized size recom-
mendations, relying rather on customers’ personal
data (Lefakis et al., 2021; Yuan et al., 2021), or their
prior purchases (Hajjar et al., 2020; Sheikh et al.,
2019; Lasserre et al., 2020), and often without con-
sidering the articles’ sizing issues (Guigour
`
es et al.,
2018; Sembium et al., 2017; Sembium et al., 2018;
Dogani et al., 2019; Abdulla and Borar, 2017; Ab-
dulla et al., 2019). This approach to size advice ex-
cludes customers without a purchase history or cus-
tomers who buy for others within a single account.
A notable exception is SizeFlags (Nestler et al.,
2021) where articles are “flagged” as too-big and too-
small based on historic customer returns for this arti-
cle, expert assessments, and the fit issue probability
assessment of an image based convolutional neural
network, SizeNet (Karessli et al., 2019). Such advice
allows customers to decide whether to go “one size
down” or “one size up” compared to the usual size
they would be purchasing. In this work, we present
a novel joint probabilistic framework, called Multi-
Flags, which similarly provides article-based size ad-
vice. MultiFlags leverages a multinomial-Dirchlet
model to build a recommender system that eliminates
the need for separate treatment of the article size is-
sues while relaxing the limiting assumptions made in
previous works. Figure 1 shows a high level overview
of the framework and is detailed in Section 3.
2 RELATED WORK
2.1 Size Recommendations
Previous work on the issue is mostly focused on sug-
gesting a specific size of an article for the customer’s
preferences, i.e. size recommendation. Abdulla and
Borar (Abdulla and Borar, 2017) formulate the rec-
ommendation task as binary classification, circum-
venting data sparsity by learning article latent repre-
sentations from categorical features including brand,
size, occasion, etc. Customer representations are built
by aggregating article vectors from their order his-
tory. Sembium et al. (Sembium et al., 2017) pro-
pose a latent factor model for customers and products,
corresponding to their physical true size. Sheikh et
al. (Sheikh et al., 2019) exploit the correlations be-
tween different categories in a scalable deep learn-
ing system that can ingest broader article and cus-
tomer features, while Dogani et al. (Dogani et al.,
2019) leverage transfer learning from brand to prod-
uct level. Hajjar et al. (Hajjar et al., 2020) further
extend this ability and explicitly consider the sequen-
tial and temporal nature of the problem by applying
KDIR 2025 - 17th International Conference on Knowledge Discovery and Information Retrieval
314

an attention-based model. Inspired by advancements
in the computer vision field, Lasserre et al. (Lasserre
et al., 2020) utilize a meta-learning approach that ef-
ficiently learns new customer sizes with little order
data. Other approaches further deal with extreme
cases of cold-start customers with little or no purchase
history using physical body-related features (Lefakis
et al., 2021; Yuan et al., 2021). From another angle
on the problem, computer vision techniques and arti-
cle measurement data are used to learn article fit and
body shape compatibility (Hidayati et al., 2018; Hsiao
and Grauman, 2020). With the aim of simulating the
in-store customer fitting experience, recent efforts de-
veloped virtual try-on solutions to visualize garments
on a target body. While 3D methods (Bhatnagar et al.,
2019; Patel et al., 2020) accurately render garments
on virtual avatars, they often require expensive real
body scans. Overcoming this requirement, generative
adversarial models are used to warp clothing items on
a target person in 2D images (Han et al., 2018; Dong
et al., 2019; Issenhuth et al., 2019; Pecenakova et al.,
2022; Pang et al., 2024), however, the physical feasi-
bility of such methods in real-life applications is not
guaranteed. There have been earlier Bayesian models
in the size and fit space focused on personal size rec-
ommendation. Sembium et al. (Sembium et al., 2018)
used Bayesian inference to find the best article size
for a given customer, by modelling the joint posterior
of a customer’s true size and article sizes by using
the purchase histories. Guigour
`
es et al. (Guigour
`
es
et al., 2018) use a similar strategy by modelling the
joint probability distribution of return and article size
in a hierarchical model. Size recommendation poses
several challenges. Some approaches require sensi-
tive customer information, such as height and weight,
or scans of the customer’s physical body to be able
to generate recommendations or simulate the fitting
experience (Yuan et al., 2021; Lefakis et al., 2021;
Bhatnagar et al., 2019; Patel et al., 2020).
2.2 Article-Based Size Advice
The status quo on article-based size advice is that
the existing state-of-the-art is notably and sadly very
sparse, where only a handful of publications focus on
the critical article-level size advice capability uncon-
ditioned on a target customer’s orders or body proper-
ties (Nestler et al., 2021; Karessli et al., 2019; Baier,
2019; Misra et al., 2018), which is key in alleviating
the issues with data sparsity, sizing systems and the
customer-specific cold start problem. This has been
approached by analyzing customer reviews (Baier,
2019; Misra et al., 2018), and by evaluating cold-
start articles with a computer vision-based teacher-
student framework (Karessli et al., 2019). Building
on that work, (Nestler et al., 2021) propose Size-
Flags, a method capable of incorporating different
priors and evaluated on a large-scale A/B test sce-
nario showing SizeFlags reduce the size-related re-
turn rate across different fashion categories of tex-
tile and shoes. Due to space limitations, we do not
provide a detailed description of SizeFlags (Nestler
et al., 2021) and refer the reader to the original paper.
In short, SizeFlags (Nestler et al., 2021) is reducing
size-related returns by providing article-based size ad-
vise with the recommendation of selecting a larger/
smaller size when the article runs small/ large. It
models the probability of an article being too-small or
too-big separately, using two separate Beta-Binomial
distributions. This implies the assumption of inde-
pendence between the probability of an article be-
ing too-big or too-small, which is unlikely to hold in
practice and constitutes one of the main limitations of
SizeFlags (Nestler et al., 2021) . Furthermore, Size-
Flags (Nestler et al., 2021) uses point estimates for
predictive posterior calculation and does not estimate
the confidence of the model in its predictions.
2.3 Baselines for Size-Related Return
Reduction
To our knowledge, SizeFlags (Nestler et al., 2021)
is the only state-of-the-art approach that has demon-
strated a positive impact on reducing size-related re-
turns—the key objective of this line of work in fash-
ion e-commerce—and will therefore serve as our
baseline for article-based size advice. Other article-
based size advice approaches have neither claimed
nor have been evaluated by their authors in terms
of reducing size-related returns, making them not di-
rectly applicable as baselines for the MultiFlags ap-
proach. Previous approaches using personalized rec-
ommenders as described in Section 2.1 are often eval-
uated based on acceptance rate (usually defined as the
share of sales where a customer follows the recom-
mendation and keeps it). This in turn is not possible
for article-based size advice like the presented Mul-
tiFlags, because the true size of the customer is un-
known, so it remains unclear whether the customer
followed the advice or not.
To provide a broader context beyond article-
based advice, we also consider a personalized size-
recommendation paradigm outlined in Section 2.2 for
comparison, which utilizes the meta-learning method-
ology proposed by Lasserre et al. (Lasserre et al.,
2020). In this approach, the individual customer gets
a direct size recommendation (e.g., ”We recommend
size S”) that is dependent on both the customer and
MultiFlags: A Probabilistic Framework for Article-Based Size Advice in Fashion E-Commerce
315

the article. This allows us to frame the new algo-
rithm described in this paper against both article-
based and personalized recommendation approaches
(Section 4.3).
The scarcity of prior research on data science so-
lutions for reducing size-related returns underscores
the urgent need for advancements in this area. This
paper addresses this gap by presenting a novel, com-
prehensive solution that not only overcomes existing
limitations but also makes a significant contribution
to the field through our probabilistic framework and
its demonstrably impactful results.
3 MULTIFLAGS: A MULTI-CLASS
SIZE ADVICE ALGORITHM
The aim of the proposed MultiFlags approach is to
lower size-related returns in fashion e-commerce by
providing article-based size advice to the customer. It
leverages the article’s sales and return reason informa-
tion, such as ”too small” and ”too big”, which is typi-
cally collected in fashion e-commerce. The output is a
flag that provides the customer with additional sizing
information on the article, such as ”This article runs
large, we recommend going one size down”. Optional
additional input for the model is used as prior infor-
mation and can be based on expert knowledge on the
article or visual sizing cues based on models such as
SizeNet (Karessli et al., 2019). The prior information
can help raising flags faster and earlier in the product
life cycle, so that customers can benefit early on. The
approach is illustrated in Figure 1. MultiFlags ad-
dresses the limitations described in Section 2.2, lead-
ing to novelty in five points: 1) Instead of using sepa-
rate models, the estimation of all flags is unified into
a single model, acknowledging the dependence be-
tween an article being too-big (tb; an article fits bigger
than expected) or too-small (ts; an article fits smaller
than expected). 2) The approach naturally gives rise
to two new flag types, namely true-to-size (tts; an arti-
cle has good fit in their indicated size.) and critical-fit
(cf; an article is ts and tb at the same time) when the
probability vertex is split into different zones. 3) The
framework provides a principled approach to include
prior information. 4) The model has a flagging logic
based on confidence and 5) the model is extendable to
prior mixtures and hyperpriors.
3.1 A Unified Probabilistic Framework
The framework leverages a conjugate Bayesian
Model with a Dirichlet prior p|α ∼ Dir(α).
The return realizations x = (x
ts
, x
tb
, x
tts
) (with x
k
=
number return reasons k ∈ {tb,ts}; x
tts
= number
sales −x
tb
− x
ts
) given p = (p
ts
, p
tb
, p
tts
) (class prob-
ability vector with
∑
k∈Ω
p
k
= 1) are modelled using
a multinomial likelihood x|p ∼ Mult(p). Thus, the
probability density functions of the likelihood P(x|p)
and prior P
prior
(p|α) read as
P(x|p) =
n!
x
ts
!x
tb
!x
tts
!
p
x
ts
ts
p
x
tb
tb
p
x
tts
tts
, (1)
P
prior
(p|α) =
1
B(α)
∏
i∈Ω
p
α
i
−1
i
, (2)
where B(α) is the multivariate Beta function, Ω =
{ts, tb, tts} is the set of indices. The posterior proba-
bility density function, by conjugacy, is defined as
P
post
(p|x, α) =
P(x|p)P
prior
(p|α)
∥ · ∥
(3)
= P
prior
(p|x + α) (4)
=
1
B(x + α)
∏
i∈Ω
p
x
i
+α
i
−1
i
. (5)
Note that, while SizeFlags (Nestler et al., 2021)
computes a score value for each flag directly and then
compares to a threshold for raising a flag, MultiFlags
estimates the posterior probability, determining flags
at a later step.
3.2 Estimation of the Posterior
Probability
We define the observed size-related return rate srr
k
(a)
of a given article a ∈ C that belongs to a fashion cate-
gory C ⊂ C
all
(e.g. jeans, shirts, shoes) as
srr
k
(a) =
x
k
n
, k ∈ {tb,ts}. (6)
with n the number of sales. The true size-related re-
turn rate srr
⋆
k
(a) of an article is unknown, but we
know that the higher the number of article orders n,
the more confident we are that srr
k
(a) is close to
srr
⋆
k
(a):
srr
⋆
k
(a) = lim
n→∞
srr
k
(a). (7)
Each fashion category C poses different size and
fit challenges. Therefore, we evaluate each article
against its category.
The mean and the standard deviation
µ
C ,k
:= mean({srr
k
(a)}
a∈C
), (8)
σ
C ,k
:= std({srr
k
(a)}
a∈C
), (9)
for k ∈ {ts, tb} differ for each category. For example,
µ
C ,k
of the category C = C
t−shirt
is in general much
smaller than µ
C ,k
with C = C
dresses
as t-shirts are less
KDIR 2025 - 17th International Conference on Knowledge Discovery and Information Retrieval
316
complex in terms of fit than dresses, which results in
a lower size-related return rate.
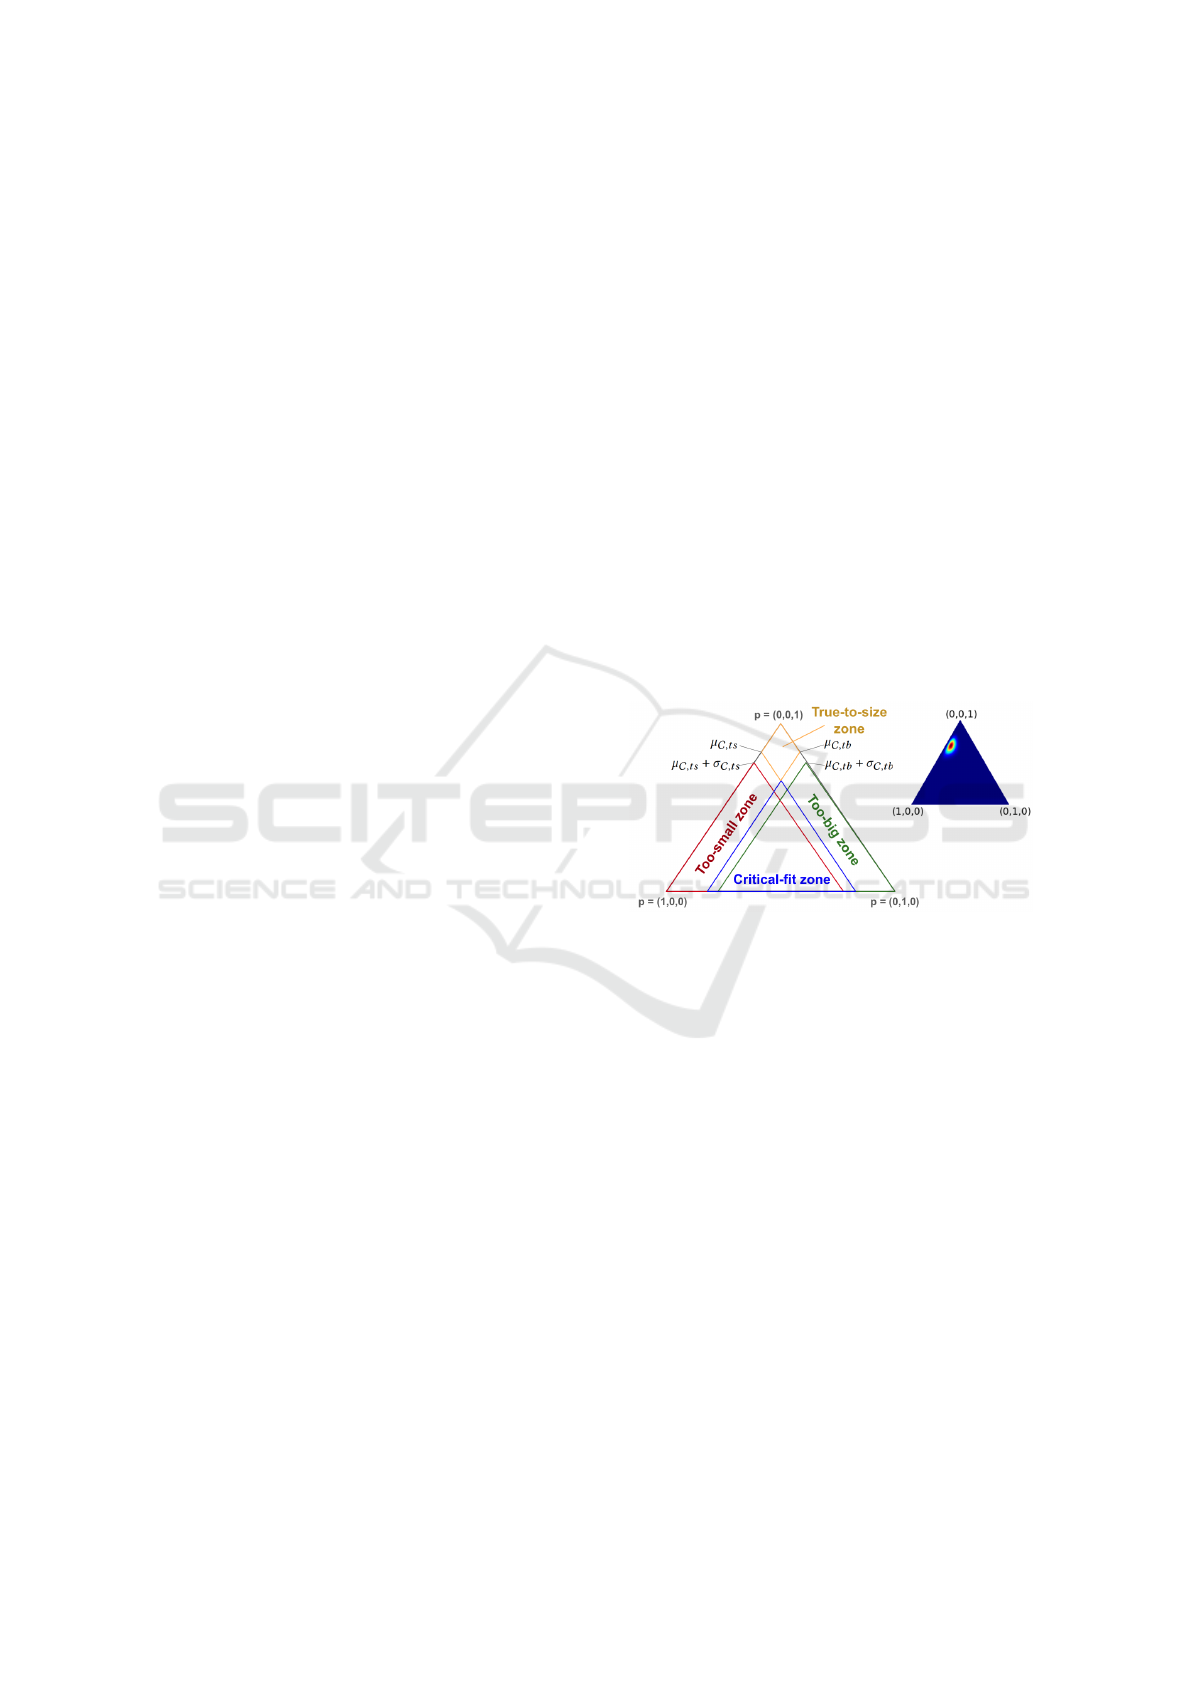
Based on the category averages µ
C ,k
and standard
deviations σ
C ,k
, we define the zones that are interest-
ing for the different flag types. The tb/ts zone is de-
fined by the srr
⋆
k
(a) of an article a being more than
one standard deviation σ
C ,k
above the category mean
µ
C ,k
for k ∈ {ts, tb} (red and green zone in Figure 2).
The cf zone is defined by having both the srr
⋆
tb
(a) and
srr
⋆
ts
(a) above the category specific mean (blue zone
in Figure 2). The tts zone is defined exactly opposite
by having both the srr
⋆
tb
(a) and srr
⋆
ts
(a) below the cat-
egory specific mean (yellow zone in Figure 2). The
four zones are the most obvious approach to zoning
the probability vertex and hence naturally give rise to
the two new flag types. The four zones result in the
following logic for k ∈ {tb,ts}:
a is k ⇔ srr
⋆
k
(a) ≥ µ
C ,ts
+ σ
C ,k
,
a is cf ⇔ srr
⋆
ts
(a) ≥ µ
C ,ts
&
srr
⋆
tb
(a) ≥ µ
C ,tb
,
a is tts ⇔ srr
⋆
ts
(a) ≤ µ
C ,ts
&
srr
⋆
tb
(a) ≤ µ
C ,tb
.
(10)
Example 1. Let us illustrate the zoning rules (10)
with one example for a real world category C
rw
, which
has an average size-related return rate µ
C ,k
= 10% for
k ∈ {tb,ts}, meaning 10% of sold items are returned
as too-big or too-small each. The standard deviations
are σ
C ,tb
= 0.05 and σ
C ,ts
= 0.06. C
rw
contains more
than 100000 different articles.
In practice srr
⋆
k
for k ∈ {tb, ts} is not known, but
let’s suppose we pick one article a ∈ C
rw
with a high
srr
⋆
ts
(a) = 33% and low srr
⋆
tb
(a) = 8%. The article a
has an exceeding amount of too-small returns in the
category C
rw
with srr
⋆
ts
(a) = 33% ≥ µ
C ,ts
+ σ
C ,ts
=
10% + 6% = 16%. At the same time this article
shows a usual too-big returns since srr
⋆
tb
(a) = 8% ≤
µ
C ,tb
+ σ
C ,tb
= 10% + 5% = 15%. This article would
therefore be a suitable too-small candidate. But we do
not know the true return rate. Therefore we integrate
over the probability distribution in the zone defined by
µ
C,k
and σ
C,k
for k ∈ {tb,ts} to get a confidence mea-
surement. Based on this, we decide whether the item
is actually marked as too-small. This number helps
us to make a confident decision as to whether an item
will be finally be labeled as too-small. This approach
is outlined in the next paragraph.
With definition (10), for a given article a ∈ C with
return realization x and fixed parameter α, the proba-
bilities are defined as
P
ts
= P (p
ts
≥ µ
C ,ts
+ σ
C ,ts
= l
(1)
ts
), (11)
P
tb
= P (p
tb
≥ µ
C ,tb
+ σ
C ,tb
= l
(2)
tb
),
P
c f
= P (p
ts
≥ µ
C ,ts
= l
(1)
c f
, p
tb
≥ µ
C ,tb
= l
(2)
c f
),
P
tts
= P (p
ts
≤ µ
C ,ts
= u
(1)
tts
, p
tb
≤ µ
C ,tb
= u
(2)
tts
).
With the zone boundaries u
(i)
k
and l
(i)
k
from (11) and
additionally u
(i)
k
= 1 for k ̸= tts and l
(2)
ts
= l
(1)
tb
= l
(i)
tts
=
0 we get ∀k ∈ Ω
+
and i ∈ {1, 2}
P
k
=
Z
l
(1)
k
u
(1)
k
Z
l
(2)
k
u
(2)
k
Z
1
0
P
post
(p|x, α) d p (12)
For each k ∈ Ω
+
(=Ω∪{c f }) this results in a posterior
probability P
k
∈ [0, 1], which can be interpreted as the
probability that srr
⋆
k
(a) of an article a is within the
specified zone. For example, P
ts
= 97% implies that,
based on the current return realizations of the article,
it’s 97% likely that the srr
⋆
k
(a) is within the too-small
zone. With this approach the posterior probability can
be interpreted as a confidence measure in the flag.
Figure 2: (Bottom Left) The different zones are defined
based on their respective µ
C,k
and σ
C,k
.
(Top Right) Probability density distribution for a too-small
flagged article a ∈ C
rw
.
In Figure 2 we illustrate the different zones on the
probability vertex and re-visit the Example 1 with cat-
egory C = C
rw
and article a ∈ C
rw
with srr
⋆
ts
(a) = 33%
and srr
⋆
tb
(a) = 8%. Assuming return realizations x +
α = (8.4, 2.9, 28.5) (e.g. based on return observations
x = (6, 0, 6) and prior α = (2.4, 2.9, 22.5)), the poste-
rior zone value integrates to P
ts
= 97%, P
tb
= 0.01%,
P
c f
= 1% and P
tts
= 1%. Here we used the prior con-
centration parameter α = α
⋆
C
which will be described
in the next Section 3.3.
The approach MultiFlags raises a flag when P
k
≥
θ ∈ [0, 1]. In Section 4.1 we will show how an optimal
threshold θ
⋆
= θ for raising a flag can be determined.
3.2.1 Computational Complexity and Efficient
Integration Methods
The biggest bottleneck is the numerical integration to
get the posterior probability P
k
(x(a
i
), α
k
) in equation
MultiFlags: A Probabilistic Framework for Article-Based Size Advice in Fashion E-Commerce
317

(12). To increase efficiency, the double integration of
the two free parameters is performed only in zones
with overlap, reducing the runtime by a factor of 10.
Zones that depend on one parameter are integrated us-
ing the marginal distribution of the Dirichlet distribu-
tion. To derive the marginal distribution of a Dirich-
let distribution with three dimensions, we use the
definition of conditional probability after integrating
the third dimension, f (p
1
, p
2
) = f (p
1
) × f (p
2
|p
1
).
Rewriting the equation shows that the marginal is a
Beta distribution,
1
1−p
1
P
2
|P
1
∼ Beta(α
2
, α
3
), which
has a closed-form cumulative density function, so the
numerical integration is not necessary. When the too-
small and too-big zones overlap, we calculate the in-
dividual zones using the marginal Beta distributions,
and handle the overlap separately. To reduce the time,
the full computation is parallelized on a distributed
computing system, i.e. Spark, on a cluster with 8
workers and 8 cores each, taking 3 hours for several
million articles.
3.3 Estimation of the Parameter α
3.3.1 Estimation Based on Category Sales and
Return Data
All articles within a category C have similar size-
related return properties, which can be incorporated
as a prior in the Bayesian approach, as µ
C ,k
and σ
C ,k
for k ∈ {tb,ts} are known at the time of calculation.
To estimate the concentration parameter α for
the prior, we use the Dirichlet-Multinomial distribu-
tion. It is a closed-form compound distribution of
the Dirichlet and multinomial distribution, where the
variable p of the Dirichlet distribution is integrated
out. With A =
∑
k∈Ω
α
k
and the Gamma function Γ()
the likelihood function reads
f (x|α, n) =
Z
P(x|p)P
prior
(p|α)d p
=
Γ(A)Γ(n +1)
Γ(n + A)
∏
k∈Ω
Γ(x
k
+ α
k
)
Γ(α
k
)Γ(x
k
+ 1)
.
(13)
The parameter α = α
⋆
C
for each category C can be
estimated using the maximum likelihood method
α
⋆
C
= argmax
α
∏
a∈C
f (x|α, n). (14)
Applying method (14) for the category C
rw
in Ex-
ample 1, we obtain the optimal solution α
⋆
C
=
(2.4, 2.9, 22.5). This problem is solved by a combined
Gradient-Newton method.
3.3.2 Estimation Based on Prior Information
We aim to have articles flagged as early as possible
to ensure both customers and the business benefit re-
spectively from the supportive advice and the lower
return rates thanks to those early flags. Using the prior
information as outlined here helps to tackle the cold-
start problem for articles where not enough return in-
formation is available and aims at raising flags with
less processed returns available. For MultiFlags we
introduce prior information from human expert feed-
back from fashion models. The feedback is based on
fashion models who try on articles before they are ac-
tivated on the platform to provide first hand feedback
on a subset of articles. They provide size and fit feed-
back similar to the customer return information, indi-
cating whether an article runs ”too small”, ”too big”
or ”true to size”. The averaged feedback of multiple
human models for the same article is used to estimate
the article-specific prior parameters.
Let C
exp
(k) ⊂ C be the subset of all articles a
for which the feedback of the fashion models is ex-
actly k (i.e. f eedback(a) ≡ k for k ∈ {tb, ts,tts}).
Then, similar to equation (14), the Expert Prior
α
⋆
C
exp
(k)
= α can be determined via the maximum like-
lihood method. Revisiting Example 1 with category
C = C
rw
and focusing on all articles with human ex-
pert feedback C
exp
(k), the maximum likelihood ap-
proach for articles with too-small human expert feed-
back (k ≡ ts) results in the concentration parameters
α
ts
= 6.3, α
tb
= 2.2, and α
tts
= 15.0.
4 MULTIFLAGS: DATA AND
RESULTS
MultiFlags is compared to the state-of-the-art bench-
mark for article-based size advise, SizeFlags (Nestler
et al., 2021) . The comparison creates an additional
complexity that goes beyond the complexity of bench-
marking against no size advise at all, as the compari-
son of the two models, gives rise to four distinct cases,
namely when a flag is added by MultiFlags (Added),
dropped by MultiFlags (Dropped) or when both ap-
proaches raise the same flag (Same) or a different flag
(Different) for the same article. A graphical overview
of these four sets can be found in Figure 3. In the
coming sections we will focus on the evaluation of
the Same, Dropped and Added flags as the number of
Different flags is close to zero and negligible in our
experiments.
The following evaluation of the models is sep-
arated into two sections: Section 4.1 addresses the
Same and Dropped flags, by optimizing the θ thresh-
old, which was introduced in Section 3.2, on a train-
ing set and evaluating the results on a holdout set via
Difference-in-Differences approach. Section 4.2 ex-
tends the evaluation of the two models to the Added
KDIR 2025 - 17th International Conference on Knowledge Discovery and Information Retrieval
318

Figure 3: The comparison of the two approaches gives rise
to the Same, Different(Diff ), Dropped and Added flags.
flags via A/B test. Finally, Section 4.3 discusses the
complementary effects between our article-based ap-
proach and personalized size recommendations.
4.1 Threshold Optimization and
Holdout Set Performance
Evaluation
4.1.1 Datasets
The data acquisition is based on the return process
of the e-commerce platform. Customers can return
articles at no charge with or without providing a re-
turn reason from a predefined list of reasons. With
respect to size or fit, customers have the possibility
to state ”The item is too small” or ”The item is too
big” among other non-size-related options (such as
”The item isn’t as described”, ”The item is too ex-
pensive” etc.). The dataset used is a random subset of
anonymized data coming from two years [June 2021
- May 2023] of article purchases and returns of a ma-
jor fashion e-commerce platform for multiple Euro-
pean countries. It contains the sales and return infor-
mation for 3.6 million textile articles. The additional
prior information was available for ∼ 5000 articles for
the human expert feedback. The top five categories
are dresses, knitwear, jerseys, blouses, trousers and
these together make up 55% of articles in the dataset.
We highlight that this method is applicable for most
fashion e-commerce platforms as it requires a dataset
that contains only the sales as well as ”too small” and
”too big” returns on an article level, which fashion e-
commerce platforms typically collect.
To our knowledge, from publicly available fash-
ion datasets (fas, 2022), only two are relevant for the
size topic in fashion, ‘ModCloth’ and ‘RentTheRun-
Way’ (Misra et al., 2018). These contain fashion
products with fit labels, however, both datasets lack
the sales and return information required to test the
proposed approach and for drawing any conclusion
on reducing size-related returns.
We perform a training-test split and use the first
year of data [June 2021 - May 2022] for parameter op-
timization as outlined in Section 4.1.3 and the second
year [June 2022 - May 2023] for the results presented
in Section 4.1.4. MultiFlags is tested experimentally
by running the algorithm on the second year of histor-
ical data (holdout set), where the results of the refer-
ence model SizeFlags (Nestler et al., 2021) are also
known.
4.1.2 Evaluation Method DiD
Given the lack of a ground truth, the causal effect of
showing size advice to customers can only be cap-
tured through the relative reduction of size-related
returns (srr
red
) of the two approaches. The nearest
neighbor Difference-in-Differences (DiD) approach
of Nestler et al. (Nestler et al., 2021) is used as
a quasi-experimental signal of the srr
red
by a flag.
This method, originally presented in Heckmann et
al. (Heckman et al., 2019), compares the srr
red
for
articles which received a flag against similar articles
which did not receive a flag over a time frame of 6
weeks before and after raising the flag. We aggre-
gate the srr
red
to calculate the number of saved re-
turns per article. It is important to note, that srr
red
cannot be calculated with DiD for all flags M (θ) that
are raised by MultiFlags with fixed threshold θ, as
M (θ) includes new flags for which no historical re-
sults exist. It is, however, possible to calculate the
srr
red
for all SizeFlags (Nestler et al., 2021) S that
have already been shown to the customers. It follows
that srr
red
can be calculated for the two subsets Same
= S ∩ M (θ) and Dropped = S \ M (θ). The addi-
tional flags for which we cannot calculate the srr
red
via the DiD method are denoted by Added and are
A/B tested in Section 4.2. The sets are illustrated in
Figure 3.
4.1.3 Threshold Optimization on Training Set
The practical approach outlined here focuses on deter-
mining θ for comparing the proposed approach with
SizeFlags (Nestler et al., 2021) . We use the data over
a period of one year [June 2021 - May 2022] and find
the best value which satisfies two constraints:
(i) θ ∈ [0.5, 1], which corresponds to the probabil-
ity that the true size-related return rate srr
⋆
k
(a) is
within the respective zone is above the threshold
of 0.5, i.e. P
k
≥ 0.5, k ∈ {ts,tb, c f , tts}, with P
k
from equation (11).
(ii) Find θ as such that the overall srr rate
srr
red
(M (θ)) is reduced as much as possible.
Choosing a high value of θ implies that MultiFlags
M (θ) raises flags only when it is very confident about
the prediction. With θ
⋆
= 1, M (θ) raises only ≈ 5K
tb and ts flags, which is ≈ 30 times less than the num-
ber of flags raised by SizeFlags (Nestler et al., 2021)
MultiFlags: A Probabilistic Framework for Article-Based Size Advice in Fashion E-Commerce
319
S in the same timeframe. Therefore, to find the opti-
mal value of θ, the effectiveness per single flag based
on (i) needs to be balanced vs. the total number of
flags.
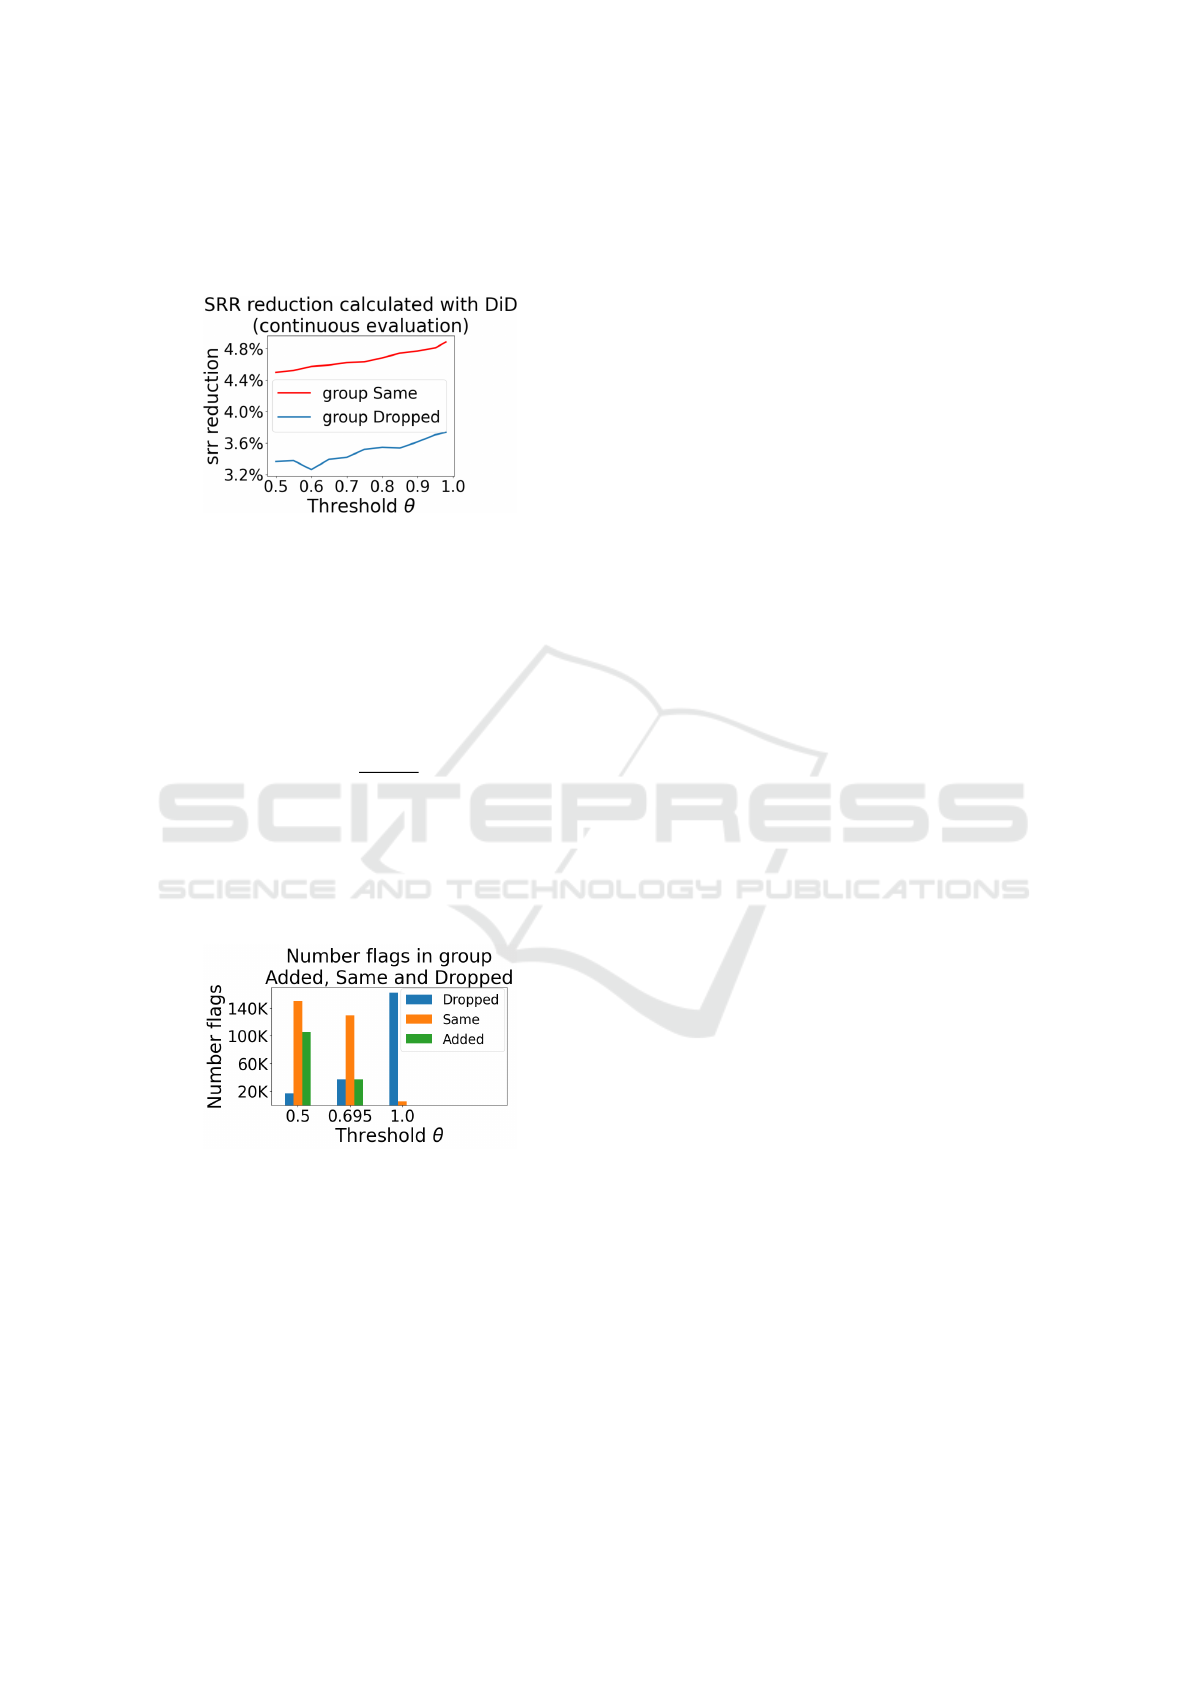
Figure 4: The highest srr reduction is achieved for θ → 1.
Figure 4 shows that for θ ∈ [0.5, 1] the srr reduc-
tion varies only slightly, providing a relatively free
choice of θ value in that range. Given the free choice
of θ in the specified range and in order to be able to
compare S vs. M (θ) on equal footing, we select θ as
such that
1. we achieve a balance between the groups Dropped
and Added (|M (θ)| ≈ |S|) and
2. the flag recall R(θ) =
|Same(θ)|
|S |
should be as large
as possible.
By using grid search, we found θ
⋆
= 0.695 to be
the optimal value, resulting in |M (θ)| ≈ |S| with
the numbers of Dropped and Added balanced (Fig-
ure 5), and the flag recall R(0.695) = 78.2% suffi-
ciently high.
Figure 5: For θ = 0.695 there are as many flags in Added as
in Dropped.
With the resulting θ
⋆
, we also see a first indication
that M (θ
⋆
) performs well on the cold-start problem,
as the necessary number of returns needed to raise a
flag are smaller in the case of S (ˆr
MF
= 161 vs. ˆr
SF
=
165).
4.1.4 Results on Holdout Set
We evaluate MultiFlags M := M (θ) with fixed θ =
0.695 vs. SizeFlags (Nestler et al., 2021) S on the
holdout set. Despite both sets covering all four sea-
sons by choosing one year for the training and the
holdout set each, both sets are slightly different. The
holdout set contains 2.6 million articles, which is
9.3% more than in the training set and the number of
SizeFlags (Nestler et al., 2021) |S | = 176386 is 5.5%
higher than in the training set. With |M | = 193103,
M contains 9.5% more flags than S . M raises
144378 Same flags and achieves a recall of 81.9%
compared to S , showing that it performs equally well
as on the training set. The number of Dropped is
32008 and Added is 48 725. The same DiD approach
is used to calculate the srr
red
. Similar to the train-
ing set, the size-related return reduction of the group
Same with srr
red
= 3.8% is greater than the reduction
of the group Dropped with srr
red
= 2.8% . Lastly,
M requires ˆr
M
= 151 returns to raise a flag versus
ˆr
S
= 166 for S , indicating a more than 10% improve-
ment in terms of speed for M , potentially increasing
the average number of saved returns per item over an
extended period, by offering a flag earlier in the arti-
cle’s life cycle.
4.1.5 New Flags Critical-Fit and True-to-Size
In addition to the results in comparison with the Size-
Flags (Nestler et al., 2021) S baseline, we explore
the results obtained for the new flags offered by Mul-
tiFlags M , critical-fit and true-to-size. M raises
62 408 critical-fit flags on the holdout set. These en-
able new actionable information for customers about
articles with difficult fit and provide new opportuni-
ties for businesses. Note that critical-fit denotes ill fit
of an article, because it does not fit the majority of the
customers, which is a problem that can be addressed
in several ways. Depending on the criticality of the
fit issue, businesses can, for instance, down-sort the
article in it’s catalog views, exclude the articles from
discovery, communicate the article to brands for their
improvement, or ultimately remove the article from
the assortment. M raised 159 411 true-to-size flags,
which enable high confidence for customers when se-
lecting a size; contrary to the articles with a critical-fit
flag, businesses are able to up-sort such articles in the
article ranking shown to the customers.
4.2 A/B Test Evaluation Against
Article-Based Size Advice
The flags added by the M approach have been A/B
tested against S . As those flags are added, it’s an
A/B test where a flag from M shown to the treat-
ment group is compared to the same article without
a flag from S shown to the control group. The A/B
test was performed November 2023 to January 2024
KDIR 2025 - 17th International Conference on Knowledge Discovery and Information Retrieval
320

in the whole textile category with more than 132 000
customers and 150 000 orders per group from 12 dif-
ferent countries. The A/B test demonstrated that the
size-related return rate was significantly reduced by
M (−4.5% relative change, p-value < 0.001). The
biggest impact was observed in the category of full
body garments (e.g. dresses and tracksuits; −7.3%),
followed by upper garments (e.g. shirts and pullovers;
−3.6%) and lower garments (e.g. pants and skirts;
−2.1%). The A/B test also showed an increase in se-
lection orders (in which a customer orders multiple
sizes of the same article; +4.4%) for the treatment
group and a reduction of cost-intensive re-orders (in
which a customer returns an article and re-orders in a
different size; −6.3%).
Table 1: Added flags by MultiFlags M show the strongest
srr reduction.
Group Dropped Same Added
Evaluation DiD DiD A/B test
Dataset Holdout Holdout Production
Srr reduction 2.8% 3.8% 4.5%
The results of Section 4.1 and 4.2 are summa-
rized in Table 1. The DiD results show that the flags
dropped by M have a clearly lower srr reduction than
Added and Same. We highlight that for the sake of
this study we chose a single global θ such that the
number of flags each method raises is roughly equal.
Within this context it is important to note that though
Dropped have a positive srr reduction (as estimated
by DiD), Added have an even larger srr reduction (as
estimated by the A/B test), and consequently for the
same number of flags we expect a higher overall srr
reduction by M . Furthermore, if we wish to reduce
the number of Dropped flags, this can be achieved
by lowering the θ parameter or even having differ-
ent θ
k
for each flag k. The choice here depends,
amongst other considerations, on the aggressiveness
of the strategy.
4.3 Complementary Effects with
Personalized Size Recommendations
MultiFlags M requires only article-level information
and as such it is available for all customers shopping
that flagged article without limitations or needs with
respect to customer data. In contrast, size recom-
menders leverage the combined data from both cus-
tomers and articles and as such are only available to
customers from whom the size matching optimization
given an article is confidently achieved thanks to a
pre-requisite depth level in the customer data. In other
words, M marks only those articles with a sizing flag
that exhibit a systemic sizing behavior (e.g., articles
that run too large) and enables all customers to im-
prove their sizing choices on those articles and reduce
sizing returns. However, most articles display regular
sizing behavior. This is precisely where size recom-
menders play a crucial role: providing customers with
personalized size advice when no size flag is avail-
able, ensuring comprehensive size guidance through-
out the product catalog. This indicates that both ap-
proaches are not interchangeable but rather comple-
mentary solutions, which will be the subject of future
work.
5 CONCLUSION
A probabilistic framework was presented to build
theoretically motivated article-based size advice so-
lutions, with a confidence measure for the raised
flags. This framework enables the true-to-size and
critical-fit flags, which can be leveraged in practical
approaches for businesses. With empirical results,
the strengths of the approach were shown: the pro-
posed approach reduces size-related returns signifi-
cantly more than SizeFlags (Nestler et al., 2021) base-
line. Fewer returns save the customer time as the
return process can be time consuming and also im-
prove sustainability and environmental footprint. Fu-
ture work involves experimenting with different prior
setups for including more signals (e.g., leveraging
sentiment analysis of reviews, leveraging LLMs to
gather richer return information) and developing the
approach into hierarchical recommender system.
REFERENCES
(2019/2020). Asos operational carbon report.
(2022). Fourth workshop on recommender systems in fash-
ion.
Abdulla, G. M. and Borar, S. (2017). Size recommendation
system for fashion e-commerce. In Machine Learning
Meets Fashion Workshop at ACM SIGKDD Confer-
ence on Knowledge Discovery and Data Mining.
Abdulla, G. M., Singh, S., and Borar, S. (2019). Shop your
right size: A system for recommending sizes for fash-
ion products. In Companion Proceedings of The 2019
World Wide Web Conference.
Baier, S. (2019). Analyzing customer feedback for product
fit prediction. arXiv.
Bhatnagar, B. L., Tiwari, G., Theobalt, C., and Pons-Moll,
G. (2019). Multi-garment net: Learning to dress 3d
people from images. In Proceedings of the IEEE/CVF
International Conference on Computer Vision.
MultiFlags: A Probabilistic Framework for Article-Based Size Advice in Fashion E-Commerce
321

C, R. (2014). How Fashion Ecommerce Retailers Can Re-
duce Online Returns. Econsultancy.
Choi, T.-M. (2016). Analytical Modeling Research in Fash-
ion Business. Springer.
Dogani, K., Tomassetti, M., Vargas, S., Chamberlain, B. P.,
and Cnudde, S. D. (2019). Learning embeddings for
product size recommendations. In eCOM@SIGIR.
Dong, H., Liang, X., Shen, X., Wang, B., Lai, H., Zhu, J.,
Hu, Z., and Yin, J. (2019). Towards multi-pose guided
virtual try-on network. In 2019 IEEE/CVF Interna-
tional Conference on Computer Vision (ICCV), pages
9025–9034.
Guigour
`
es, R., Ho, Y. K., Koriagin, E., Sheikh, A.-S.,
Bergmann, U., and Shirvany, R. (2018). A hierarchi-
cal Bayesian model for size recommendation in fash-
ion. In Proceedings of the 12th ACM Conference on
Recommender Systems, pages 392–396. ACM.
Hajjar, K., Lasserre, J., Zhao, A., and Shirvany, R. (2020).
Attention gets you the right size and fit in fashion. In
14th Conference on Recommender Systems. ACM.
Han, X., Wu, Z., Wu, Z., Yu, R., and Davis, L. S. (2018).
Viton: An image-based virtual try-on network. In Pro-
ceedings of the IEEE conference on computer vision
and pattern recognition, pages 7543–7552.
Heckman, J., Ichimura, H., and Todd, P. (2019). Match-
ing as an econometric evaluation estimator: Evidence
from evaluating a job training programme. The Re-
view of Economic Studies, 64(4):605–654.
Hidayati, S. C., Hsu, C.-C., Chang, Y.-T., Hua, K.-L., Fu,
J., and Cheng, W.-H. (2018). What dress fits me best?
fashion recommendation on the clothing style for per-
sonal body shape. In 26th ACM International Confer-
ence on Multimedia.
Hsiao, W.-L. and Grauman, K. (2020). Vibe: Dressing for
diverse body shapes. In Computer Vision and Pattern
Recognition.
Issenhuth, T., Mary, J., and Calauz
`
enes, C. (2019).
End-to-end learning of geometric deformations of
feature maps for virtual try-on. arXiv preprint
arXiv:1906.01347.
Jaradat, S., Dokoohaki, N., Pamp
´
ın, H. J. C., and Shirvany,
R. (2022). Fashion Recommender Systems, pages
1015–1055. Springer US, New York, NY.
Karessli, N., Guigoures, R., and Shirvany, R. (2019).
SizeNet: Weakly supervised learning of visual size
and fit in fashion images. In Proceedings of the IEEE
Conference on Computer Vision and Pattern Recogni-
tion Workshop.
Lasserre, J., Sheikh, A.-S., Koriagin, E., Bergmann, U.,
Vollgraf, R., and Shirvany, R. (2020). Meta-learning
for size and fit recommendation in fashion. In SIAM
International Conference on Data Mining (SDM20).
Lefakis, L., Koriagin, E., Lasserre, J., and Shirvany,
R. (2021). Towards user-in-the-loop online fashion
size recommendation with low cognitive load. In
Dokoohaki, N., Jaradat, S., Corona Pamp
´
ın, H. J., and
Shirvany, R., editors, Recommender Systems in Fash-
ion and Retail, pages 59–76, Cham. Springer Interna-
tional Publishing.
Misra, R., Wan, M., and McAuley, J. (2018). Decompos-
ing fit semantics for product size recommendation in
metric spaces. In Proceedings of the 12th ACM Con-
ference on Recommender Systems, RecSys ’18, New
York, NY, USA.
Nestler, A., Karessli, N., Hajjar, K., Weffer, R., and Shir-
vany, R. (2021). SizeFlags: Reducing size and fit re-
lated returns in fashion e-commerce. In Proceedings
of the 27th ACM SIGKDD Conference on Knowledge
Discovery & Data Mining.
Pang, K., Zou, X., and Wong, W. (2024). Learning visual
body-shape-aware embeddings for fashion compati-
bility. In Proceedings of the IEEE/CVF Winter Con-
ference on Applications of Computer Vision (WACV),
pages 8056–8065.
Patel, C., Liao, Z., and Pons-Moll, G. (2020). Tailor-
net: Predicting clothing in 3d as a function of human
pose, shape and garment style. In Proceedings of the
IEEE/CVF Conference on Computer Vision and Pat-
tern Recognition.
Pecenakova, S., Karessli, N., and Shirvany, R. (2022). Fit-
gan: Fit- and shape-realistic generative adversarial
networks for fashion. In 26th International Confer-
ence on Pattern Recognition (ICPR) 2022. arXiv.
Sembium, V., Rastogi, R., Saroop, A., and Merugu, S.
(2017). Recommending product sizes to customers.
In Proceedings of the Eleventh ACM Conference on
Recommender Systems, RecSys ’17, New York, NY,
USA.
Sembium, V., Rastogi, R., Tekumalla, L., and Saroop, A.
(2018). Bayesian models for product size recommen-
dations. In Proceedings of the 2018 Web Conference.
ACM.
Sheikh, A.-S., Guigour
`
es, R., Koriagin, E., Ho, Y. K., Shir-
vany, R., and Bergmann, U. (2019). A deep learn-
ing system for predicting size and fit in fashion e-
commerce. In Proceedings of the 13th ACM Confer-
ence on Recommender Systems. ACM.
Yuan, Y., Park, M.-J., and Huh, J.-H. (2021). A proposal for
clothing size recommendation system using chinese
online shopping malls: The new era of data. Applied
Sciences, 11(23).
KDIR 2025 - 17th International Conference on Knowledge Discovery and Information Retrieval
322
