
A Generalized Valuation Method for Team Defense
by Estimating Probabilities in Football Games
Rikuhei Umemoto
1
, Kazushi Tsutsui
2
and Keisuke Fujii
1 a
1
Graduate School of Informatics, Nagoya University, Japan
2
Graduate School of Arts and Sciences, The University of Tokyo, Japan
Keywords:
Machine Learning, Soccer, Spatiotemporal Data, Prediction.
Abstract:
Analyzing team defense in soccer is challenging due to limited labeled data. Some previous methods for
evaluating soccer defenses were based on the prediction of defensive events using the locations of all players
and the ball. However, they did not consider the importance of multiple events and assumed perfect observation
of all 22 players, which is not open-source, with a larger amount for learning the classifier. In this paper, we
propose a generalized valuation method for defensive teams by score-scaling the predicted probabilities of
events, including gaining possession of the ball and being attacked. Our method can be applied to the open-
source location data of all players in frames from broadcast video of events, such as football games from Euro
2020, by investigating the effect of the number of players on event prediction performance. Our validation
results using Euro 2020 data show that event prediction accuracy can be maintained with a limited number
of player features for scoring, conceding, gaining the ball, and effective attacks. Additionally, our defensive
metric effectively explains the defensive characteristics and strengths of the top four teams in the tournament,
while also highlighting the reasons why some teams received poor defensive evaluations. Our approach offers
a practical way to analyze and evaluate team defenses even with self-recorded or broadcast videos.
1 INTRODUCTION
With advancements in measurement and information
processing technologies, the soccer community has
enabled data-driven evaluations and analyses of team
performances. For instance, xG, which represents
the probability that a shot will result in a future
goal, has become widely recognized not only among
researchers (Pollard and Reep, 1997; StatsPerform,
2012) but also in popular media, where it is used to
assess team performance (SkySports, 2024). How-
ever, it presents significant challenges due to the con-
tinuous movement of players and the ball throughout
the game, as well as the infrequency of critical events
such as goals (for a comprehensive review, see (Fujii,
2021; Fujii, 2025)).
Data plays a crucial role in conducting practical
analysis and evaluation of game performance analyt-
ics. Two primary types of data are commonly used in
this field. The first is tracking data, which records the
positions of all players throughout the entire match.
This data enables the creation of performance metrics
that consider the movements of off-ball players (Fer-
a
https://orcid.org/0000-0001-5487-4297
nandez and Bornn, 2018; Llana et al., 2020; Nakahara
et al., 2023; Spearman, 2018; Teranishi et al., 2022)
and the relationships between players with some deep
neural network methods (Anzer et al., 2022; Mehrasa
et al., 2018; Rahimian et al., 2023; St
¨
ockl et al., 2021;
Wang et al., 2024). However, tracking data is of-
ten private or requires purchase, making it inacces-
sible for amateur teams and individuals with limited
financial resources. The second type is event data,
which records information about specific events, such
as passes or shots, and typically includes details about
the player in possession of the ball at the time. Since
much of this data is publicly available, many stud-
ies have used event data to develop evaluation metrics
(Decroos et al., 2019; Liu et al., 2020; Pappalardo
et al., 2019; Rudd, 2011; Simpson et al., 2022; Yeung
et al., 2025). However, since the actions of the ball
carrier depend on their relationships with both team-
mates and opponents without the ball, it is challeng-
ing to accurately evaluate the team solely based on
information about the ball carrier.
In 2021, StatsBomb Inc. introduced StatsBomb
360 data, which includes event and ball handler infor-
mation, as well as the coordinates of players visible in
Umemoto, R., Tsutsui, K. and Fujii, K.
A Generalized Valuation Method for Team Defense by Estimating Probabilities in Football Games.
DOI: 10.5220/0013706900003988
Paper published under CC license (CC BY-NC-ND 4.0)
In Proceedings of the 13th International Conference on Sport Sciences Research and Technology Support (icSPORTS 2025), pages 79-89
ISBN: 978-989-758-771-9; ISSN: 2184-3201
Proceedings Copyright © 2025 by SCITEPRESS – Science and Technology Publications, Lda.
79

Figure 1: Overview of our approach. Spatial features describing attackers, defenders, and ball movements feed a classifier,
which outputs the probabilities of scoring, conceding, gaining possession, and being attacked. We validated these classifiers
by examining the impact of the number of player-related features. We also evaluated defensive team evaluations by the
GVDEP formulation. GVDEP generalizes the defensive evaluation method (Toda et al., 2022) by weighting its values with
the VAEP, focusing on the probabilities of scoring and conceding goals (Decroos et al., 2019).
broadcast footage at the time of the event. Available
as open data for specific competitions, this dataset
bridges some gaps: it is more accessible than track-
ing data and richer in player information than event
data, potentially leading to increased research lever-
aging this resource. However, since this dataset was
only recently made available, studies utilizing it have
been still limited (Rahimian et al., 2022; Robberechts
et al., 2023; Umemoto and Fujii, 2023; Yeung and Fu-
jii, 2024). Moreover, compared to complete tracking
data, StatsBomb 360 provides fewer details on player
coordinates, making it necessary to examine how this
difference in data volume impacts tasks such as ma-
chine learning-based predictions.
Additionally, most analysis and evaluation meth-
ods in soccer focus on attackers, with few address-
ing defense, as defensive statistics (e.g., tackles) are
often limited, making it challenging to define eval-
uation targets. Previous studies have evaluated de-
fensive actions, such as pressing effectiveness based
on expected goal-scoring opportunities (Robberechts,
2019), using event data. (Toda et al., 2022) developed
Valuing Defense by Estimating Probabilities (VDEP)
to assess team defense using tracking data, focusing
on the predicted probabilities of gaining possession
and preventing effective attacks. However, VDEP has
two main limitations: (1) it weights ball recovery and
effective attacks by event frequency rather than event
importance; and (2) it assumes access to complete
player location data, leaving the impact of missing
player data unclear.
To address these limitations, we examine how the
number of player features affects the performance of
a classification model, using UEFA EURO 2020 data
publicly provided by StatsBomb Inc. (UK). We also
introduce Generalized Valuing Defense by Estimating
Probabilities (GVDEP). This method offers a compre-
hensive evaluation of team defense by weighting the
predicted probabilities of ball recovery and effective
attacks with those of goals scored and conceded (De-
croos et al., 2019). Using this evaluation method, we
analyze the defenses of teams that advanced to Round
16 in the tournament.
The main contributions of this study are as fol-
lows: (i) We generalize the previous method of valu-
ating team defenses (Toda et al., 2022) by incorporat-
ing a weighting system based on the predicted proba-
bilities of goals scored and conceded (Decroos et al.,
2019). We adjust the evaluation of defensive pro-
cesses by considering the impact of their actions on
the action evaluation metric, using the probabilities of
goals and concedes. (ii) We verified the classification
performance of the machine learning model under
varying levels of available player data, applying our
method to open-source, partially observed tracking
data. The models’ classification accuracy remained
robust even when using information from only a sub-
set of players near the ball. (iii) Our method success-
fully evaluated the defensive characteristics of the top
four teams at UEFA EURO 2020, providing insight
into why specific teams performed well or poorly in
defense. Our approach will enhance our understand-
ing of team defenses, even for the public data.
2 METHODS
In this section, we provide an overview of our ap-
proach, as illustrated in Figure 1. First, we describe
the dataset we used. Second, we define the input fea-
icSPORTS 2025 - 13th International Conference on Sport Sciences Research and Technology Support
80

tures and objective variables for classifiers. Third, we
describe the training of a classifier for event predic-
tion. Fourth, we validate our method by examining its
impact on the number of player features. Lastly, we
propose our method, GVDEP, for valuing team de-
fenses.
2.1 Datasets
In this study, we utilized an open-access dataset pro-
vided by StatsBomb Inc. (UK), which contains data
from all 51 matches of UEFA EURO 2020. It is avail-
able at: https://github.com/statsbomb/open-data.
The dataset for this tournament consists of two main
types of data. The first is event data, which includes
labels for specific events (e.g., passes, shots), along
with the xy-coordinates of the ball at the start and
end of each event. This kind of event data is widely
used in academic research for performance analy-
sis in soccer (Decroos et al., 2019; Gregory et al.,
2022). The second type is 360 data, which provides
the xy-coordinates of all visible players in the broad-
cast video frame at the time each event occurred. Note
that the 360 data may not capture the position of all
22 players at all times, as the broadcast camera does
not always cover the entire field during live soccer
matches.
We constructed a data frame from the dataset for
validation and evaluation purposes. Following the
format of SPADL (Soccer Player Action Description
Language), which offers a standardized format for de-
scribing soccer events on an event-by-event basis (De-
croos et al., 2019), we documented the position of the
ball, the player involved, the type of action, and the
outcome of each event. Since the StatsBomb dataset
includes the xy-coordinates of the ball and some play-
ers, we incorporated additional SPADL columns to
capture player positional information. To enable a
more detailed analysis of team defense, we classified
players as attackers or defenders based on their ac-
tions and ordered them by proximity to the ball. Ad-
ditionally, we refined the ‘foul‘ action type in SPADL
format by categorizing it into ‘offensive foul‘ (com-
mitted by attackers) and ‘defensive foul‘ (committed
by defenders) to provide a more nuanced defensive
evaluation. The remaining action types were defined
according to the format. Ultimately, we identified 21
action types, including pass, tackle, and clearance,
among others. As a result of these processes, a to-
tal of 113,080 events were used in this study, creating
a data frame where each event included a median of 4,
mode of 4, and mean of 4.58 players for attackers and
a median of 3, mode of 1, and mean of 4.21 players
for defenders in each event.
2.2 Definition of Features and Objective
Variables
Here, we define the explanatory and objective vari-
ables used in our machine-learning model and defen-
sive evaluation for the classification task. Table 1 and
2 provide specific definitions for each variable.
First, we define the explanatory variables based
on previous studies (Decroos et al., 2019; Toda et al.,
2022). In the data frame created in the last subsection,
let s
i
represent the state at the ith event. From s
i
, we
derive the following features: a
i
for the action type,
bp
i
for the body part involved in the action, b
i
for
the ball positions and movements, and pl
i
for player-
related information. Additionally, we exclude penalty
shootout events from the feature creation process.
Next, we define the objective variables, which
indicate whether certain key events, such as a goal
scored, a goal conceded, a ball gain, and an effective
attack, occurred within a specified number of subse-
quent events. These labels represent scores, concedes,
gains, and effective attacks, respectively. The first
two variables are labeled based on their occurrence
within ten events after an event occurred, and are used
to calculate the probabilities of these variables (De-
croos et al., 2019). In contrast, the last two are labeled
based on their occurrence within five events after an
event occurred, and are used to calculate the probabil-
ities of these (Toda et al., 2022). As a result, out of
113,080 events in the dataset, 1,209 were labeled as
scores, 211 as concedes, 4,601 as gains, and 16,116
as effective attacks.
2.3 Training of Classifiers for Event
Prediction
Our approach is based on the classifiers for multiple
event prediction. Here we outline the setup for train-
ing the models.
First, we employed XGBoost (Chen and Guestrin,
2016) as the machine learning classification model.
XGBoost is a gradient boosting decision tree model
(Friedman, 2001) that emphasizes scalability and
computational efficiency. It includes regularization
to reduce overfitting and can handle missing values,
making it suitable for large datasets with sparse fea-
tures. In this study, most missing values were related
to player coordinates, which vary over time. To avoid
assigning a default direction for missing values in the
decision tree, we replaced these missing values with
predefined values, as described in Table 1.
A Generalized Valuation Method for Team Defense by Estimating Probabilities in Football Games
81

Table 1: Definitions of explanatory variables.
Variable Description Examples of values
a
i
One-hot encoded type of action taken
at the i-th event.
pass, tackle, shot, cross, defensive foul.
bp
i
One-hot encoded body part involved
at the i-th event.
foot, foot right, foot left, head, and other.
b
i
Ball position and movement characteristics
at the i-th event.
rectangular and polar coordinates (start
and end), distance traveled, and change
in xy-coordinates (11 dimensions).
pl
i
Player position and relative distance
to the ball at the i-th event.
xy-coordinates, distance to the ball,
and angle to the ball (4 dimensions per player).
If data is missing, we set the x-coordinate
to -105, the y-coordinate to -68, the distance
to 0, and the angle to 0.
Table 2: Definitions of objective variables.
Variable Description Values
scores
An indicator of whether a goal was scored
within the next 10 events (Decroos et al., 2019).
Binary (1 if scores, 0 if not).
concedes
An indicator of whether a goal was conceded
within the next 10 events (Decroos et al., 2019).
Binary (1 if concedes, 0 if not).
gains
An indicator of whether a team gained the ball
within the next five events, such as tackle and
offside (Toda et al., 2022).
Binary (1 if gains, 0 if not).
effective attacks
An indicator of whether an effective attack,
defined as entry into the opponent’s penalty area
or a shot taken, occurred within the next five
events (Toda et al., 2022).
Binary (1 if effective attacks, 0 if not).
2.4 Validation of the Classifiers
This subsection outlines the methodology used to val-
idate the impact of the number of player-related fea-
tures on the classification models.
First, as a performance test, we conducted a 5-fold
cross-validation (Fujii et al., 2018; Toda et al., 2022)
because the total number of events in the dataset was
relatively small (113,080). To achieve this, we ran-
domly divided all 51 UEFA EURO 2020 matches
into five subsets, each containing a similar number of
matches (four subsets with ten games and one sub-
set with 11 games). For each iteration, one subset
was used as the test dataset, and the remaining sub-
sets were used as the training dataset; this process was
repeated across all five subsets. As a result, the fre-
quency of the objective variables—scores, concedes,
gains, and effective attacks—in a typical training and
test dataset split (example from the first fold) is shown
in Table 3. As can be seen from this table, the data ob-
tained by this operation was extremely imbalanced,
with far fewer positive examples than negative exam-
ples. However, in this study, we did not employ over-
sampling or other measures to maintain the robust-
Table 3: The frequency of the objective variables in a typ-
ical training and test dataset split (example from the first
fold).
Set Variable Positive Negative
Training scores 975 87,424
concedes 155 88,244
gains 3,572 84,827
effective attacks 12,897 75,502
Test scores 234 24,447
concedes 56 24,625
gains 1,029 23,652
effective attacks 3,219 21,462
ness of the XGBoost model to imbalanced data, en-
suring comparability with existing studies (Decroos
et al., 2019; Toda et al., 2022).
Next, to investigate the impact of player-related
features, we varied the number of pl
i
features by in-
cluding 0, 1, ..., and up to 11 players (attackers and
defenders) in order of proximity to the ball. We de-
fined the number of attackers and defenders included
as n nearest. Specifically, when n nearest = 0, only a
i
,
bp
i
, and b
i
were used as inputs, with no player-related
icSPORTS 2025 - 13th International Conference on Sport Sciences Research and Technology Support
82

features pl
i
. When n nearest = 1, we included the pl
i
features (4 × 2 dimensions) for the nearest attacker
and defender to the ball. For each value of n nearest,
we performed 5-fold cross-validation and calculated
summary statistics.
Following previous studies (Decroos et al., 2019;
Robberechts, 2019; Toda et al., 2022), we used the
Brier score, ROC AUC, and F1 score as evaluation
metrics for the validation. The Brier score measures
the accuracy of predicted probabilities by comparing
them to the actual outcomes. The ROC AUC repre-
sents the area under the Receiver Operating Charac-
teristic curve, which plots the true positive rate against
the false positive rate for binary classification. Fi-
nally, the F1 score, the harmonic mean of Precision
and Recall, was chosen to validate better classifica-
tions of true positives, which were relatively few in
this study. Furthermore, as explained above, the data
used in this study were class-imbalanced, with a mini-
mal number of positive examples; therefore, this eval-
uation metric was employed to achieve a balanced
evaluation. For each value of n nearest, we performed
5-fold cross-validation, calculated these metrics for
the 5 test data.
2.5 GVDEP: Valuation of Team
Defenses
This subsection describes our proposed method:
GVDEP for valuing team defenses. The previous
study weighted the probabilities of gains and effec-
tive attacks based on the ratio of each event’s fre-
quency (Toda et al., 2022). In contrast, our proposed
method weighted these probabilities using each VAEP
value (Decroos et al., 2019), which is one of the of-
fensive evaluation metrics. This approach enabled a
more data-driven weighting system, aiming to eval-
uate whether defensive events effectively contributed
to subsequent offensive plays. Additionally, VDEP
evaluated the defensive process using the probabili-
ties at a single event point. However, in GVDEP, we
assessed the defensive process by calculating the dif-
ference between the probabilities at a given point and
the previous point, thereby emphasizing changes in
defensive dynamics more effectively.
We define key terms and derivation methods be-
fore explaining VDEP and GVDEP. For the state s
i
at
the ith event, we denoted the occurrence probabilities
of the four target events (scores, concedes, gains, and
effective attacks) as P
scores
(s
i
), P
concedes
(s
i
), P
gains
(s
i
),
and P
attacked
(s
i
). Here, we used ‘attacked’ instead
of ‘effective attacks’ to consider the probability from
a defensive perspective. Following these definitions,
the VDEP value (V
vdep
) at ith event was expressed us-
ing P
gains
(s
i
) and P
attacked
(s
i
) as follows (Toda et al.,
2022):
V
vdep
= P
gains
(s
i
) −C ∗ P
attacked
(s
i
), (1)
where C represented the frequency ratio between
gains and attacked. However, this formulation did not
account for the relative importance of these events,
making it challenging to evaluate changes in the de-
fensive process.
To address this, we propose GVDEP, a method
that weights VDEP using VAEP, an offensive evalua-
tion metric (Decroos et al., 2019). First, for P
gains
(s
i
)
and P
attacked
(s
i
), we calculate the change between the
ith event state s
i
and the (i − 1)th event state s
i−1
in
each probability as follows to track the defensive pro-
cess:
∆P
gains
(s
i
) = P
gains
(s
i
) − P
gains
(s
i−1
), (2)
∆P
attacked
(s
i
) = −(P
attacked
(s
i
) − P
attacked
(s
i−1
)).
(3)
In addition, we define the weights for P
gains
and
P
attacked
as w
gains
and w
attacked
, respectively, as fol-
lows:
w
gains
=
1
|Ev
gains
|
∑
j∈Ev
gains
V
vaep
(s
j
), (4)
w
attacked
=
−1
|Ev
attacked
|
∑
j∈Ev
attacked
V
vaep
(s
j
), (5)
where each of Ev
gains
and Ev
attacked
is the event
indices of gaining the ball and being effectively
attacked, respectively, in all games, and each of
|Ev
gains
| and |Ev
attacked
| is the total number of the
events in all games. Note that Ev
gains
and Ev
attacked
here refer to events that occurred and were differ-
ent from labels such as gains or attacked that said
they would happen in the future. Moreover, the
VAEP value at the ith event, V
vaep
, is expressed using
P
socres
(s
i
) and P
concedes
(s
i
) as follows (Decroos et al.,
2019):
∆P
scores
(s
i
) = P
scores
(s
i
) − P
scores
(s
i−1
) (6)
∆P
concedes
(s
i
) = P
concedes
(s
i
) − P
concedes
(s
i−1
) (7)
V
vaep
(s
i
) = ∆P
scores
(s
i
) − ∆P
concedes
(s
i
) (8)
Using these, we define the GVDEP value, V
gvdep
(s
i
),
as follows:
V
gvdep
(s
i
) = w
gains
× ∆P
gains
(s
i
)
− w
attacked
× ∆P
attacked
(s
i
).
(9)
Next, we explain how to evaluate team de-
fenses using metrics such as GVDEP. We analyzed
the teams that advanced to Round 16 in UEFA
EURO 2020, with each team evaluated over four
A Generalized Valuation Method for Team Defense by Estimating Probabilities in Football Games
83

matches (three group-stage matches and one Round
16 match). This selection ensured a balanced number
of teams and matches. First, we defined the defen-
sive evaluation metrics, gain value, attacked value,
and gvdep value for each team as expressed in the
following equations:
gain value =
1
|Ev
te
|
∑
j∈Ev
te
∆P
gains
(s
j
), (10)
attacked value =
1
|Ev
te
|
∑
j∈Ev
te
∆P
attacked
(s
j
), (11)
gvdep value =
1
|Ev
te
|
∑
j∈Ev
te
V
gvdep
(s
i
), (12)
where Ev
te
was defined as defending events caused by
team te, and |Ev
te
| was the total number of the events.
In other words, gain value represented the average
change in the probability of gaining the ball during
defense; a higher gain value indicated that the team
was more effective in increasing the likelihood of re-
gaining possession. In contrast, attacked value rep-
resented the average change in the probability of be-
ing effectively attacked; a higher attacked value sug-
gested that the team was more successful in reducing
the probability of conceding effective attacks. Addi-
tionally, gvdep value represented the average V
gvdep
during defense, with a higher gvdep value indicat-
ing better defensive quality according to our proposed
metric.
Using these metrics, we analyzed team defenses
from four perspectives: a comparison of (a) at-
tacked value versus gain value, (b) gvdep value
versus the total number of goals conceded,
(c) gvdep value versus attacked value, and (d)
gain value versus the total number of goals conceded.
(a) was similar to a previous study (Toda et al., 2022)
and indicated whether a team prioritized gaining the
ball over preventing effective attacks. (b) compared
total goals conceded with GVDEP to evaluate defen-
sive effectiveness. (c) examined which term in the
GVDEP formula contributed most to the defensive
evaluation. (d) assessed whether gain value was a
reliable metric of defensive quality based on total
goals conceded.
3 RESULTS
3.1 Validation of Player Features
Figure 2 shows the results of the impact of the number
of player-related features on the classification model
for each label (scores, concedes, gains, and effec-
tive attacks). In this figure, the horizontal axis in-
dicates n nearest, the count of attackers and defend-
ers closest to the ball used in the feature set, and the
vertical axis represents the evaluation metric. Each
box plot reflects the evaluation metric values from
the five test datasets during a 5-fold CV for each
value of n nearest. The Brier Score (Figure 2(a)) re-
mained consistent regardless of changes in n nearest
for all event types. The ROC AUC (Figure 2(b))
also showed no significant variation with different
values of n nearest for scores and effective attacks.
While the concedes exhibited some variance across
the folds, the average score remained unchanged. For
gains, we saw slight improvement when increasing
n nearest from 0 to 1, but no further improvement be-
yond that. The F1 Score (Figure 2(c)) showed simi-
lar trends: no significant changes for scores, a slight
degradation for concedes when n nearest increased
from 0 to 1, but no further changed afterward. How-
ever, for gains, we saw significant improvement when
n nearest increased from 0 to 1 and minor improve-
ment from 5 to 6. For effective attacks, a slight im-
provement was observed when increasing n nearest
from 0 to 1, but no further changes after that.
3.2 Evaluation of the Team Defenses
Figure 3 presents the analysis and evaluation of de-
fensive strategies for the 16 teams that advanced to
Round 16 in UEFA EURO 2020. First, Figure 3(a)
represents gain value and attacked value. Higher x-
values indicate a stronger defensive effort to increase
ball recovery chances, while higher y-values focus
on reducing effective attacks. This figure highlighted
the defensive approaches of England, the runner-up,
and Denmark, a semifinalist, both of which demon-
strated balanced defenses aimed at gaining posses-
sion while limiting effective attacks from opponents.
Italy, the tournament winner, focused more on pre-
venting effective attacks, whereas Spain, a semifinal-
ist, prioritized gaining the ball. Portugal achieved
the highest attacked value, while Spain recorded the
highest gain value. Figure 3(b) shows the x-axis as
the total goals conceded by each team and the y-axis
as the GVDEP value, with lower x-values indicating
fewer goals conceded and higher y-values indicating
stronger defensive performance per GVDEP. The four
semifinalists conceded fewer goals than the tourna-
ment average, and their GVDEP values (a metric in-
troduced in this study) were also above average. In
contrast, Portugal, Germany, and France—eliminated
in Round 16—conceded more goals than average but
still had above-average GVDEP values, with Por-
tugal’s being the highest. This result prompts us
icSPORTS 2025 - 13th International Conference on Sport Sciences Research and Technology Support
84
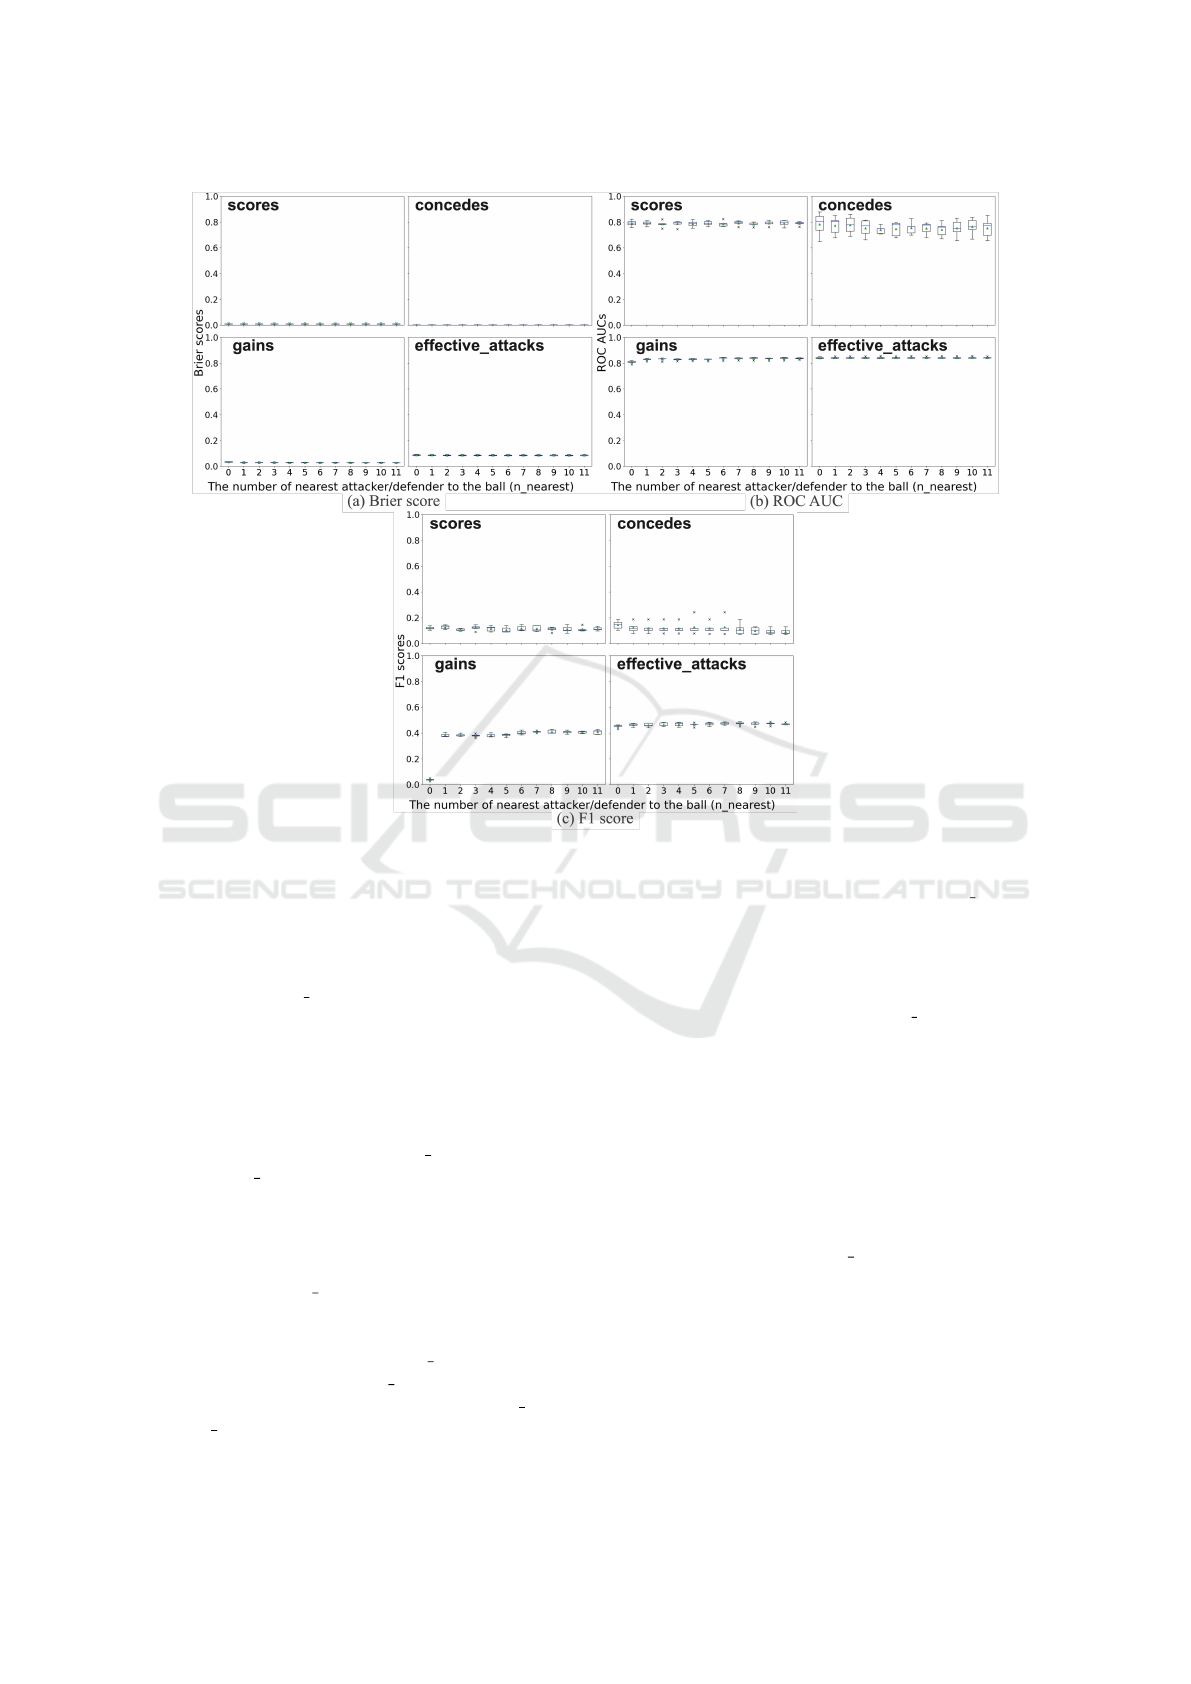
Figure 2: Box-and-whisker plots illustrating the impact of the number of player-related features on classification model
performance for various event types. Each plot displays the distribution of evaluation metrics across five test datasets from
a 5-fold cross-validation. The horizontal axis, labeled ”The number of nearest attacker/defender to the ball (n nearest),”
represents the count of attackers and defenders closest to the ball whose positional features were included in the model,
ranging from 0 (no player features) to 11. The vertical axes represent the performance metrics: (a) Brier score, measuring
prediction accuracy (lower is better); (b) ROC AUC, indicating the model’s ability to distinguish between classes (higher
is better); and (c) F1 score, the harmonic mean of precision and recall, especially useful for imbalanced datasets (higher
is better). For each n nearest value, the box plots show the median (middle line), interquartile range (box), and data range
(whiskers), with individual points representing outliers. Green triangles indicate the mean value for each n nearest.
to explore whether GVDEP significantly affected
P
attacked
(s
i
). Figure 3(c) indicates a strong correla-
tion, as shown by Pearson’s correlation coefficient
(r = 0.9711, p = 4.155 × 10
−10
). This figure rep-
resents that the x-axis is attacked
value, and the y-
axis is gvdep value. Additionally, the weighting val-
ues varied considerably, with w
gains
= 0.009657 and
w
attacked
= −0.02415, underscoring that this method
favored teams like Portugal and Italy that prioritized
preventing effective attacks. Finally, Figure 3(d) ex-
amines whether gain value effectively predicts defen-
sive performance by comparing it with total goals
conceded. The x-axis represents the total goals con-
ceded, and the y-axis shows gain value. Although
Belgium, with the lowest gain value, conceded fewer
goals than Spain, which had the highest gain value,
the gain value tended to worsen as the goals conceded
increased.
4 DISCUSSIONS
In this study, we first examined how the number
of player-related features affected the model perfor-
mance for the four events considered (scores, con-
cedes, gains, and effective attacks). The results,
shown in Figure 2, indicated that including informa-
tion for up to six players (attackers and defenders)
was sufficient to maintain model performance in pre-
dicting future ball possession. Next, we evaluated
the defensive performance of teams that advanced to
Round 16 in UEFA EURO 2020. Figure 3 illustrated
that while the top four teams demonstrated solid de-
fensive characteristics, some teams with higher goal
A Generalized Valuation Method for Team Defense by Estimating Probabilities in Football Games
85
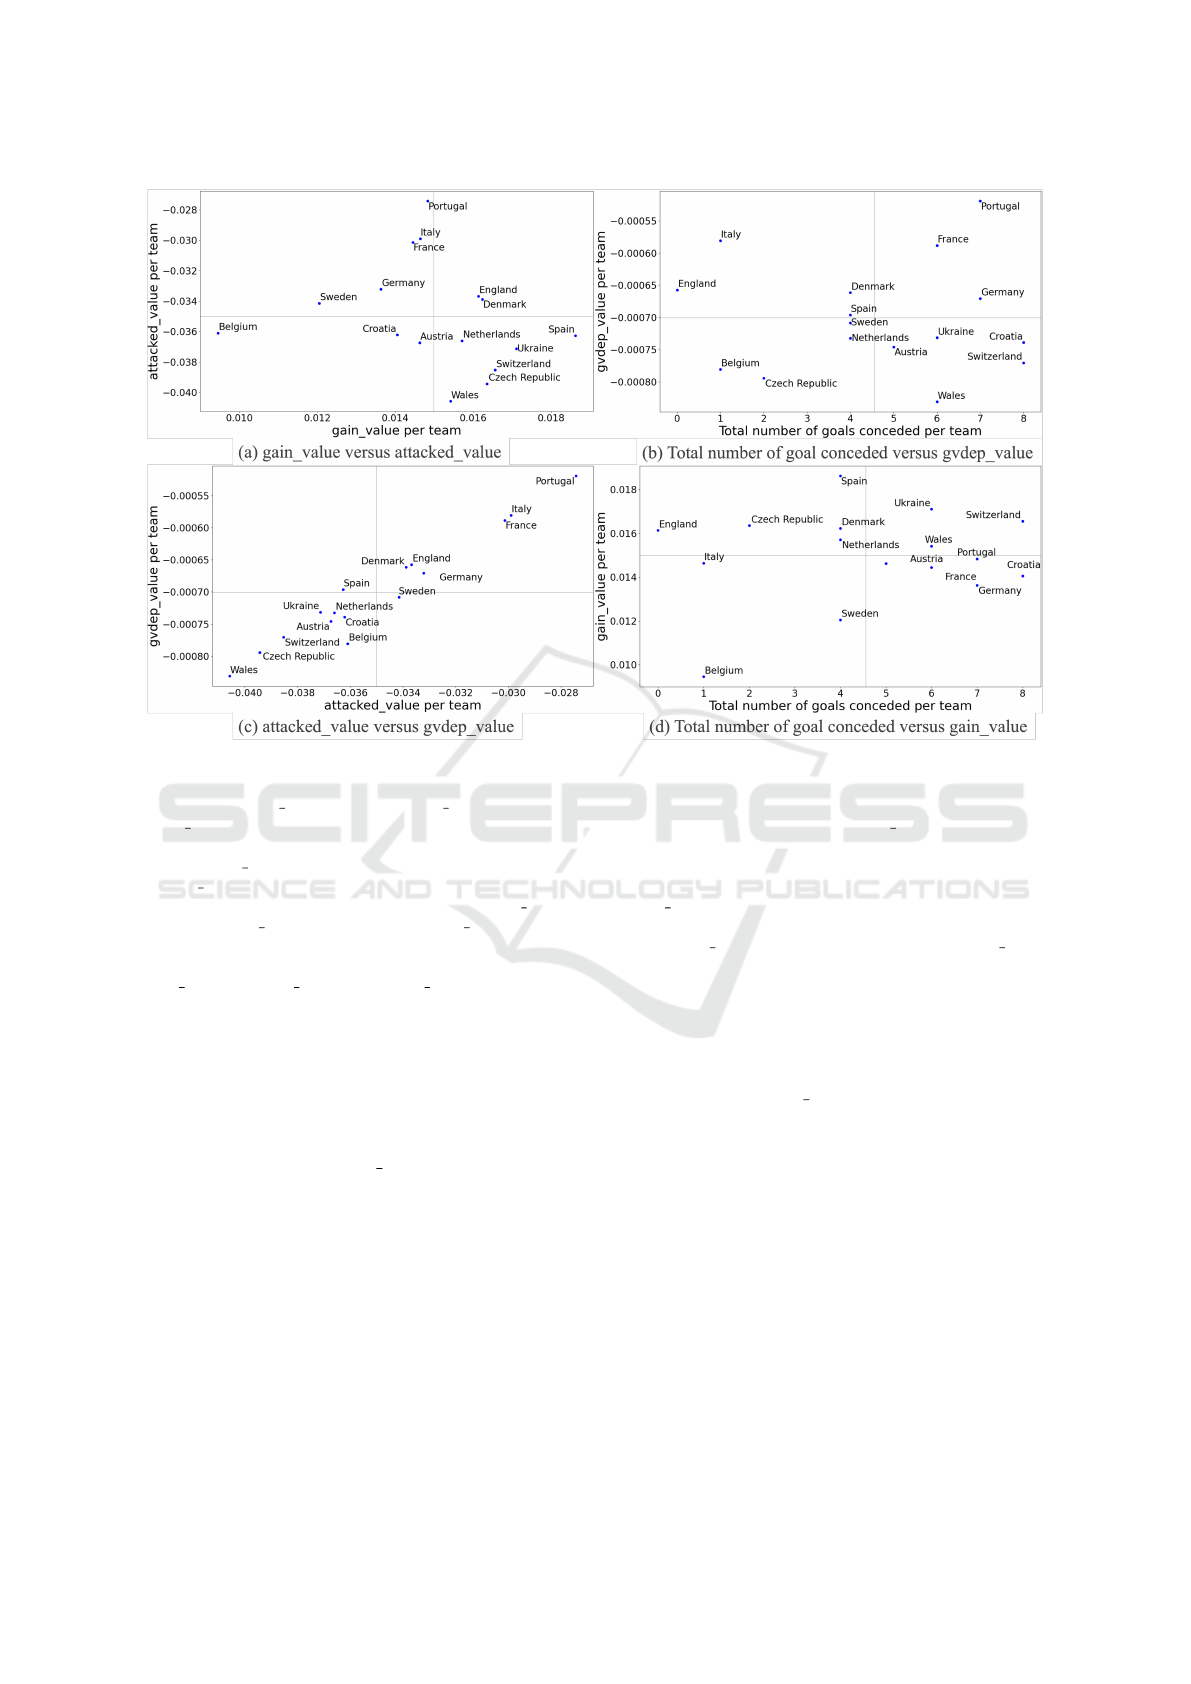
Figure 3: Comprehensive team defensive evaluations for the 16 teams that advanced to the knockout stage in UEFA EURO
2020. These plots illustrate various aspects of defensive performance based on our proposed GVDEP metric and its com-
ponents. (a) gain value versus attacked value: This plot compares a team’s average change in ball recovery probability
(gain value on the x-axis) against its average change in effective attack probability prevented (attacked value on the y-axis).
Higher values in either dimension indicate stronger defensive performance in that aspect. (b) Total number of goals conceded
versus gvdep value: This plot displays the relationship between a team’s total goals conceded (x-axis) and its average V
gvdep
(gvdep value on the y-axis). Lower x-values indicate fewer goals conceded, while higher y-values suggest stronger overall
defensive quality according to GVDEP. (c) attacked value versus gvdep value: This plot examines the correlation between a
team’s attacked value (x-axis) and its gvdep value (y-axis), highlighting which term in the GVDEP formula contributes most
to the defensive evaluation. (d) Total number of goals conceded versus gain value: This plot assesses whether gain value
(y-axis) effectively predicts defensive performance by comparing it with the total number of goals conceded (x-axis). All
gain value, attacked value, and gvdep value metrics represent average changes in probabilities per event for a team, as de-
fined in Subsection 2.5.
concessions also received favorable defensive ratings.
The following sections provide further discussion.
First, this study validated the impact of the num-
ber of players used as features on each classifica-
tion model for the four target events: scores, con-
cedes, gains, and effective attacks. Using 5-fold
cross-validation, we inferred and calculated evalua-
tion metrics on five test datasets. The results show
low Brier scores (Figure 2(a)) and F1 scores (Fig-
ure 2(c)), while ROC AUC values (Figure 2(b)) were
high. This was caused by the label imbalance in the
data used in this study. As shown in Table 3, the target
events were highly imbalanced, with very few posi-
tive instances. This imbalance likely caused the Brier
score and ROC AUC to indicate high model accuracy,
even if the model predicts all outcomes as non-events
(zero). As described in (Decroos et al., 2019; Toda
et al., 2022), the Brier scores and ROC AUC values
similarly showed accuracy. Likewise, the F1 scores
obtained when using n nearest = 11 (with data from
all players) were similar to those reported in (Toda
et al., 2022). Thus, these results were likely due to
data imbalance rather than overfitting.
Lastly, Figure 3(a) shows a trade-off in our team
defensive evaluations between the tendency to gain
possession and the ability to prevent effective attacks,
consistent with previous findings (Toda et al., 2022).
For instance, teams like England and Denmark, which
performed well in the tournament, maintained a bal-
ance between these strategies, keeping their goals
conceded below the average. In contrast, Italy fo-
cused on preventing effective attacks, conceding only
once—from a corner kick—demonstrating a strong
defensive approach.
icSPORTS 2025 - 13th International Conference on Sport Sciences Research and Technology Support
86

Portugal achieved a higher GVDEP value than the
four semi-finalists and, like Italy, emphasized pre-
venting penetration into their penalty area. However,
they conceded seven goals—the third highest among
the Round of 16 teams—likely due to challenging
group-stage matchups against strong teams such as
Germany, France, and Hungary. This intense com-
petition may have contributed to player fatigue. Por-
tugal, Germany, and France, all high-ranking teams in
their group, had high GVDEP values but were elim-
inated in the Round of 16 after conceding multiple
goals.
In contrast, Belgium and the Czech Republic had
relatively low GVDEP values but conceded few goals,
likely due to the strength of their goalkeepers. Cour-
tois and Vacl
´
ık, the goalkeepers for Belgium and the
Czech Republic, respectively, kept clean sheets in
three of their five matches leading up to the quarterfi-
nals (UEFA, 2021). However, since our metric does
not focus on individual player abilities, it cannot cap-
ture the specific contributions of these goalkeepers.
5 CONCLUSIONS
In this study, we proposed GVDEP, a team defense
evaluation metric weighted by goals scored and gen-
eralized to better capture changes in defensive pro-
cesses. In validating the classification models with
different numbers of player-related features, we also
found that only a limited number of player features
were needed for event prediction. This suggests ama-
teur teams can evaluate their defenses using only self-
recorded or broadcast videos. Our analysis also ex-
plained the defensive characteristics and strengths of
the top four teams in UEFA EURO 2020. However,
the results suggested factors outside this metric could
account for why some strong teams conceded more
goals than expected or why weaker teams conceded
fewer.
We present the limitations and future directions
of this study. First, it is essential to consider the
impact of different data sources. In this study, we
validated the models using 360 data, which included
information on players visible in broadcast video
frames during each event. This data has been re-
leased in recent years and remains relatively small
in scale. Due to the volume of data, the results of
cross-validation may be overly optimistic, limiting
the scope of analysis and potentially distorting the in-
terpretation of GVDEP’s sensitivity to defensive per-
formance through survivorship bias. Therefore, test-
ing whether similar validation results can be obtained
using other datasets, such as complete tracking data
for all players, is necessary. In addition, if larger
360 data can be obtained, more rigorous time series
segmentation and comparison, as well as examina-
tion of broader training-testing approaches, can be
considered for future research, along with an eval-
uation of all teams using models trained on other
datasets. Next, we discuss GVDEP itself. Figure
3(c) shows that this metric was heavily influenced by
∆P
attacked
(s
i
). While preventing opponents from en-
tering the penalty area or taking shots is a clear in-
dicator of good defense, effective defense may also
involve quick transitions, such as regaining posses-
sion in the opponent’s half or slowing down the oppo-
nent’s attack by transitioning quickly to a defensive
structure. Future work should explore the compari-
son or integration of metrics for proactive defensive
actions, such as Passes Per Defensive Action (PPDA)
(Trainor, 2014) and Buildup Disruption Percentage
(BDP) (Soccerment, 2022), to provide a more com-
prehensive evaluation that accounts for pressing in-
tensity. Third, GVDEP is primarily an evaluation
metric and does not provide specific actionable in-
sights. While it could be helpful for scouting or re-
cruitment, it does not offer specific guidance on what
players should do during a game or how to prepare
for the next one. Future research should explore met-
rics that offer direct improvement suggestions, such
as evaluating defensive positioning using counterfac-
tuals (Umemoto and Fujii, 2023). Fourth, this study
does not account for defensive evaluations based on
player relationships. Specifically, actions such as
positioning between the passer and receiver to limit
passing lanes or standing between the goal and the at-
tacking player to block shots were only analyzed by
inputting player coordinates, without features indicat-
ing whether players are teammates. Therefore, con-
sidering player, pitch, and ball interactions, it is nec-
essary to develop defensive evaluation metrics. For
instance, this could involve graph neural networks, as
employed in previous studies on pass-receiver predic-
tion (Rahimian et al., 2023).
In conclusion, the GVDEP proposed in this study
offers a nuanced quantitative measure of defensive
performance, holding significant potential for macro-
level decision-making in practical applications. This
includes aiding in scouting by assessing a team’s suit-
ability based on its emphasis on particular defensive
styles, and facilitating tactical analysis to identify a
team’s strengths and weaknesses within specific de-
fensive phases during a match. However, it is crucial
to acknowledge that this study validates GVDEP us-
ing data exclusively from UEFA EURO 2020. Conse-
quently, its generalizability across different leagues,
tournaments, or varying levels of play warrants fur-
A Generalized Valuation Method for Team Defense by Estimating Probabilities in Football Games
87

ther comprehensive investigation. Future research
should actively explore the application of GVDEP to
broader datasets to thoroughly assess its robustness
and adaptability, while also considering necessary ad-
justments for diverse playing styles and unique data
acquisition methodologies inherent to these new con-
texts.
REFERENCES
Anzer, G., Bauer, P., Brefeld, U., and Faßmeyer, D. (2022).
Detection of tactical patterns using semi-supervised
graph neural networks. In 16th MIT sloan sports ana-
lytics conference, pages 1–15.
Chen, T. and Guestrin, C. (2016). Xgboost: A scalable
tree boosting system. In Proceedings of the 22nd acm
sigkdd international conference on knowledge discov-
ery and data mining, pages 785–794.
Decroos, T., Bransen, L., Van Haaren, J., and Davis, J.
(2019). Actions speak louder than goals: Valuing
player actions in soccer. In Proceedings of the 25th
ACM SIGKDD international conference on knowl-
edge discovery & data mining, pages 1851–1861.
Fernandez, J. and Bornn, L. (2018). Wide open spaces: A
statistical technique for measuring space creation in
professional soccer. In Sloan sports analytics confer-
ence, volume 2018.
Friedman, J. H. (2001). Greedy function approximation: a
gradient boosting machine. Annals of statistics, pages
1189–1232.
Fujii, K. (2021). Data-driven analysis for understand-
ing team sports behaviors. Journal of Robotics and
Mechatronics, 33(3):505–514.
Fujii, K. (2025). Machine learning in sports: Open ap-
proach for next play analytics.
Fujii, K., Kawasaki, T., Inaba, Y., and Kawahara, Y. (2018).
Prediction and classification in equation-free collec-
tive motion dynamics. PLoS Computational Biology,
14(11):e1006545.
Gregory, S., Robertson, S., Aughey, R., and Duthie, G.
(2022). The influence of tactical and match context
on player movement in football. Journal of sports sci-
ences, 40(9):1063–1077.
Liu, G., Luo, Y., Schulte, O., and Kharrat, T. (2020). Deep
soccer analytics: learning an action-value function for
evaluating soccer players. Data Mining and Knowl-
edge Discovery, 34:1531–1559.
Llana, S., Madrero, P., Fern
´
andez, J., and Barcelona, F.
(2020). The right place at the right time: Advanced
off-ball metrics for exploiting an opponent’s spatial
weaknesses in soccer. In Proceedings of the 14th MIT
Sloan Sports Analytics Conference.
Mehrasa, N., Zhong, Y., Tung, F., Bornn, L., and Mori, G.
(2018). Deep learning of player trajectory represen-
tations for team activity analysis. In 11th mit sloan
sports analytics conference, volume 2, page 3.
Nakahara, H., Tsutsui, K., Takeda, K., and Fujii, K. (2023).
Action valuation of on-and off-ball soccer players
based on multi-agent deep reinforcement learning.
IEEE Access, 11:131237–131244.
Pappalardo, L., Cintia, P., Ferragina, P., Massucco, E., Pe-
dreschi, D., and Giannotti, F. (2019). Playerank: data-
driven performance evaluation and player ranking in
soccer via a machine learning approach. ACM Trans-
actions on Intelligent Systems and Technology (TIST),
10(5):1–27.
Pollard, R. and Reep, C. (1997). Measuring the effective-
ness of playing strategies at soccer. Journal of the
Royal Statistical Society Series D: The Statistician,
46(4):541–550.
Rahimian, P., da Silva Guerra Gomes, D. G., Berkovics, F.,
and Toka, L. (2022). Let’s penetrate the defense: A
machine learning model for prediction and valuation
of penetrative passes. In International Workshop on
Machine Learning and Data Mining for Sports Ana-
lytics, pages 41–52. Springer.
Rahimian, P., Kim, H., Schmid, M., and Toka, L. (2023).
Pass receiver and outcome prediction in soccer using
temporal graph networks. In International Workshop
on Machine Learning and Data Mining for Sports An-
alytics, pages 52–63. Springer.
Robberechts, P. (2019). Valuing the art of pressing. In
Proceedings of the StatsBomb Innovation In Football
Conference, pages 1–11. StatsBomb.
Robberechts, P., Van Roy, M., and Davis, J. (2023). un-
xpass: Measuring soccer player’s creativity. In Pro-
ceedings of the 29th ACM SIGKDD conference on
knowledge discovery and data mining, pages 4768–
4777.
Rudd, S. (2011). A framework for tactical analysis and
individual offensive production assessment in soccer
using markov chains. In New England symposium on
statistics in sports.
Simpson, I., Beal, R. J., Locke, D., and Norman, T. J.
(2022). Seq2event: Learning the language of soccer
using transformer-based match event prediction. In
Proceedings of the 28th ACM SIGKDD Conference on
Knowledge Discovery and Data Mining, pages 3898–
3908.
SkySports (2024). Expected goals, expected assists, pres-
sures, carries, high turnovers and more — advanced
stats explained. Available at: https://www.skysports.
com/football/news/11095/12829539/expected-goals
-expected-assists-pressures-carries-high-turnovers-a
nd-more-advanced-stats-explained (Accessed: June
5, 2025).
Soccerment (2022). Measuring pressing success: Buildup
disruption percentage (bdp). Available at: https://socc
erment.com/measuring-pressing-success-buildup-dis
ruption-percentage-bdp/ (Accessed: July 23, 2025).
Spearman, W. (2018). Beyond expected goals. In Proceed-
ings of the 12th MIT sloan sports analytics confer-
ence, pages 1–17.
StatsPerform (2012). Assessing the performance of premier
league goalscorers. stats perform. Available at: https:
//www.statsperform.com/resource/assessing-the-per
formance-of-premier-league-goalscorers/ (Accessed:
June 5, 2025).
icSPORTS 2025 - 13th International Conference on Sport Sciences Research and Technology Support
88

St
¨
ockl, M., Seidl, T., Marley, D., and Power, P. (2021).
Making offensive play predictable-using a graph con-
volutional network to understand defensive perfor-
mance in soccer. In Proceedings of the 15th MIT sloan
sports analytics conference, volume 2022.
Teranishi, M., Tsutsui, K., Takeda, K., and Fujii, K. (2022).
Evaluation of creating scoring opportunities for team-
mates in soccer via trajectory prediction. In Interna-
tional Workshop on Machine Learning and Data Min-
ing for Sports Analytics, pages 53–73. Springer.
Toda, K., Teranishi, M., Kushiro, K., and Fujii, K. (2022).
Evaluation of soccer team defense based on prediction
models of ball recovery and being attacked: A pilot
study. Plos one, 17(1):e0263051.
Trainor, C. (2014). Defensive metrics: Measuring the in-
tensity of a high press. Available at: https://www.hu
dl.com/blog/defensive-metrics-measuring-the-intensi
ty-of-a-high-press (Accessed: July 23, 2025).
UEFA (2021). Season 2020 stats — uefa euro 2020. Avail-
able at: https://www.uefa.com/uefaeuro/history/seas
ons/2020/statistics/ (Accessed: June 5, 2025).
Umemoto, R. and Fujii, K. (2023). Evaluation of team de-
fense positioning by computing counterfactuals using
statsbomb 360 data. In Statsbomb conference pro-
ceedings.
Wang, Z., Veli
ˇ
ckovi
´
c, P., Hennes, D., Toma
ˇ
sev, N., Prince,
L., Kaisers, M., Bachrach, Y., Elie, R., Wenliang,
L. K., Piccinini, F., et al. (2024). Tacticai: an ai as-
sistant for football tactics. Nature communications,
15(1):1906.
Yeung, C. and Fujii, K. (2024). A strategic framework for
optimal decisions in football 1-vs-1 shot-taking situ-
ations: An integrated approach of machine learning,
theory-based modeling, and game theory. Complex &
Intelligent Systems, pages 1–20.
Yeung, C., Sit, T., and Fujii, K. (2025). Transformer-based
neural marked spatio temporal point process model for
analyzing football match events. Applied Intelligence,
55(5):1–17.
A Generalized Valuation Method for Team Defense by Estimating Probabilities in Football Games
89
